Help
Advanced Reports in ManageEngine NetFlow Analyzer are designed to provide network administrators with comprehensive visibility into traffic behavior through highly customizable reporting features. Unlike predefined reports, which come with fixed templates, Advanced Reports empower users to define their own report structure based on operational requirements, analysis depth, and compliance needs. Reports are generated in a tabular format and can be sorted, grouped, filtered, scheduled, and exported, offering flexibility and precision in traffic monitoring and diagnostics.
A real-world example of using Advanced Reports in NetFlow Analyzer involves diagnosing unexpected bandwidth spikes during office hours. In one instance, a network team noticed consistent internet slowness between 10am and 1pm.Using Advanced Reports, the team created a custom view grouped by source IP and application for that specific time window. The report revealed that a marketing workstation was consuming excessive bandwidth while uploading large video files to a cloud storage service
With this insight, the administrator adjusted QoS policies and scheduled the report to monitor future anomalies proactively.
With its extensive customization options, sorting and filtering capabilities, and robust export and scheduling functions, the Advanced Reports module in NetFlow Analyzer is an indispensable tool for in-depth network traffic analysis. It transforms raw flow data into actionable intelligence that supports both real-time monitoring and historical reporting needs.
Advanced Reports supports two primary types of reporting perspectives:
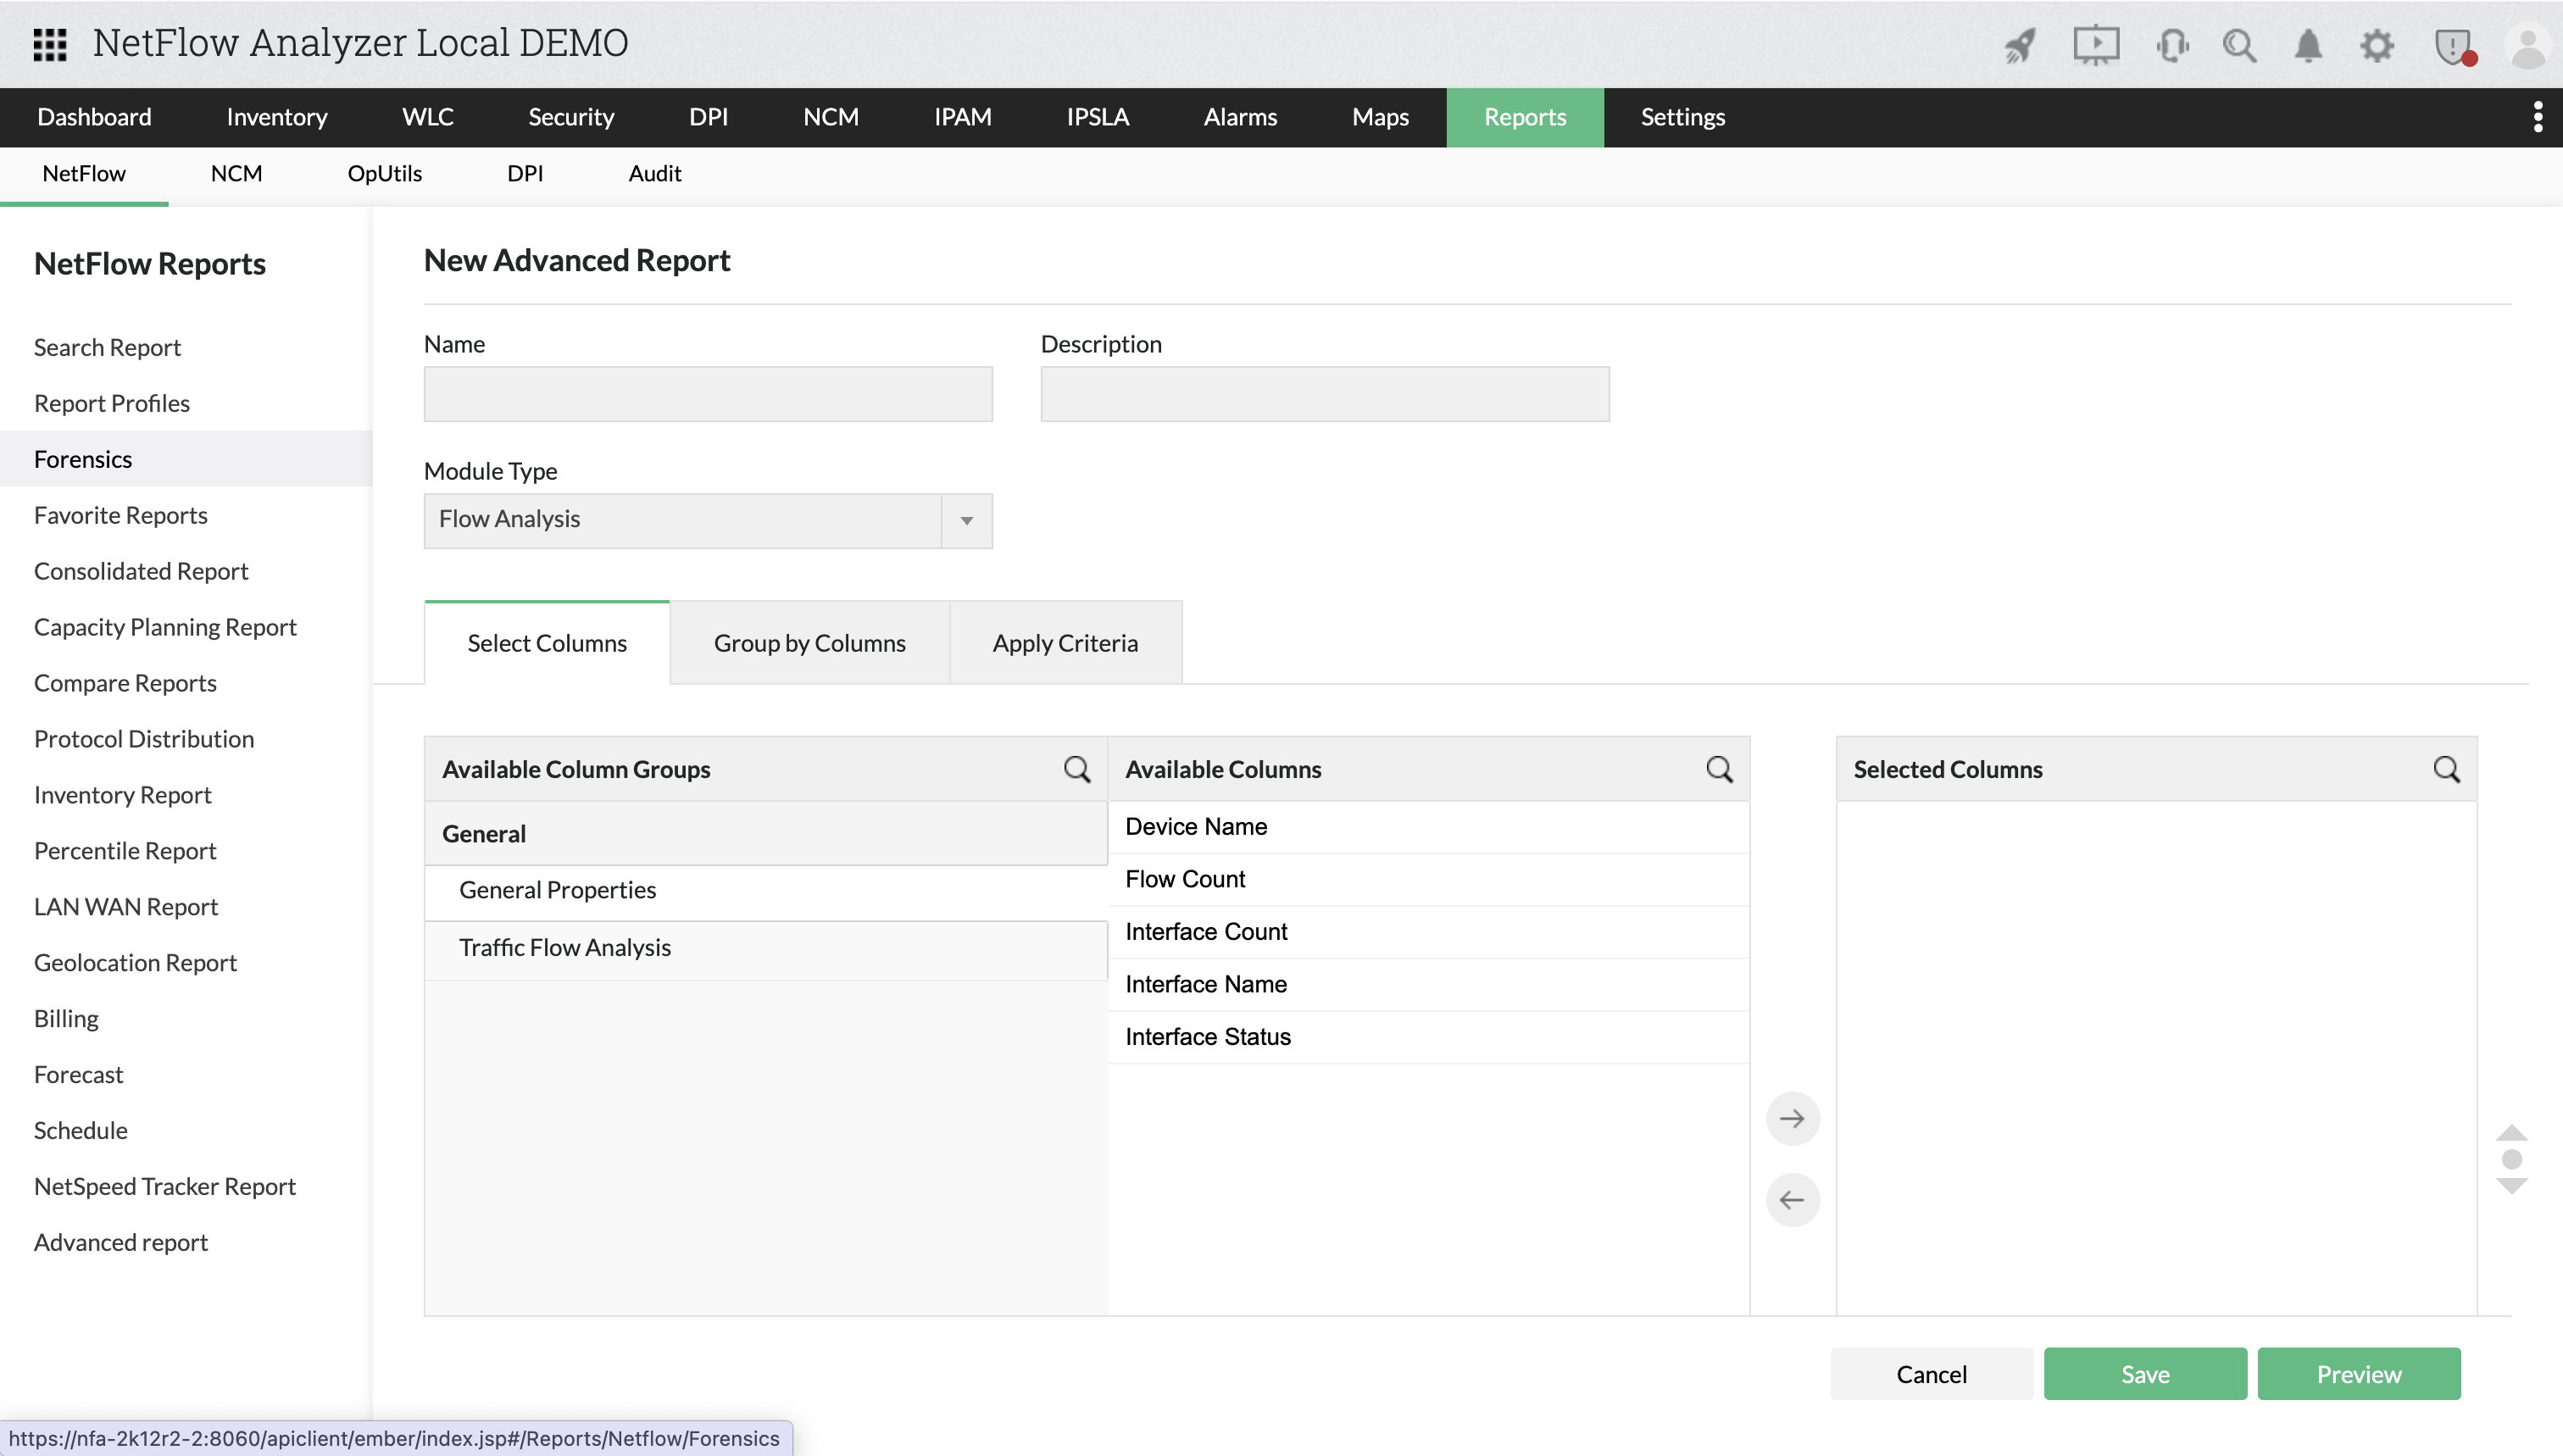
These are used to monitor interface-specific parameters, such as flow volume and interface health, and include details such as device name, flow count, interface count, interface name, and status. These metrics help in identifying issues related to network stability and device-level traffic load.
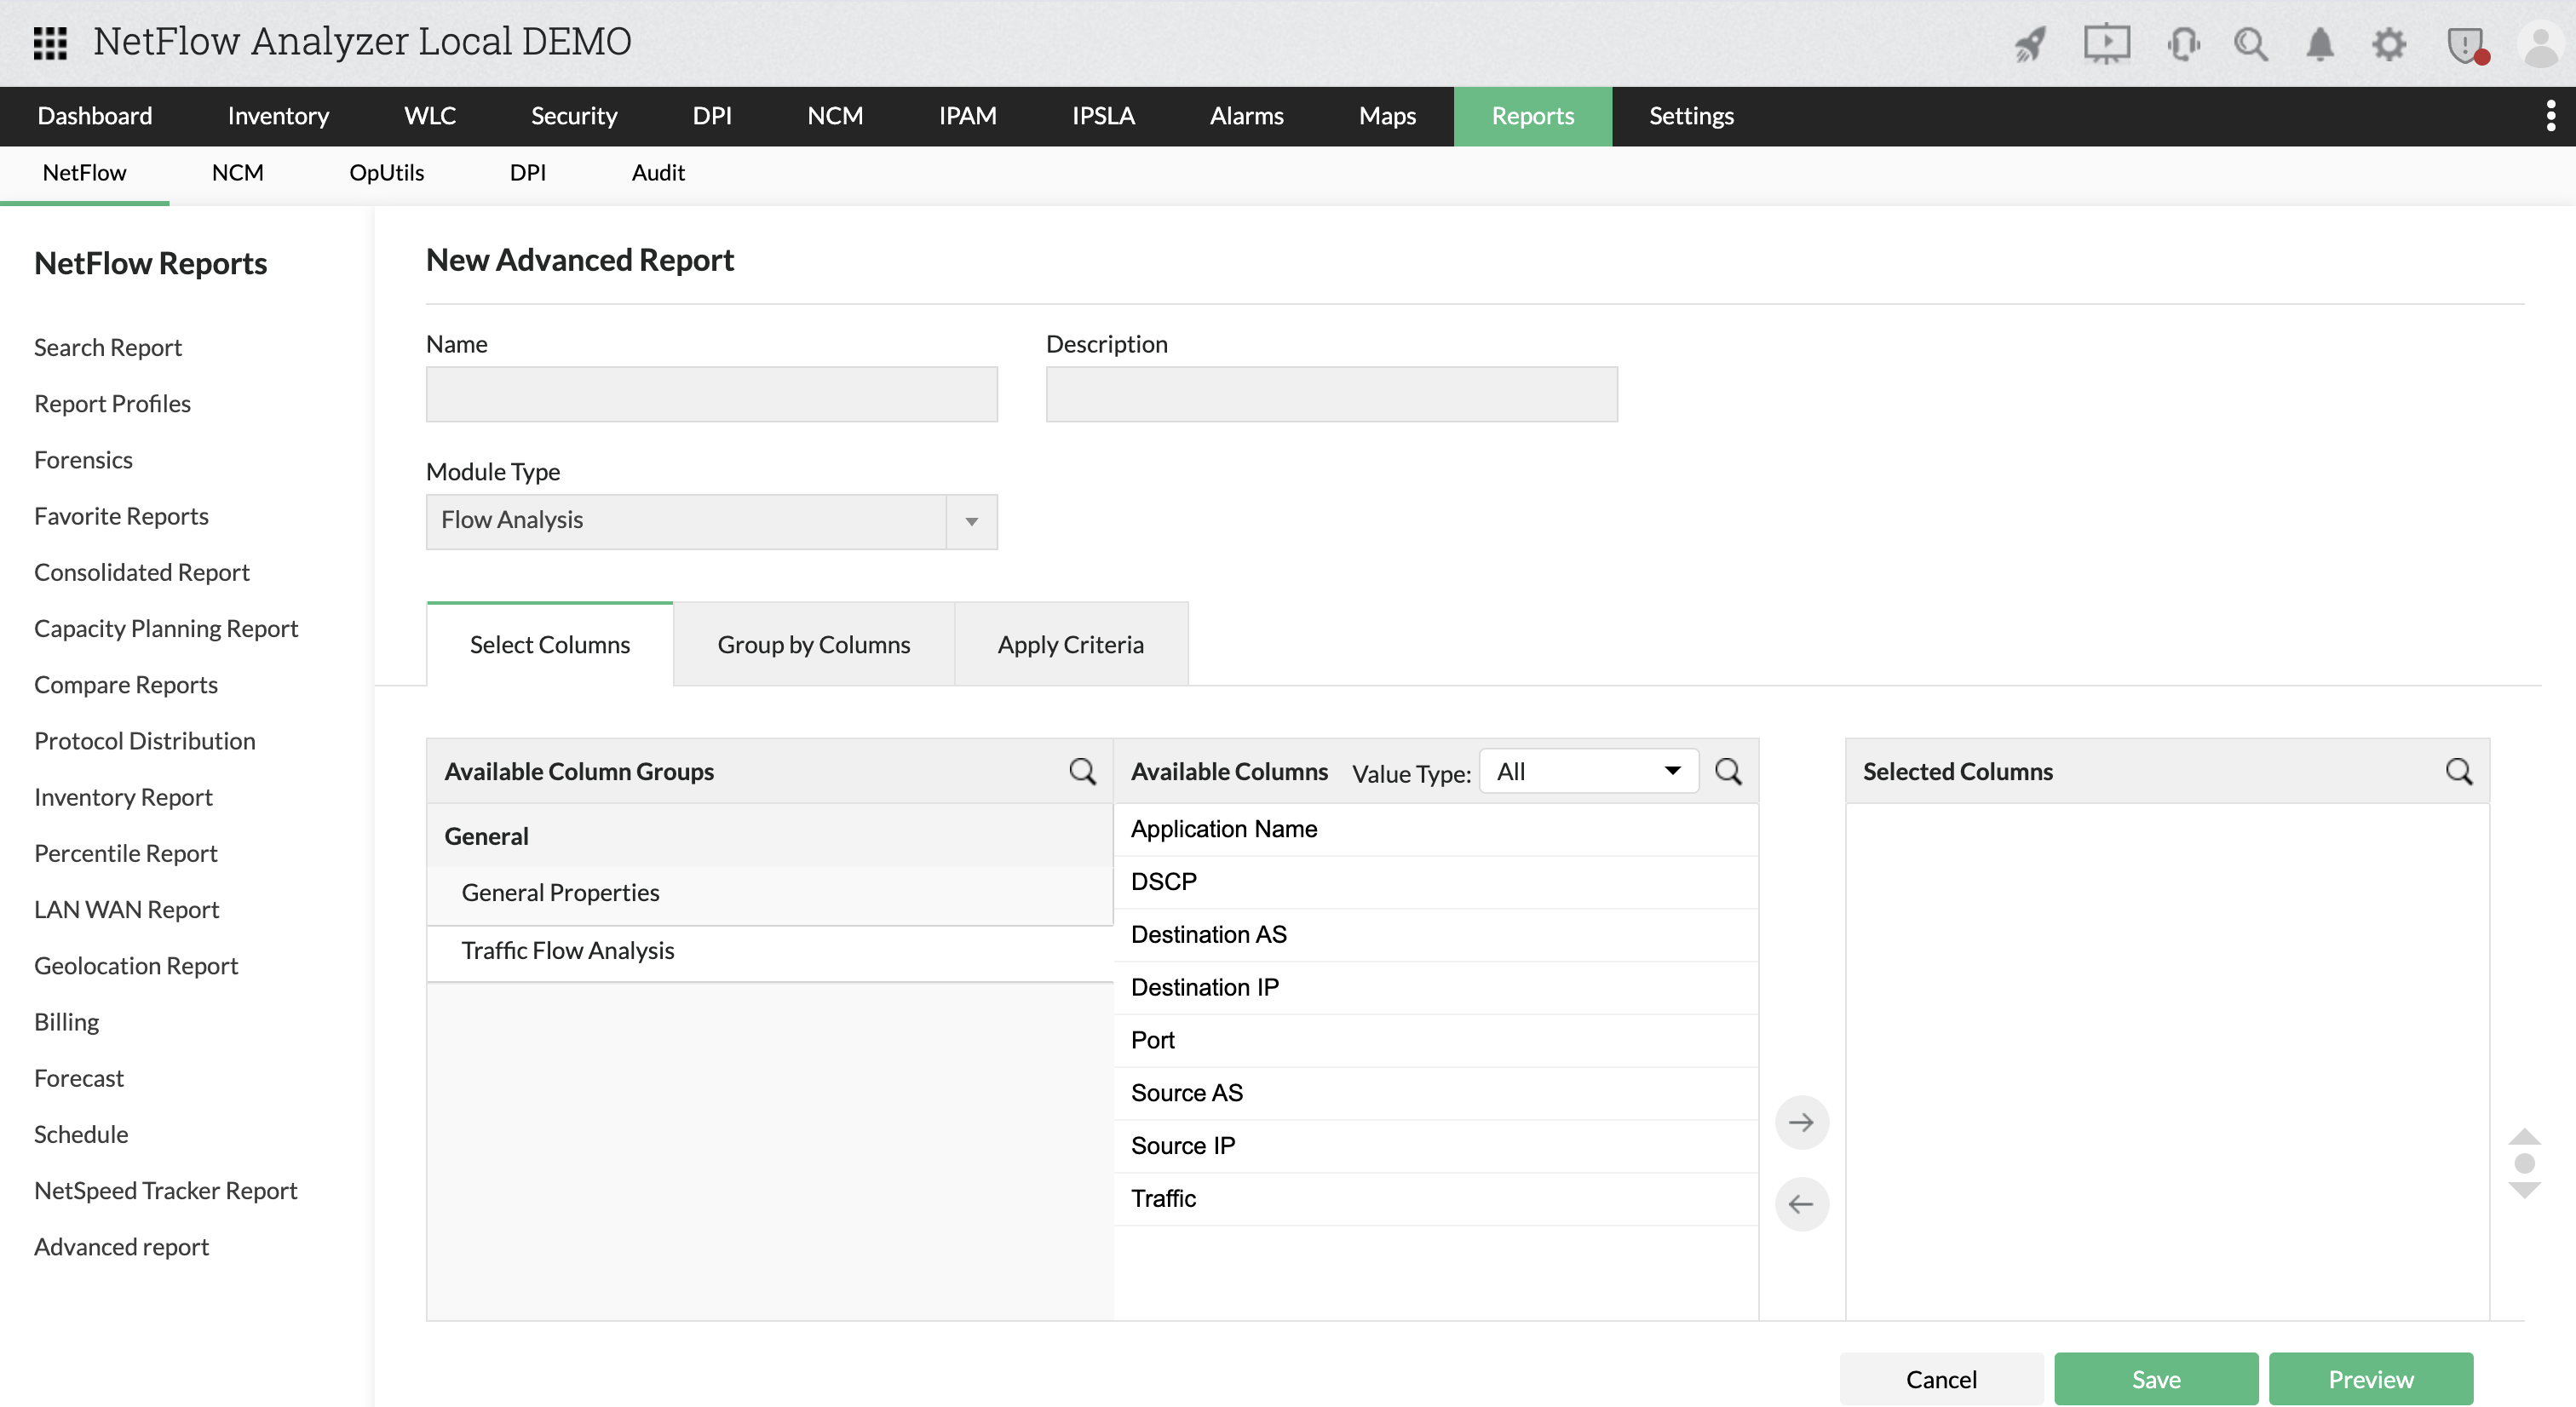
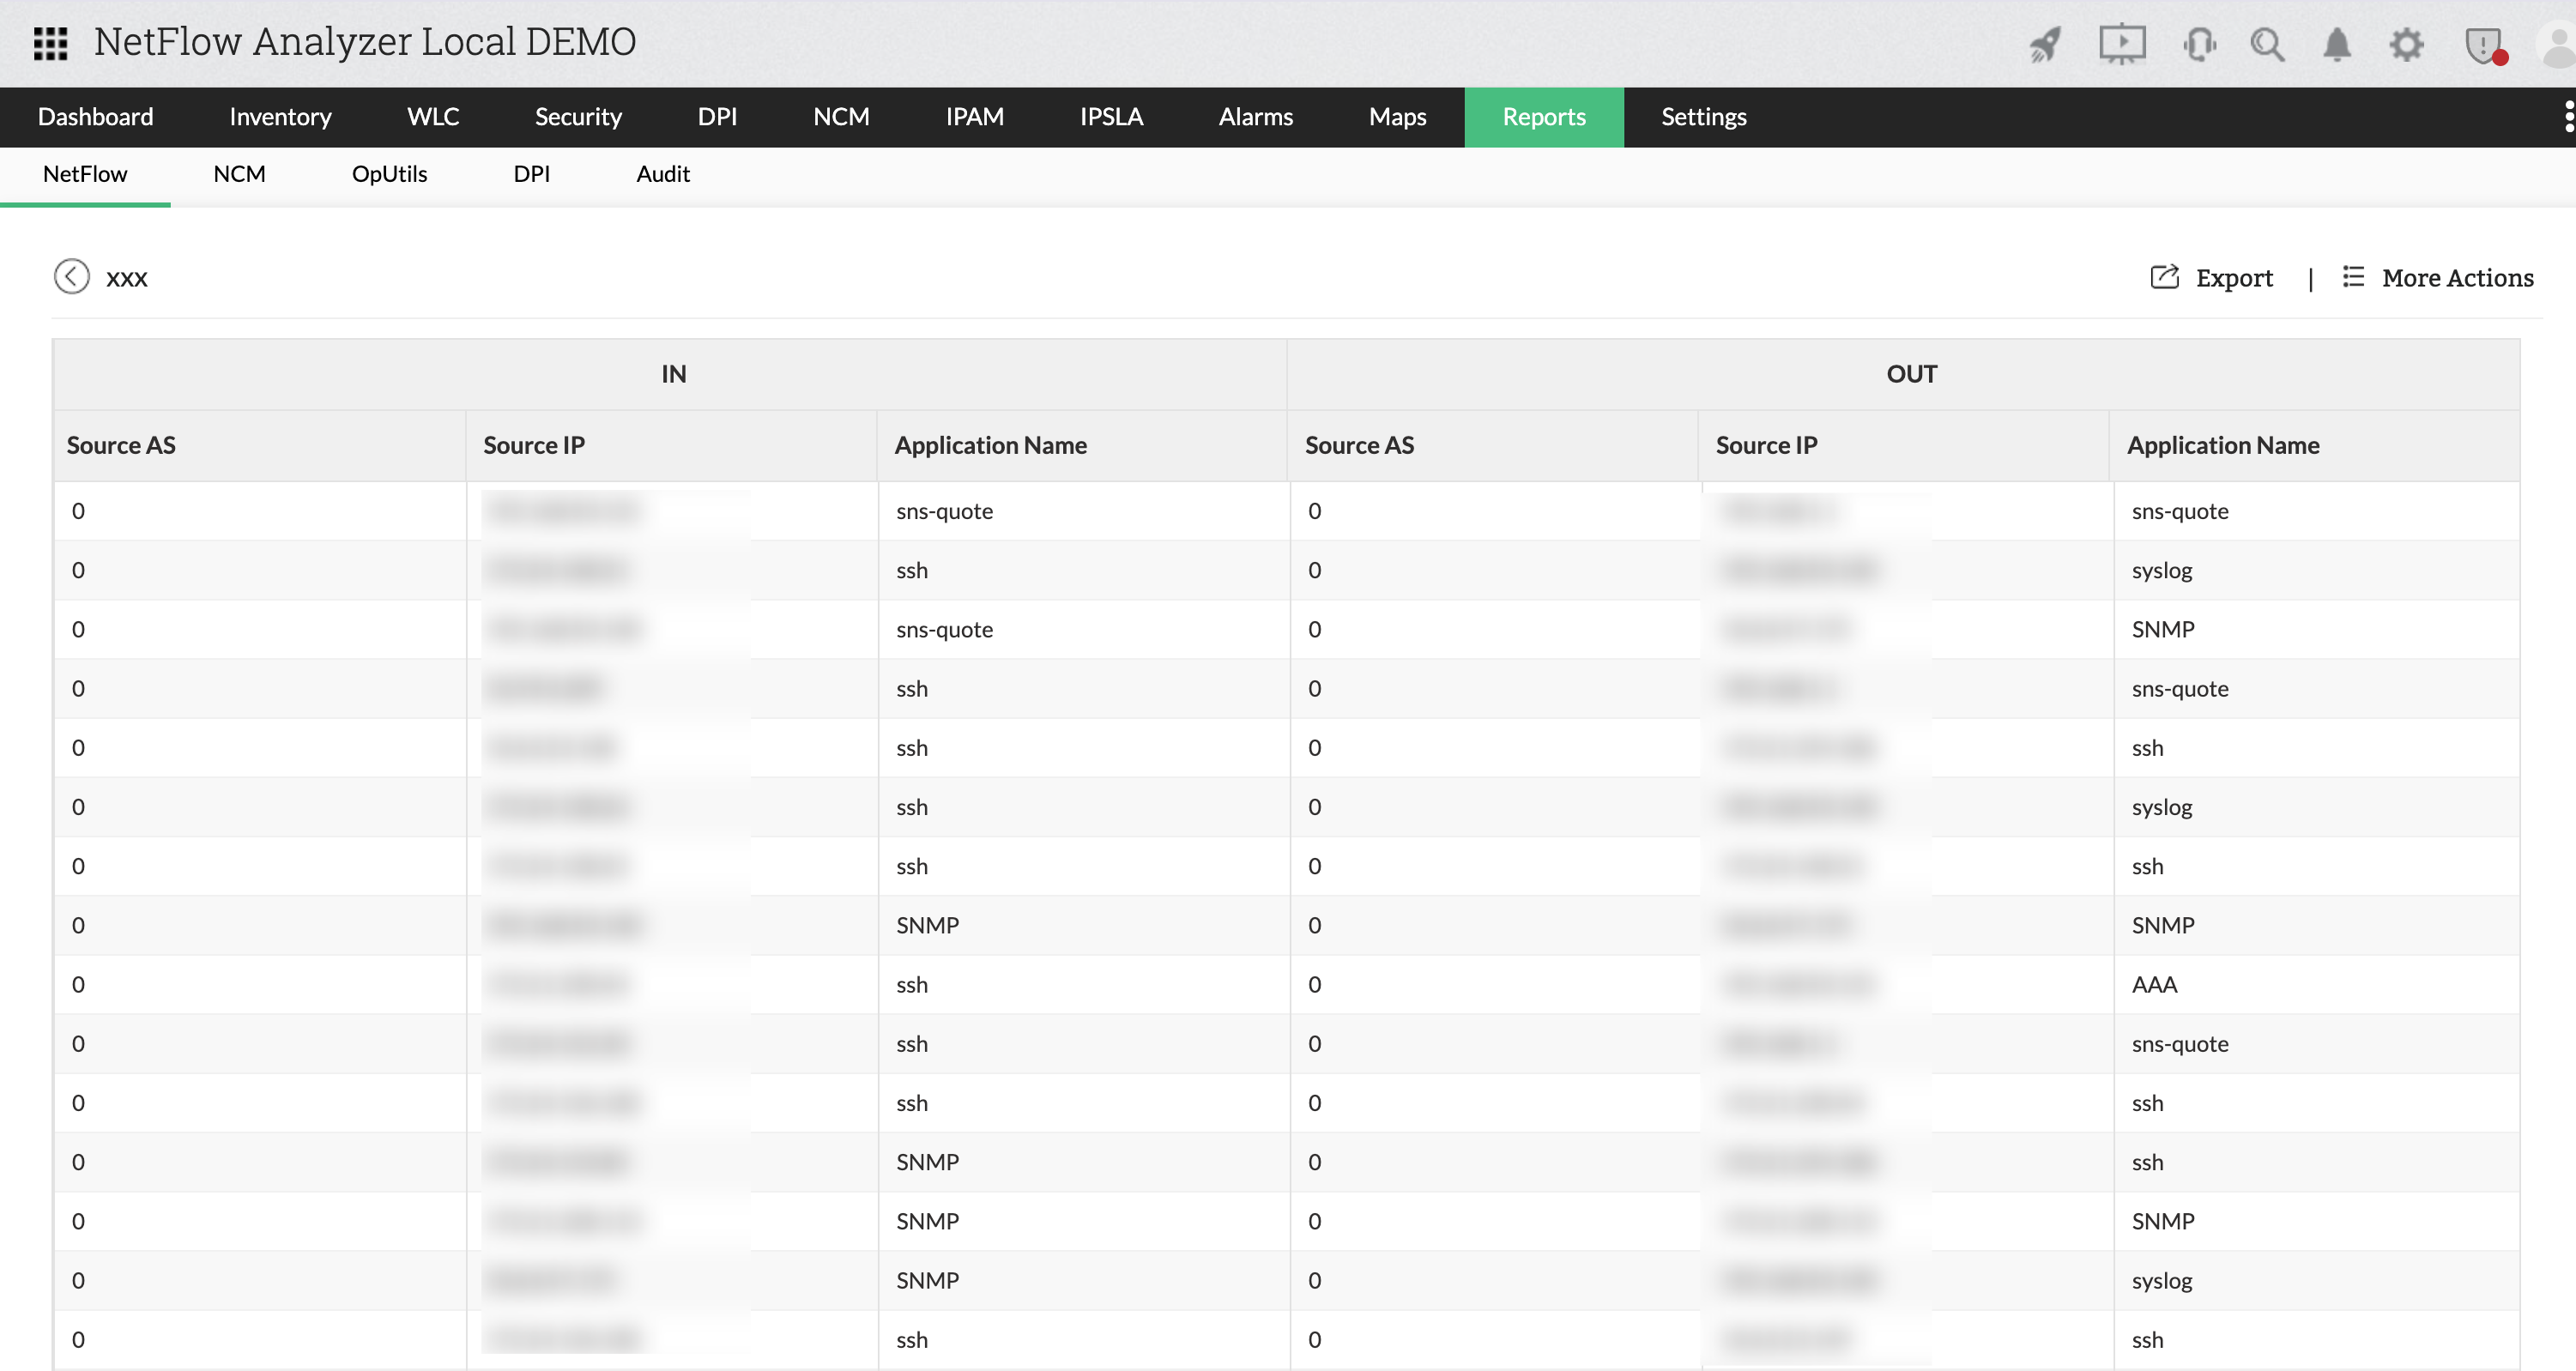
This component focuses on data flow across the network, offering insights into traffic source and destination. It supports data columns like application name, DSCP, destination and source autonomous systems (AS), IP addresses, ports, and traffic volume. This data is essential for understanding traffic behavior, diagnosing unusual activity, and optimizing data distribution across interfaces.
| Operation | Applicability |
|---|---|
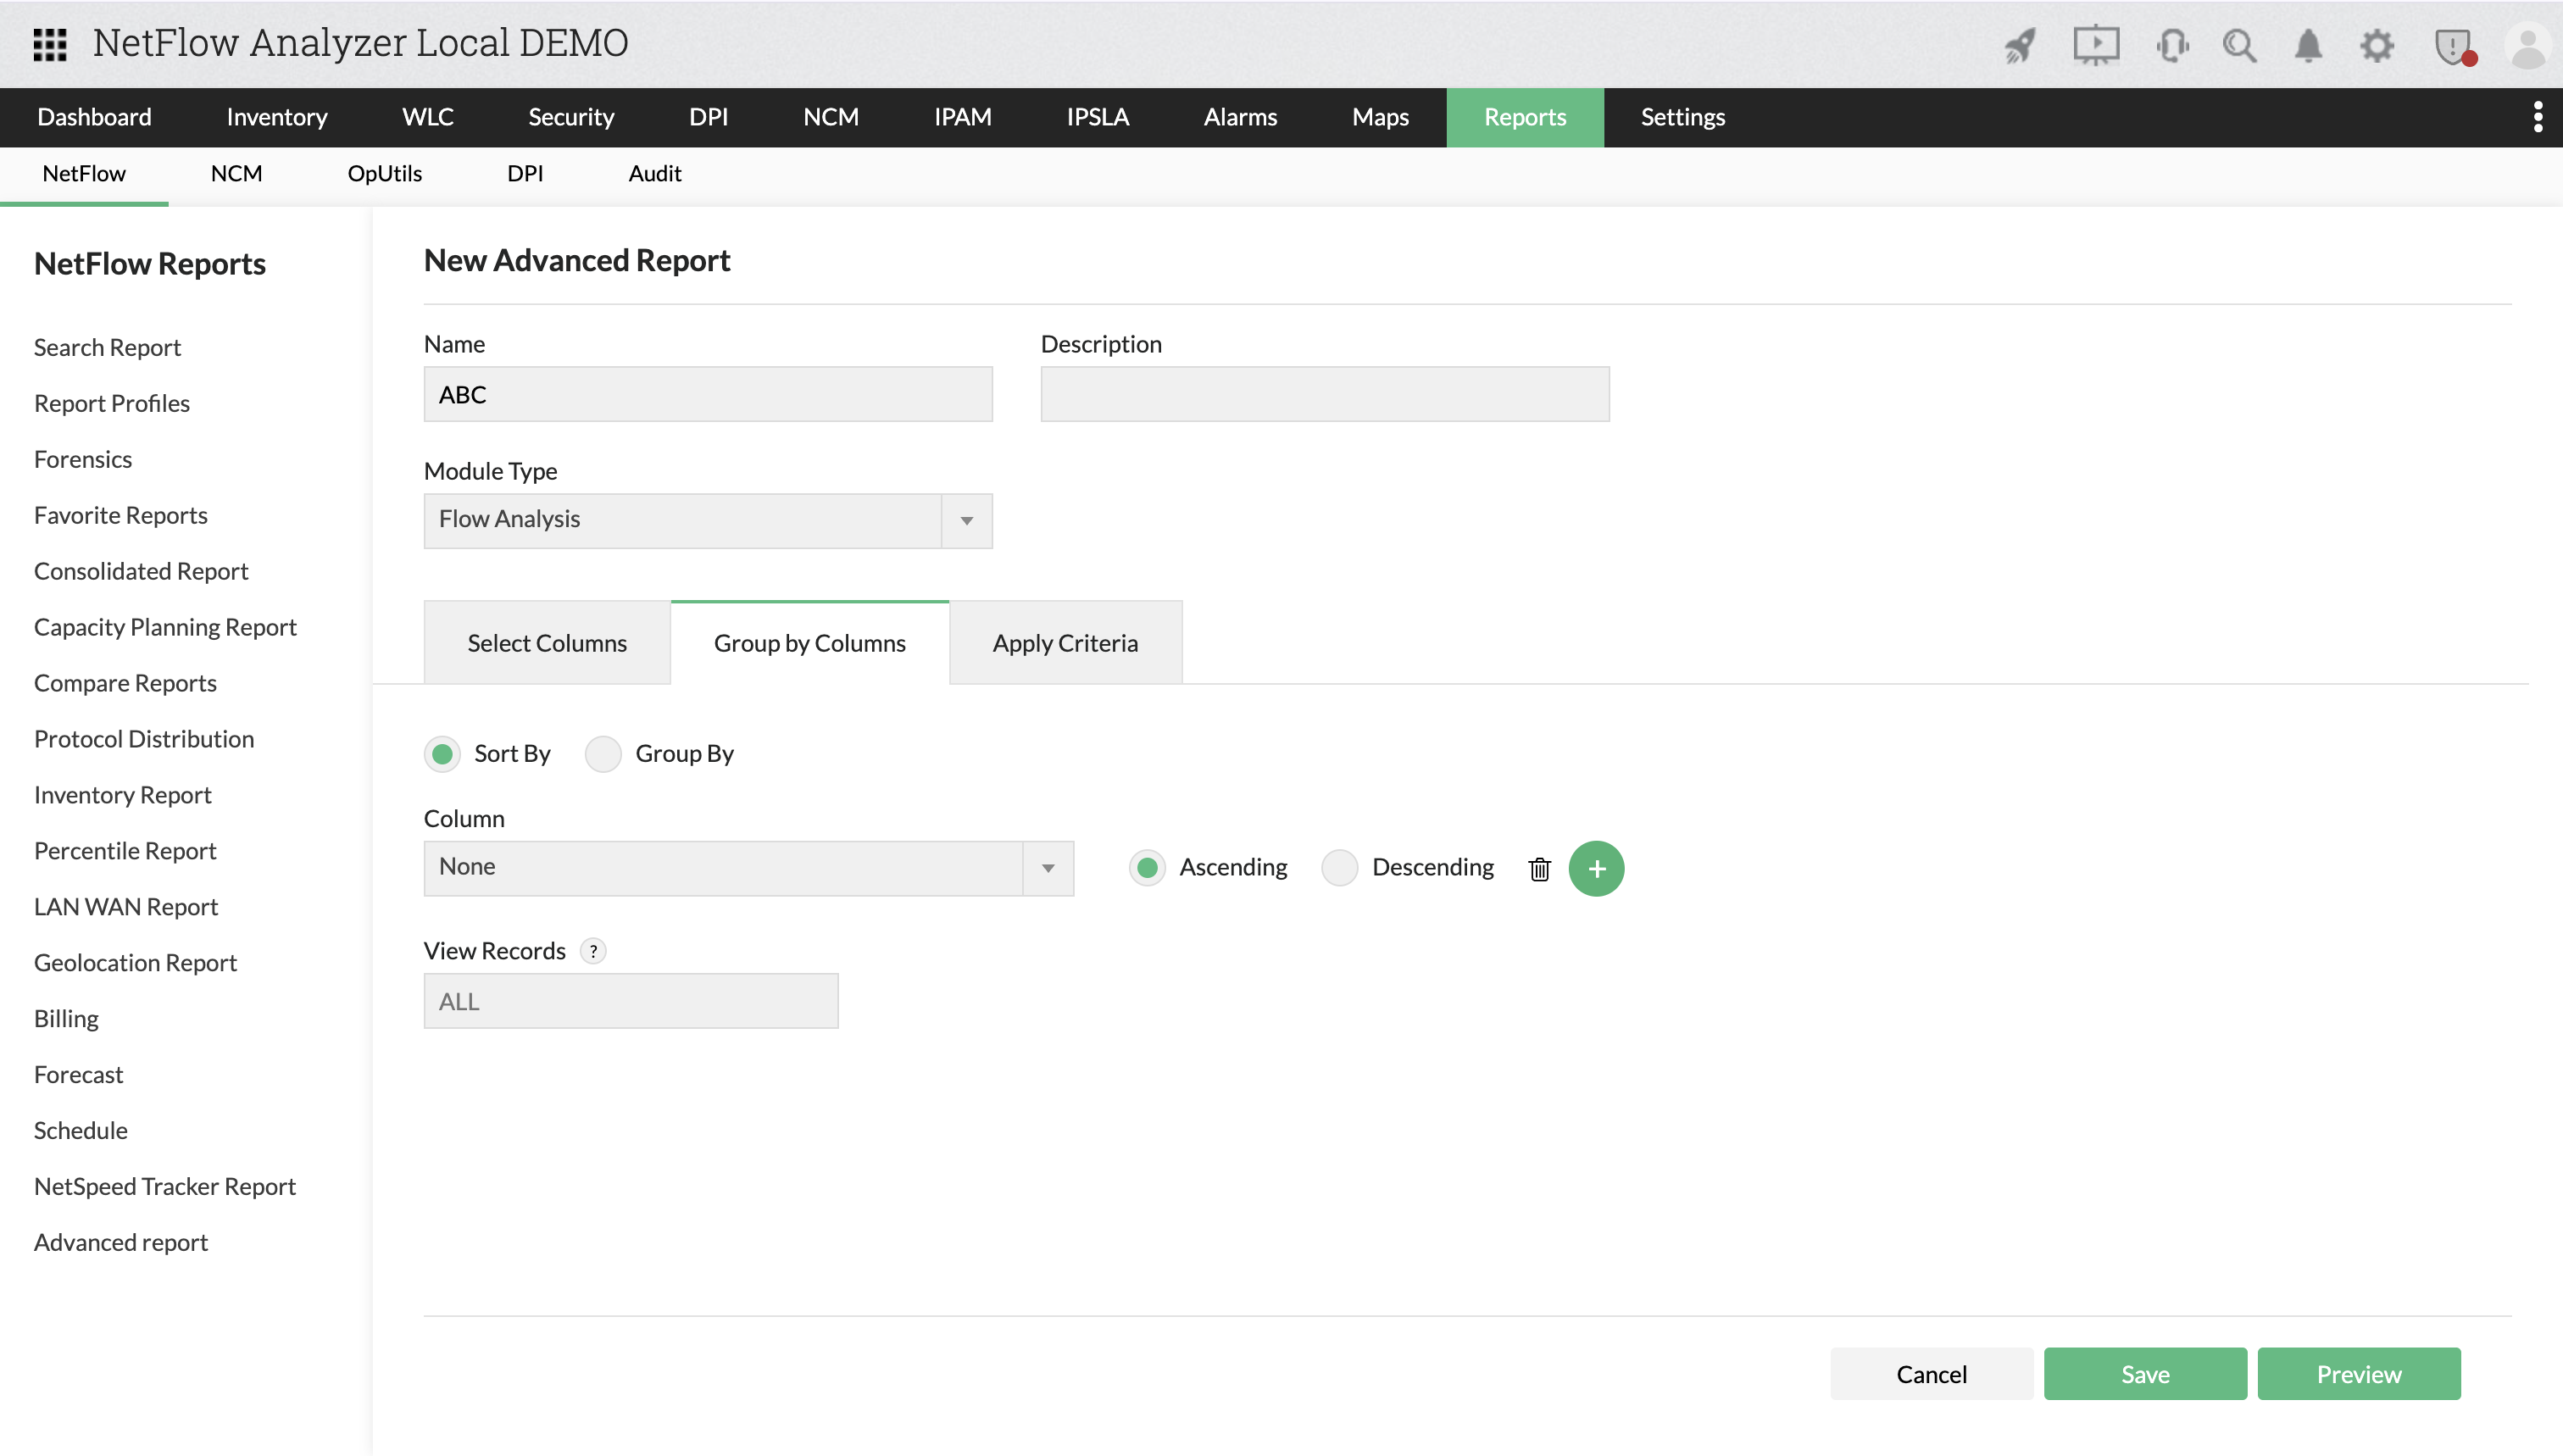
| Sorting | Available for all data columns |
| Grouping | Available for all data columns |
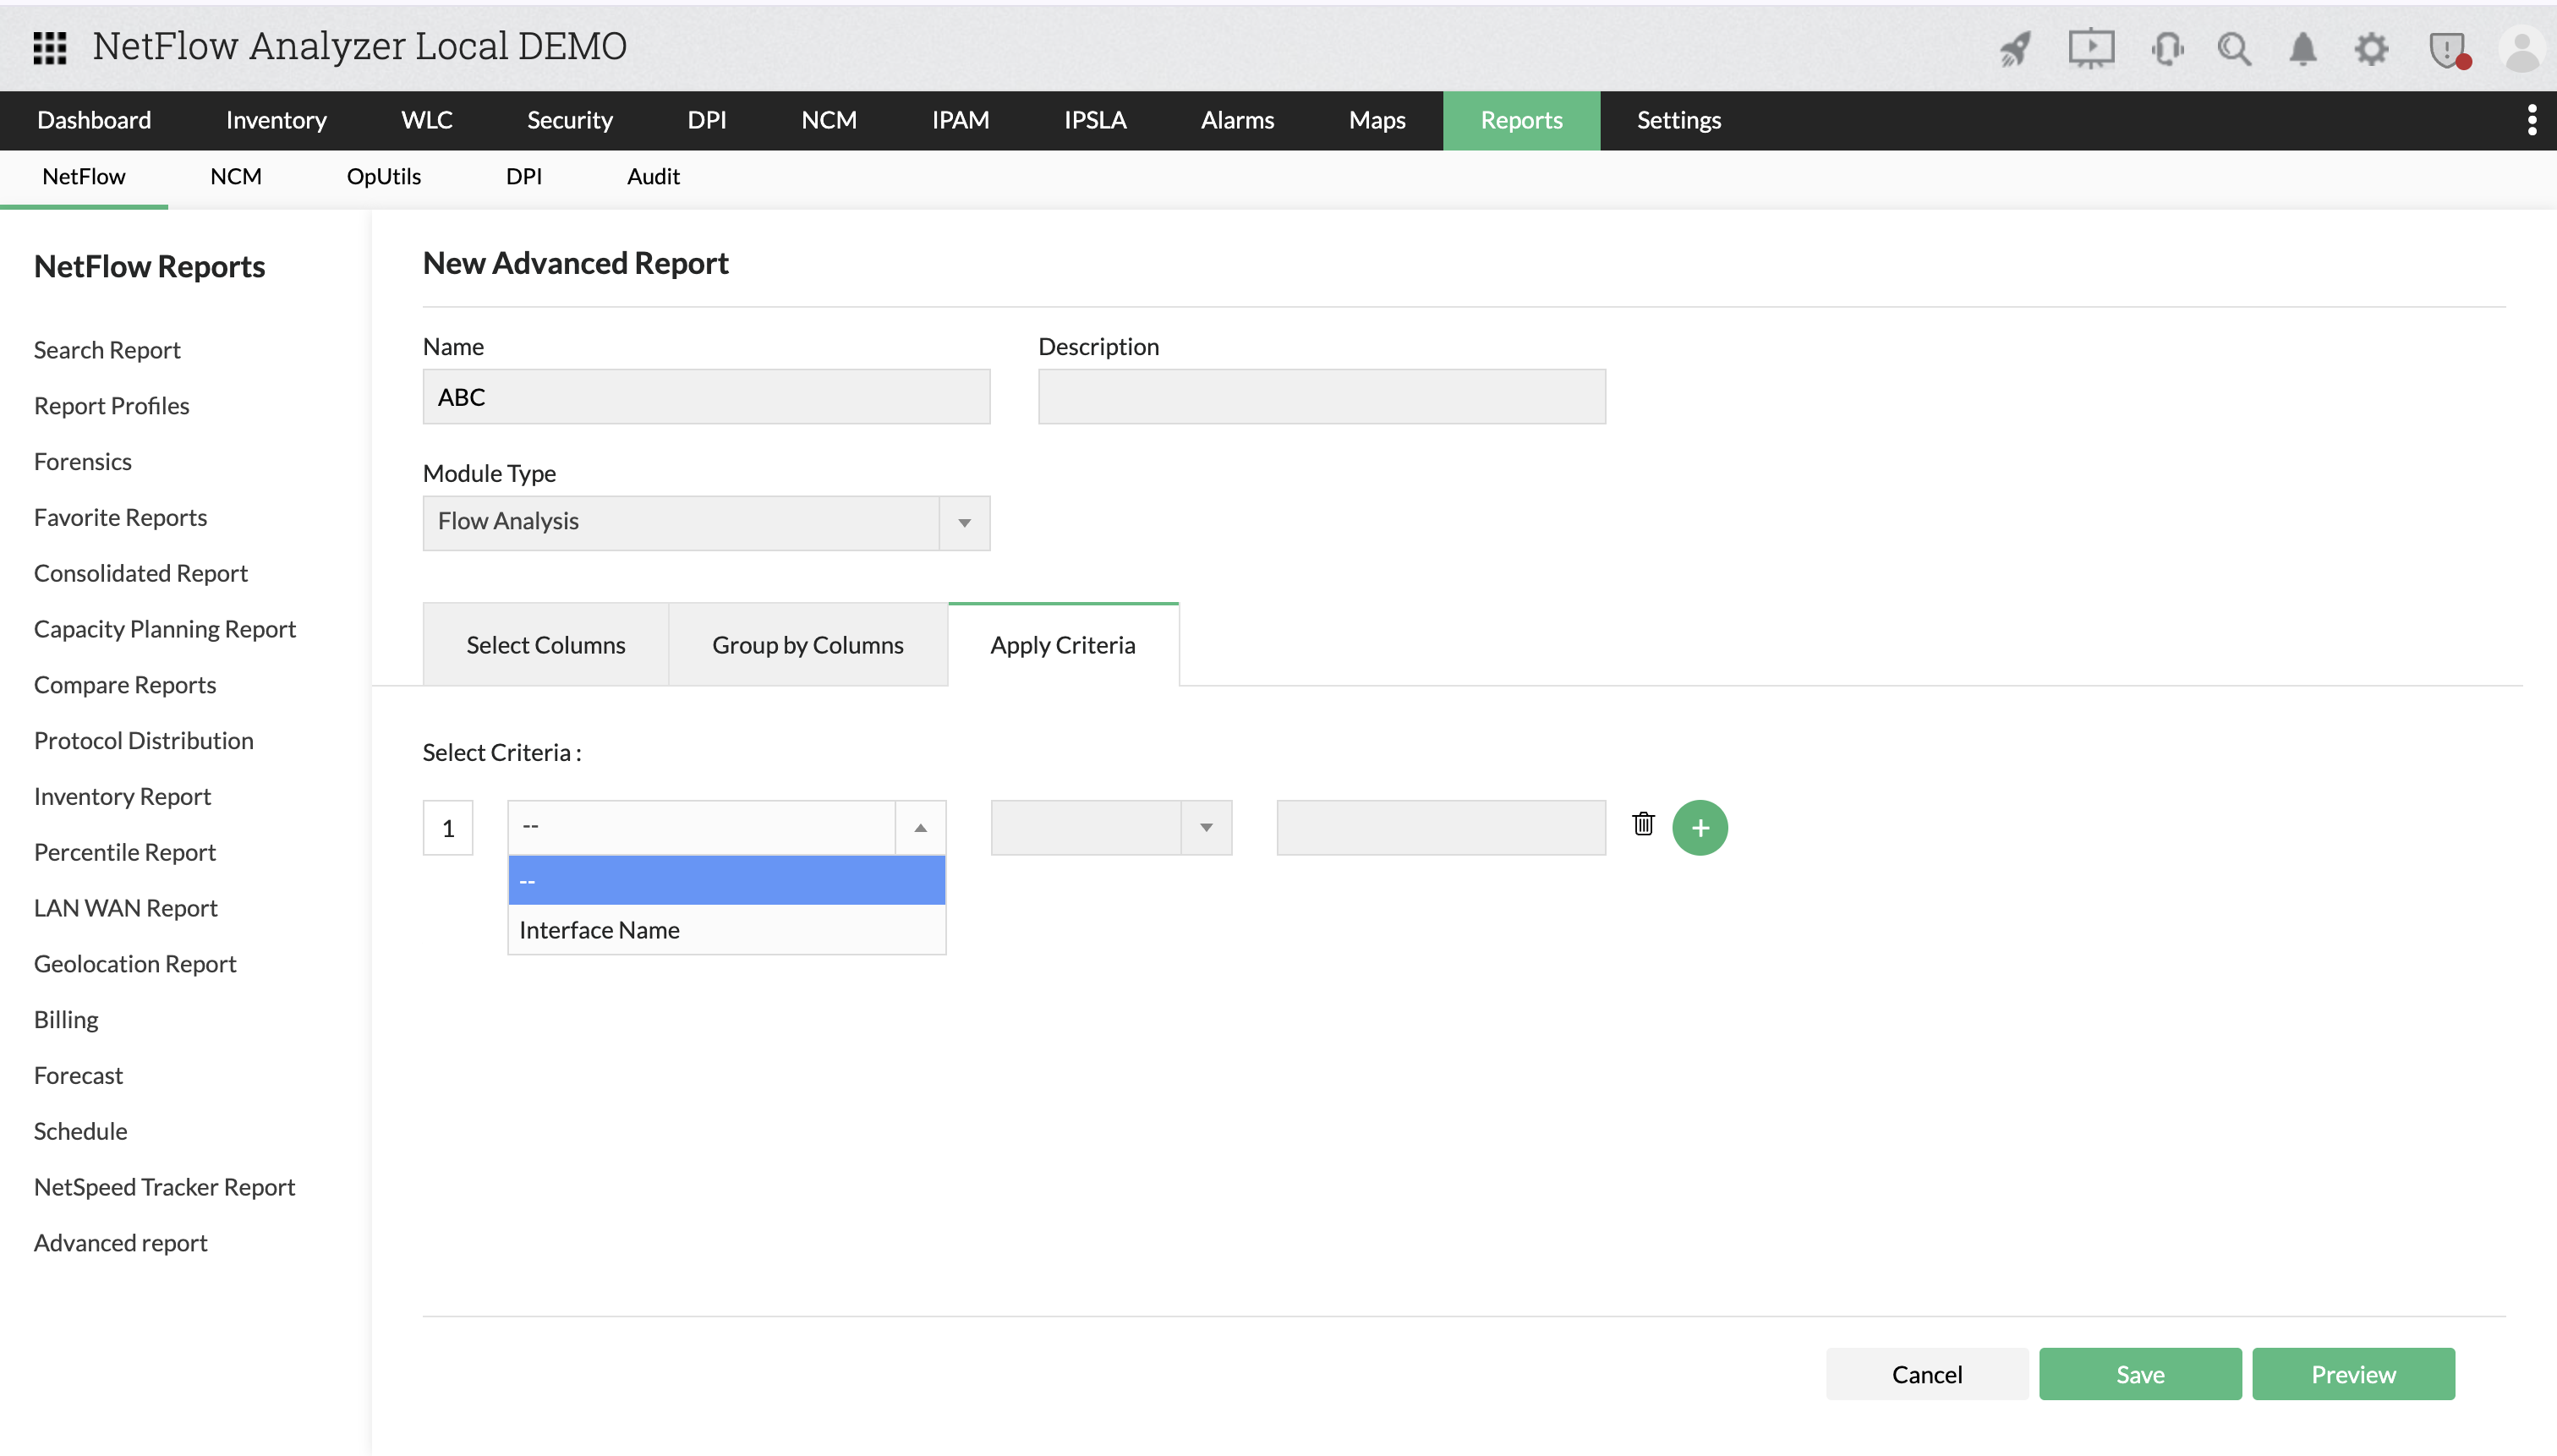
| Apply Criteria | Filtering applicable for all data columns except Interface Count and Flow Count |
Thank you for your feedback!