Network Traffic Monitoring Tool
Gain full control over your network with NetFlow Analyzer, a comprehensive network traffic analysis tool
What is network traffic monitoring tool?
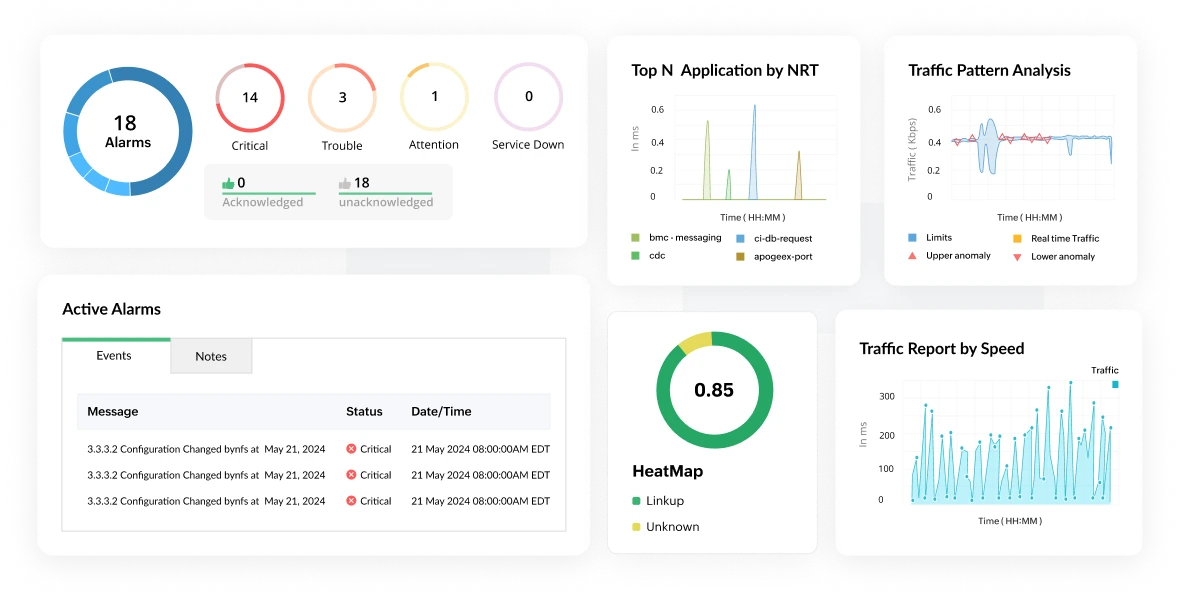
Every organization, at some point, hits a wall with their network. Applications slow to a crawl, the helpdesk fills up with complaints, and the IT team is left guessing what caused it. More often than not, the answer is sitting in the traffic data, if only someone had been watching it. That is exactly what network traffic monitoring software is built to solve. Network traffic monitoring software collects and analyzes the flow of data moving across your network in real time, so your team can see what is happening, where, and why. It works by reading flow records exported from your routers, switches, and firewalls using protocols like NetFlow, sFlow, and IPFIX, then turning that raw data into dashboards, alerts, and reports your team can actually act on.
This is different from basic uptime monitoring, which only tells you whether a device is responding. Traffic monitoring goes a level deeper. It shows you what is moving across the network, who is consuming the most bandwidth, and which applications are driving that consumption. For organizations managing a mix of on-premises infrastructure and cloud environments, having this level of visibility in one place is not a luxury. It is how modern network teams catch bandwidth bottlenecks, spot security threats early, and make capacity decisions before a slow link becomes a business problem.
How it works
Network devices generate flow records for every conversation passing through them. These records are exported to a central collector, which processes them into a continuous, real-time picture of your network traffic. What makes this powerful is the enrichment layer. Raw flow data, just IP addresses, ports, and byte counts, gets translated into meaningful context: which application, which user, which department, and whether the behavior matches what is normal for that part of your network. That context is what separates traffic monitoring from basic uptime checks. A device being "up" tells you nothing about a server quietly sending gigabytes of data to an unfamiliar external IP at 3 AM. Flow analysis does.
What happens without it
Skipping network traffic monitoring rarely causes problems immediately. The issues tend to build quietly and surface at the worst possible moment.
Congestion that nobody catches in time
Bandwidth bottlenecks are notoriously difficult to diagnose after the fact. Without continuous traffic data, your team is left reconstructing what happened from incomplete logs and user complaints rather than identifying the problem while it is still occurring.
Security threats that move undetected
Network-layer attacks including DDoS floods, internal lateral movement, and data being quietly exfiltrated all have distinct traffic signatures. Without monitoring software watching for those patterns, they can persist for days or weeks before anyone notices.
Budget going to the wrong places
Capacity decisions made without real traffic data are essentially guesswork. Some links get over-provisioned while genuinely constrained paths go unaddressed. Traffic monitoring brings the evidence needed to spend infrastructure budget where it will actually make a difference.
QoS policies that exist only on paper
A quality-of-service policy is only as good as your ability to verify it. Without traffic visibility, there is no reliable way to confirm that your most critical applications are actually getting the priority they have been assigned.
Network traffic monitoring software: A comparison guide
Choosing the right network traffic monitoring software depends on your environment size, protocol requirements, and whether you need security analytics alongside performance monitoring. Here is how the leading platforms currently stack up.
| Tool | Best for | Flow protocols | Standout feature |
|---|---|---|---|
| ManageEngine NetFlow Analyzer | Mid-to-large enterprise | NetFlow v5/v9, IPFIX, sFlow, jFlow, AppFlow | DPI + Security Analytics, zero-day detection |
| SolarWinds NTA | Large enterprise, NOC teams | NetFlow v5/v9, IPFIX, sFlow, NBAR | Orion platform integration |
| PRTG NTA | SMB, all-in-one monitoring | NetFlow v5/v9, sFlow, IPFIX, jFlow | Sensor-based licensing |
| Datadog NPM | Cloud-native, DevOps teams | eBPF, NetFlow (via agent) | Pod-level flow visibility |
| ntopng | Open-source deployments | NetFlow, sFlow, IPFIX, nProbe | Open-source DPI |
| Wireshark | Packet forensics, engineers | Live capture, all protocols | Deep packet inspection |
Eight things to look for when evaluating network traffic monitoring tool
Not every platform is built the same. These are the capabilities that consistently separate tools that genuinely help from those that look good in a demo but fall short in practice.
These are non-negotiable must-have features:
- Real-time visibility: Flow data that is several minutes old is not much use when you are troubleshooting an active incident. Look for platforms that process and display traffic data with minimal delay, with dashboards that update continuously rather than on a polling cycle.
- Threshold-based alerting: A good alerting system lets you define exactly what matters, such as a specific interface crossing 80% utilization, a particular application generating unusual volume, or a source IP behaving outside its baseline. Alerts should be configurable enough to be useful without being noisy enough to be ignored.
- Enough history to investigate properly: When something goes wrong at 2 AM and nobody catches it until the morning, you need traffic data going back hours and ideally days. Platforms that retain granular flow records rather than just aggregated summaries give your team a fighting chance at reconstructing what actually happened.
Once the basics are covered, these are the advanced capabilities worth evaluating:
- Security that is built in, not bolted on: Some platforms treat security as an add-on. The better approach is monitoring software that actively baselines normal behavior and flags deviations, catching things like DDoS traffic, port scanning, or unusual outbound connections without requiring a separate security tool in the chain.
- Multi-protocol flow support: Your environment probably includes hardware from more than one vendor. NetFlow dominates Cisco infrastructure, sFlow is common in HP and Arista environments, and IPFIX is the current IETF standard. A monitoring platform that handles all of them means you do not end up with gaps when you upgrade a switch or add a new device.
- Integrations that reduce manual work: Monitoring data is most valuable when it connects to the tools your team already uses, including ticketing systems, communication platforms, and configuration management. Native integrations cut down on context-switching and manual correlation that slows incident response.
- Hybrid and cloud coverage: On-premises flow data alone is no longer enough. The platform should be able to ingest cloud VPC flow logs alongside traditional flow exports and present everything through the same interface. Managing separate tools for cloud and on-premises traffic quickly becomes its own problem.
- Licensing that scales sensibly: Some platforms charge per device, others per interface, and others per flow volume. Before committing, model your expected usage against each vendor's pricing structure. What looks inexpensive at a small scale can change significantly as your environment grows.
NetFlow Analyzer: what it does and how it works
ManageEngine NetFlow Analyzer is a dedicated network traffic monitoring platform designed around flow data. It supports NetFlow v5 and v9, IPFIX, sFlow, jFlow, and AppFlow, covering virtually any device that exports flow records, and runs on both Windows and Linux without additional infrastructure requirements. Whether you are managing a small regional network or a distributed enterprise environment spanning multiple sites and cloud providers, NetFlow Analyzer is built to scale alongside your infrastructure without requiring you to bolt on separate tools as your needs grow.
Traffic analysis and bandwidth monitoring
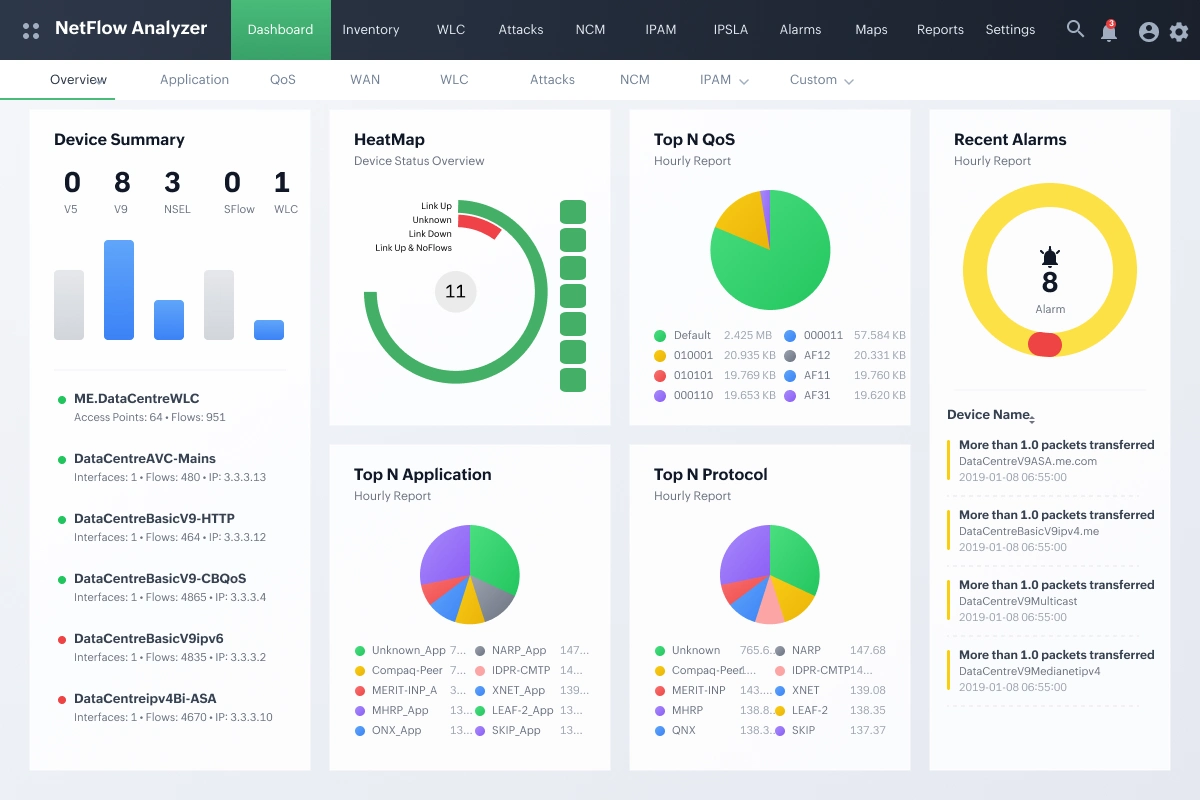
NetFlow Analyzer continuously processes flow records to build a clear picture of what is moving across your network at any given moment. Administrators can drill into individual conversations, track top applications by volume, and identify which users or devices are driving bandwidth consumption, all from a single interface. This level of granularity makes it significantly easier to spot patterns that would otherwise stay buried in aggregate data, such as a single department quietly consuming a disproportionate share of available capacity during business hours.
Deep packet inspection
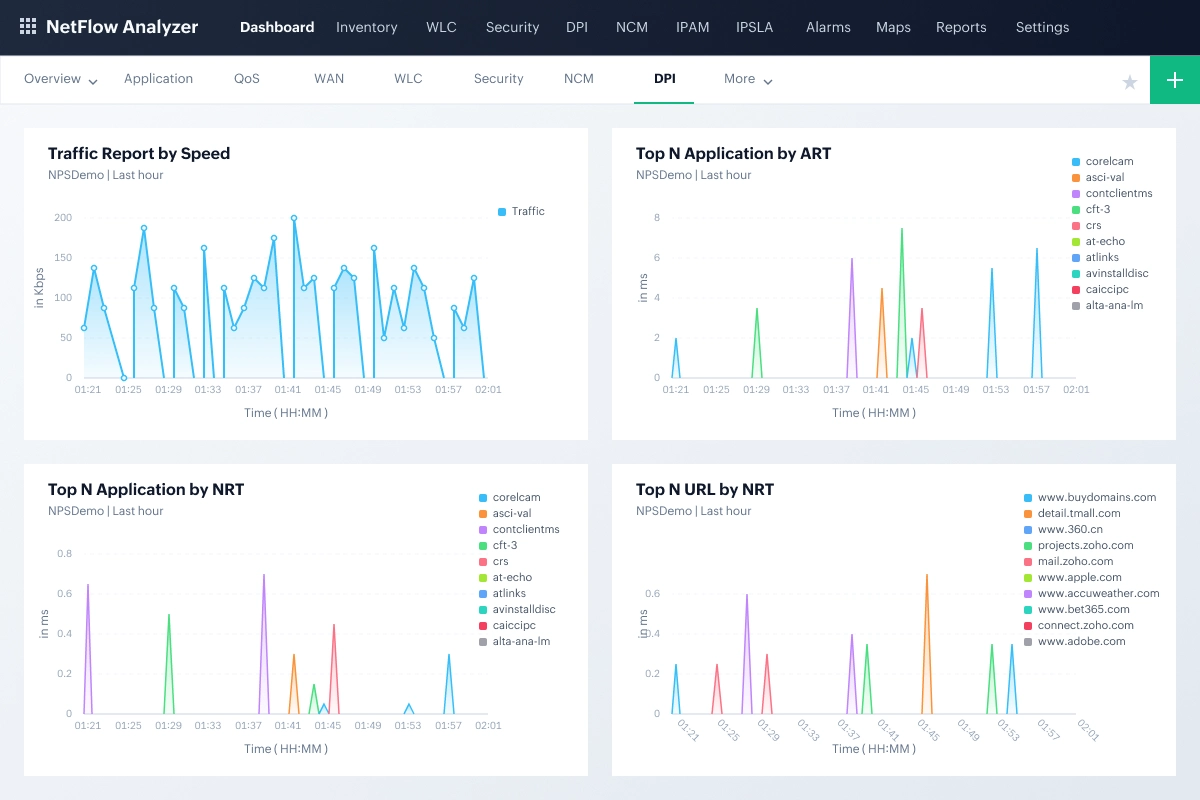
Flow data tells you a great deal, but not everything. For traffic that standard flow classification cannot identify, NetFlow Analyzer's deep packet inspection capability goes further, examining packet content to classify applications accurately even when they use non-standard ports or attempt to blend in with normal traffic. This also enables Layer 7 visibility, so instead of seeing that a device is sending data over port 443, you can see exactly which application is responsible, whether that is Zoom, Microsoft Teams, or an unsanctioned SaaS tool. This is particularly relevant in environments where users rely on cloud applications or collaboration tools that do not always behave predictably from a traffic classification standpoint.
Forensics and incident investigation
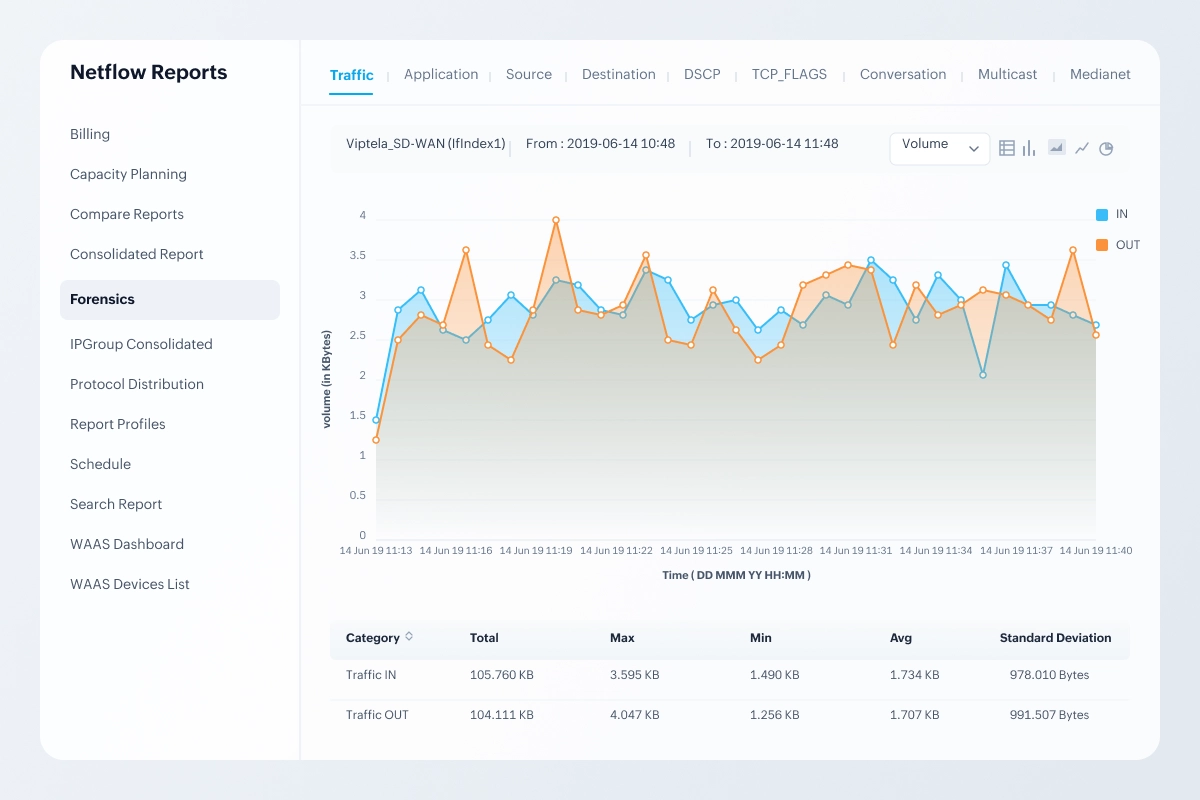
When something unusual happens on the network, the Forensic Reports feature lets your team dig into historical flow data and raw records to trace the sequence of events with precision. Rather than piecing together an incident timeline from scattered logs, your team gets a structured view of exactly what traffic was flowing, between which endpoints, and when. This is particularly useful for post-incident analysis where timeline accuracy matters and where the difference between a clear answer and an educated guess can have real consequences.
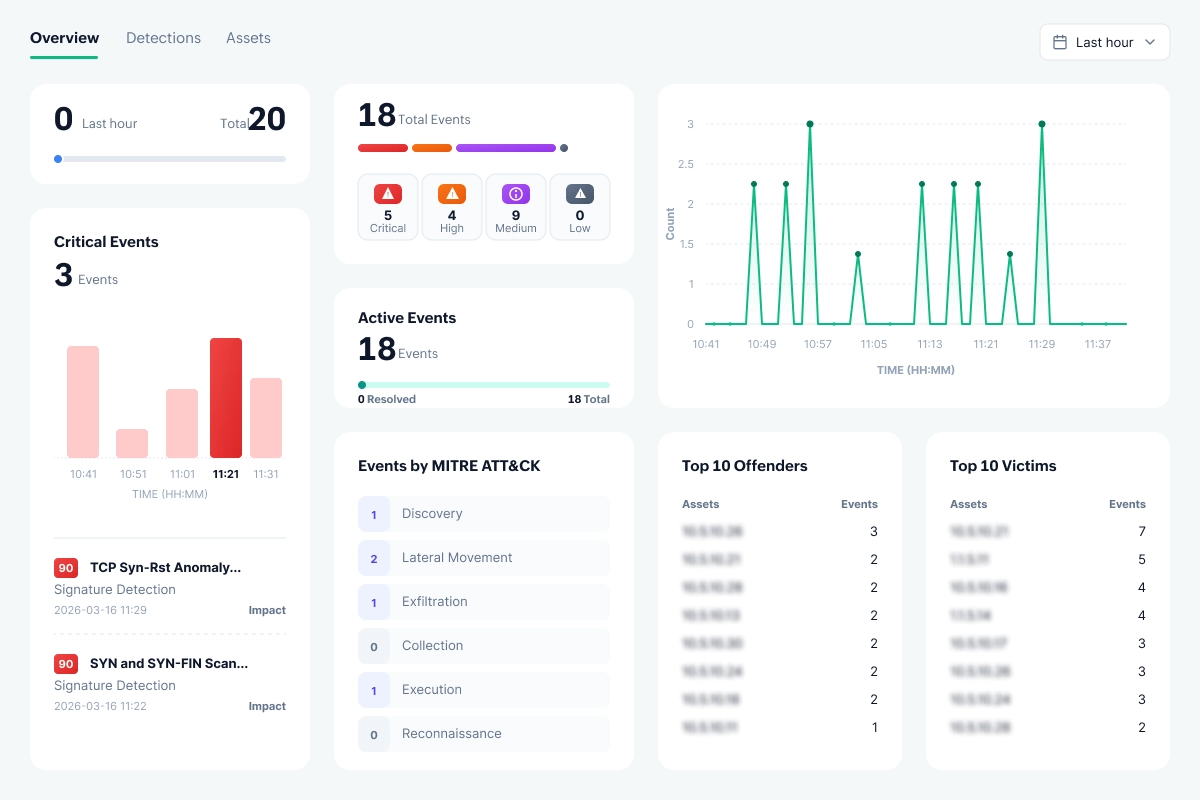
Security monitoring and zero-day detection
The ML-based Security Analytics module watches for behavioral anomalies that fall outside normal traffic baselines, including patterns consistent with zero-day intrusions that signature-based tools would miss entirely. Rather than waiting for a known threat signature to appear, the module flags traffic that simply does not fit the established pattern of your environment and maps it with MITRE ATT&CK tactics and techniques. events are raised in real time, giving your team a meaningful window to respond before an incident has a chance to spread laterally across the network.
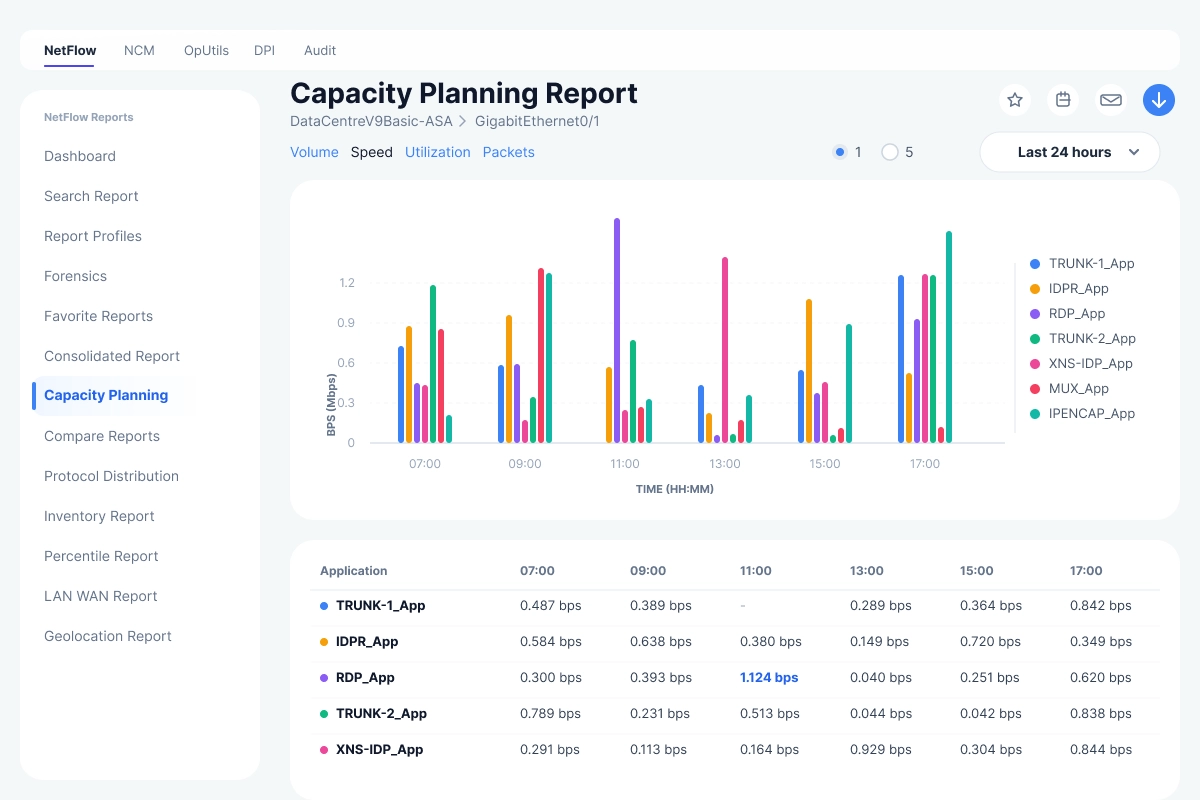
Reporting and capacity planning
NetFlow Analyzer generates reports covering historical usage, current conditions, and projected future demand, supporting both day-to-day troubleshooting and longer-term infrastructure planning. When a link is approaching saturation or a particular application is growing faster than expected, the reporting layer gives you the data needed to make a case for investment before the problem becomes urgent. Departmental billing reports are also available for organizations that chargeback network costs across business units, making it easier to tie infrastructure spending to actual consumption.
Three editions for different scales
NetFlow Analyzer is available in Standard, Professional, and Enterprise editions, each adding capabilities appropriate to the size and complexity of the environment being monitored. Organizations can start with the edition that fits their current footprint and move up as their requirements evolve, without having to migrate to an entirely different platform.
| Edition | Starting price | Interface packs available |
|---|---|---|
| Standard | US$3,438 | 500 — 5,000 interfaces |
| Professional | US$245 | 10 — 1,000 interfaces |
| Enterprise | US$445 | 10 — 5,000 interfaces |
Ready to take control of your network traffic?
Start your free trial today and see exactly what is happening in your network.

Safeguarding your network and data, at once
NetFlow Analyzer ensures to keep your network and data safe with following advanced encryption and authentication standards. Additionally, features like SSL configuration, password protection, and trusted certificates helps secures your network.
NetFlow Analyzer complies with the following data security standards
- GDPR
- FIPS 140-2
- ISO/IEC 27001
Case study
An Italian luxury vehicle manufacturer needed a unified solution to manage its large, complex network, supporting video conferencing and MPLS while preparing for future growth. It sought a tool that integrated seamlessly with its existing system, offering features like agentless monitoring, usability, and cost efficiency. ManageEngine NetFlow Analyzer met all these needs, with a user-friendly interface, advanced monitoring capabilities, and smooth integration, making it the top choice for scalable network management.
Read more
FAQs on network traffic monitoring tools
What is the difference between network monitoring and network traffic analysis?
Network monitoring tracks the availability and health of network devices like routers, switches, and servers. Network traffic analysis goes deeper, examining the actual flows moving through those devices to reveal who is consuming bandwidth, which applications are dominant, and whether any traffic patterns suggest a threat. Most enterprise environments benefit from having both in place.
Does network traffic monitoring tool require dedicated hardware?
No. In practice, most deployments run on standard Windows or Linux servers and collects flow data exported by existing network devices. Dedicated hardware is only necessary for deep packet inspection in very high throughput environments running at 10 Gbps and above, where software-based capture can introduce its own performance constraints.
Which protocols does network traffic monitoring software use?
The most widely used flow protocols are NetFlow v5 and v9 (developed by Cisco), IPFIX (the IETF standard derived from NetFlow v9), sFlow (sampled flow, common in HP, Juniper, and Arista hardware), jFlow (Juniper Networks), and AppFlow (Citrix). Most enterprise monitoring platforms support all five. If your environment spans multiple vendors, confirming full protocol coverage before selecting a tool is worth the extra step.
What is the difference between NetFlow and sFlow?
NetFlow analyzes every packet in a flow and exports a record once the flow ends, producing highly accurate data. sFlow samples one in every N packets, typically one in a thousand, and exports immediately. This puts less load on network devices but captures less detail. NetFlow is generally preferred for security analysis and forensic investigation. sFlow is a better fit for high-speed backbone links where full flow export would strain the exporting device.
How do I monitor network traffic in a hybrid cloud environment?
Hybrid cloud monitoring requires a platform that can collect both on-premises flow exports and cloud VPC flow logs from providers like AWS, Azure, and GCP, then surface everything through a unified interface. Tools that require separate consoles for cloud and on-premises traffic tend to create more operational overhead than they resolve.
Can network traffic monitoring detect security threats?
Yes. Flow-based monitoring is effective at identifying DDoS attacks, data exfiltration, lateral movement between internal systems, and port scanning activity. Platforms with dedicated security modules, like NetFlow Analyzer's Advanced Security Analytics Module, go further by detecting zero-day intrusions through behavioral baselining rather than relying solely on known threat signatures.

By Gladius,
Product marketer, ManageEngine