Accelerate IT performance with an end-to-end network monitoring tool
- Get AI-driven alarms and insights
- Gain visibility into key performance metrics
- Optimize system resource usage
- Automate incident response
What is ManageEngine OpManager?
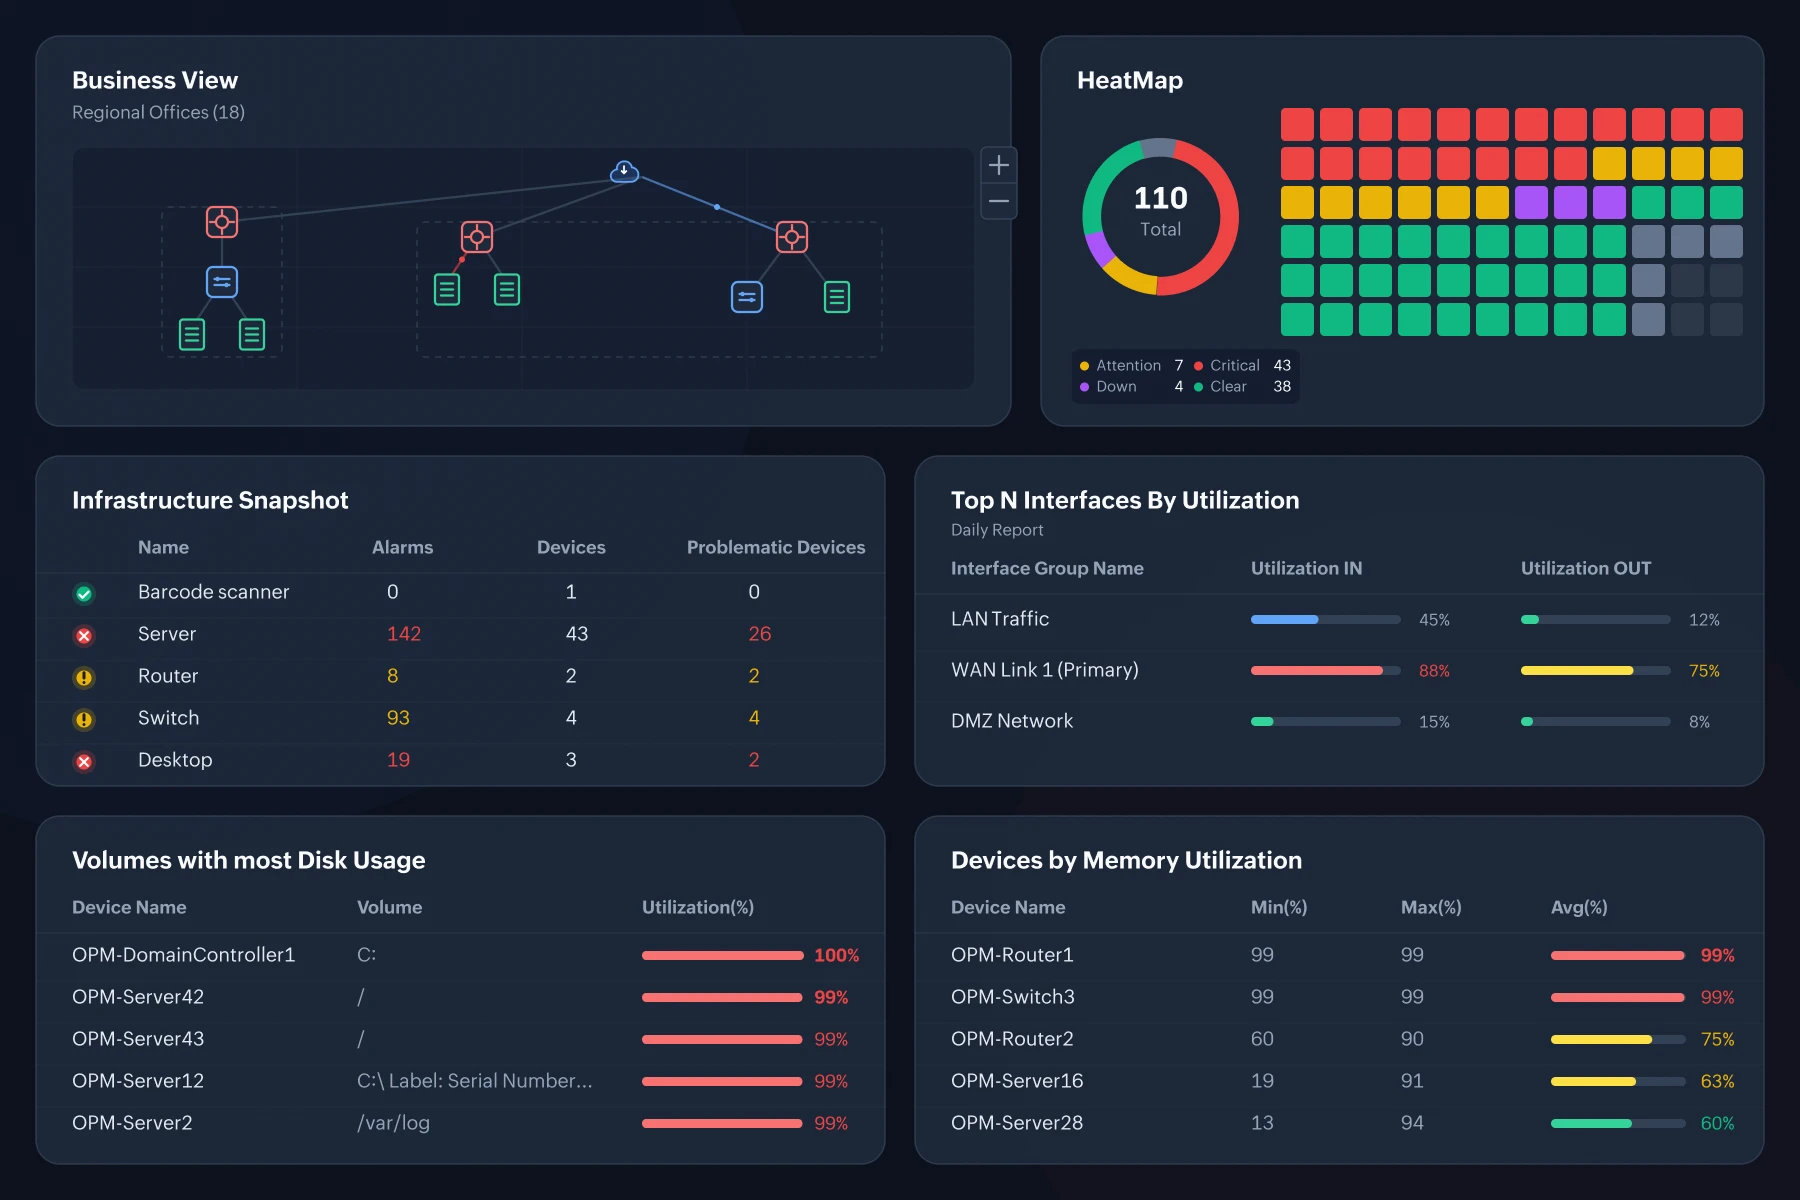
ManageEngine OpManager is a comprehensive network monitoring tool that turns the raw telemetry generated by your infrastructure into intelligent IT insights. Teams can achieve high availability, optimal performance, and complete network visibility with OpManager's real-time alerting, in-depth monitoring, and intuitive reporting features. OpManager also features powerful AIOps and automation features to enable faster root cause analysis and IT incident resolution.
Monitoring capabilities in OpManager
Discover and classify your infrastructure automatically
OpManager uses protocols like SNMP, WMI, Telnet, SSH, vendor APIs or installed agents to discover your IT infrastructure components. If its connected to your IT, OpManager can discover, classify, and monitor it.
- You can schedule regular network discovery scans, AD device sync, or bulk device imports to discover your IT and update changes.
- OpManager fetches your device type, vendor, and model to classify them in a separate tab. It also curates a set of performance monitors for each.
- OpManager has over 11,000+ device templates supporting a diverse set of vendors. This ensures out-of-the-box support for any devices you might have.
Detect and fix IT issues with proactive alarms
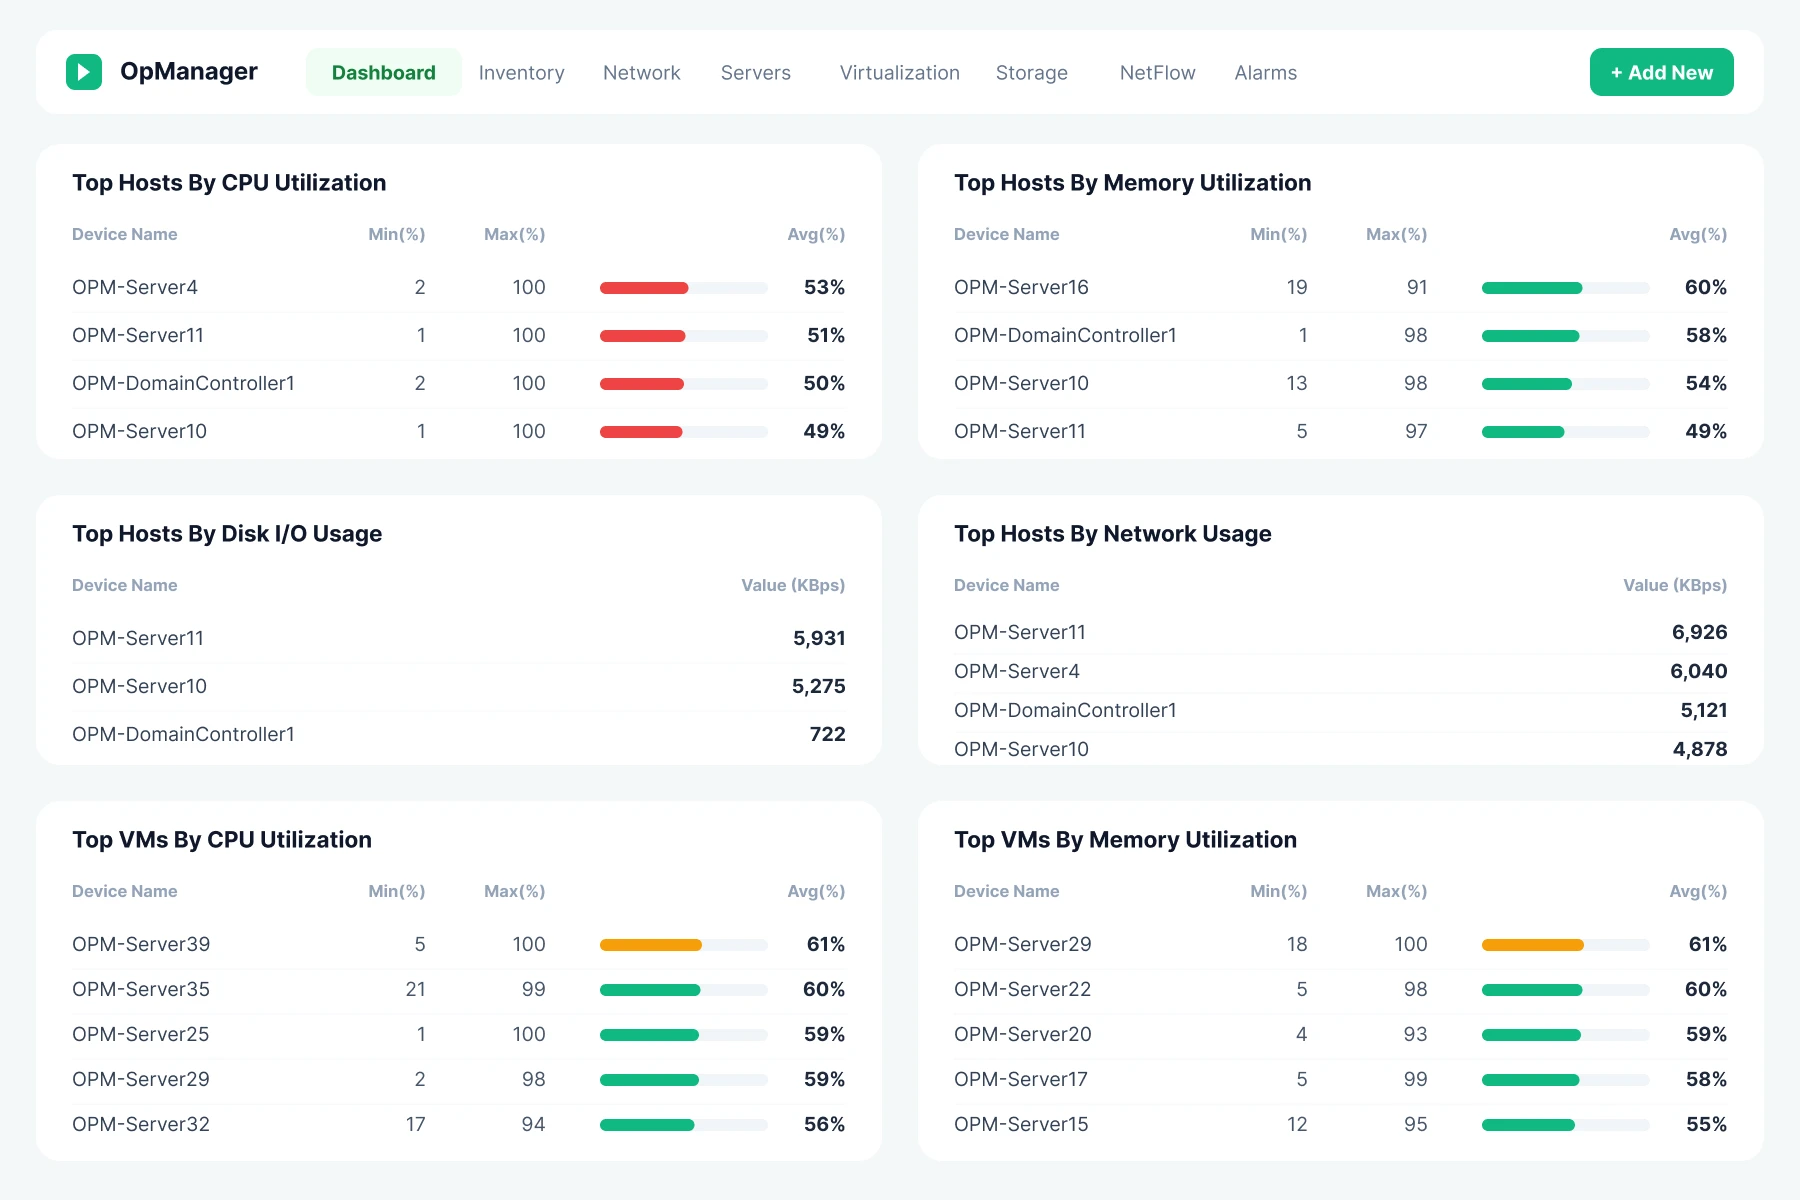
OpManager monitors the uptime, health, and performance of your IT infrastructure and generates context-rich colour-coded alarms.
- Adaptive thresholds in OpManager use machine learning to calculate, set, and update alarm thresholds automatically, ensuring that you only get alerted for real issues.
- OpManager's smart event correlation ensures that related alarms are grouped together into actionable problems, reducing alarm floods. Alarm escalation rules forward unacknowledged alarms up your chain of command.
- Get notified for critical devices and alarms via mail, SMS, push notifications, webhooks, and APIs. OpManager can also send notifications via third party tools like Slack and Teams.
Enhance IT operations with AI-driven insights
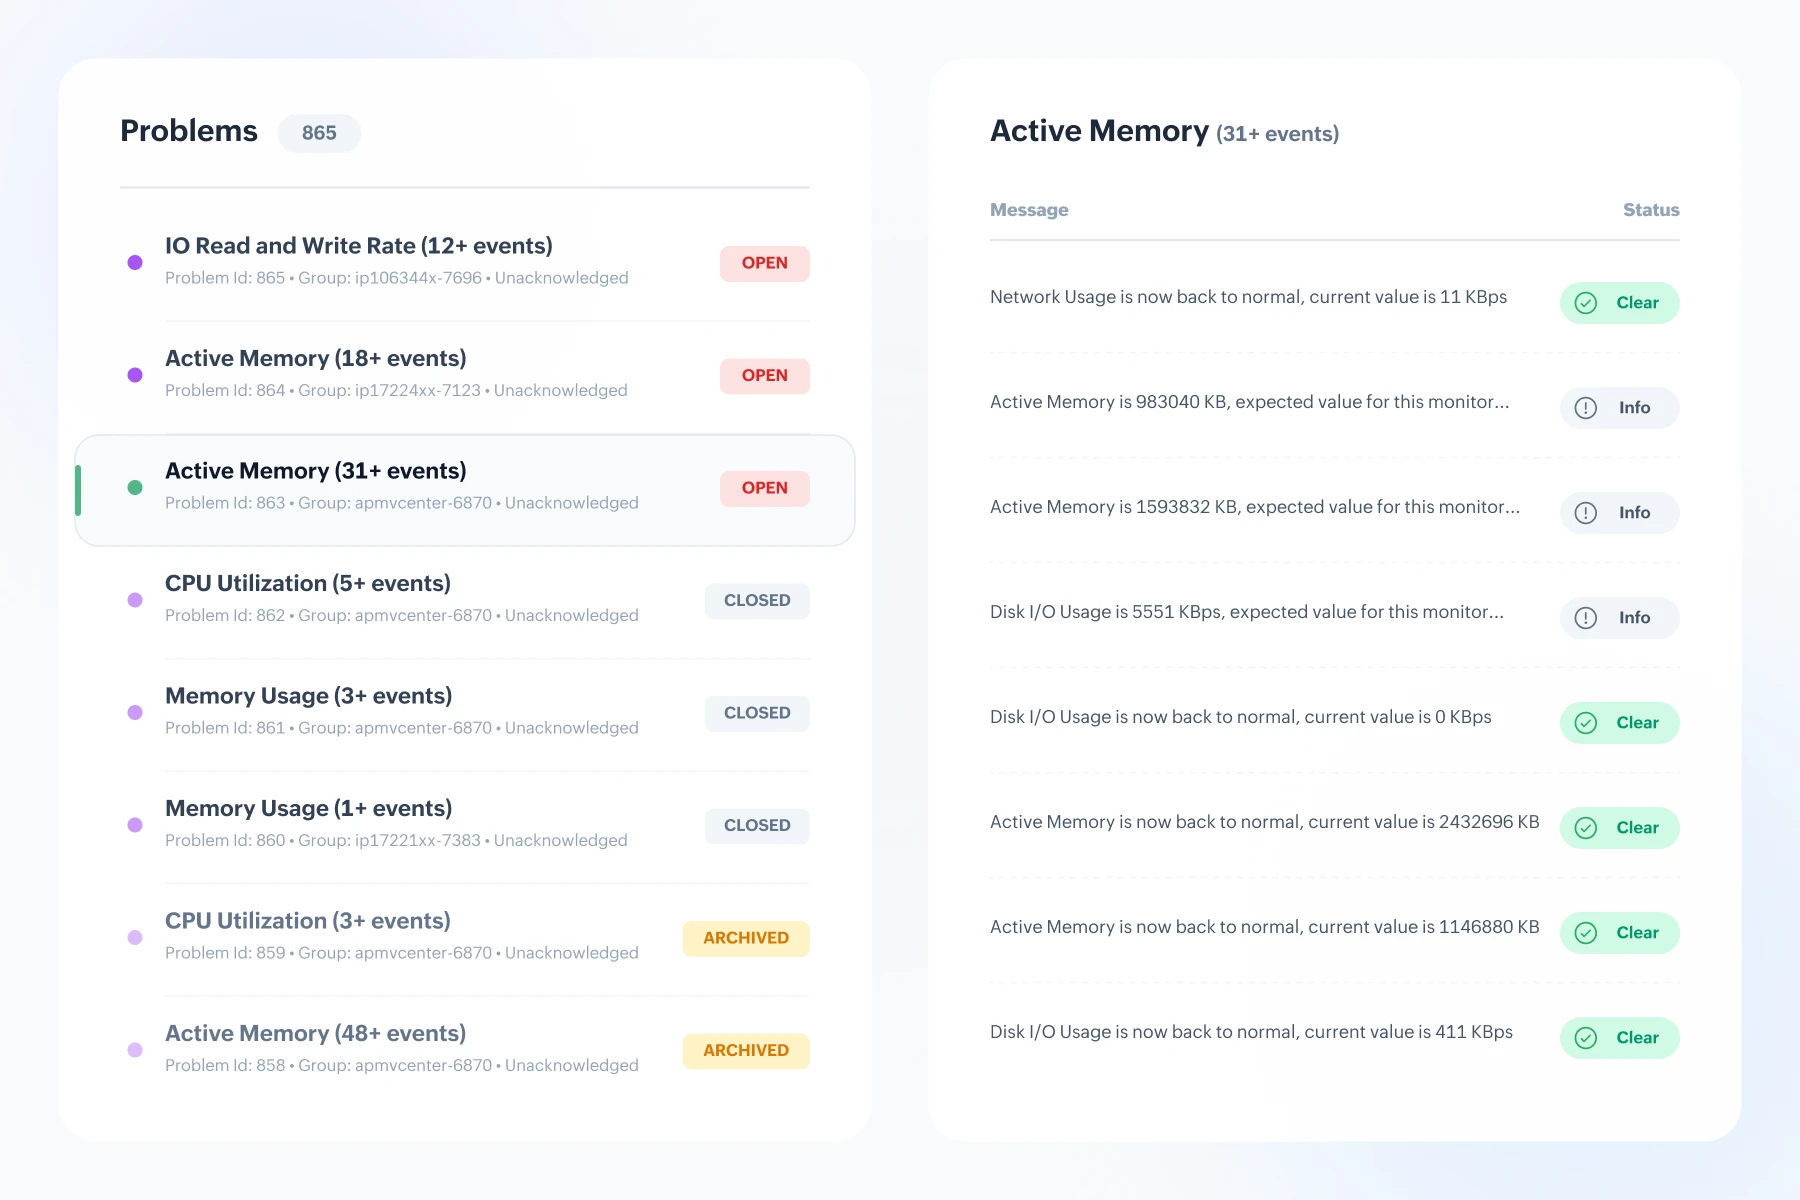
OpManager is an AI-driven network monitoring tool with flexible and powerful AIOps features. You can leverage OpManager's AI in three ways:
- Zoho's (ManageEngine's parent company) Zia AI is built into OpManager. Zia can provide you with resource usage forecasts and suggestions, performance metric insights, and on-demand IT analytics.
- OpManager integrates with GenAI LLMs. You can connect with providers like OpenAI and DeepSeek to get real-time insights. You can also integrate with Ollama's local LLMs for secure, air-gapped AIOps.
- OpManager also supports a native MCP server. You can connect it with AI assistants and LLMs to query and process monitoring data.
Visualize IT infrastructure with network mapping
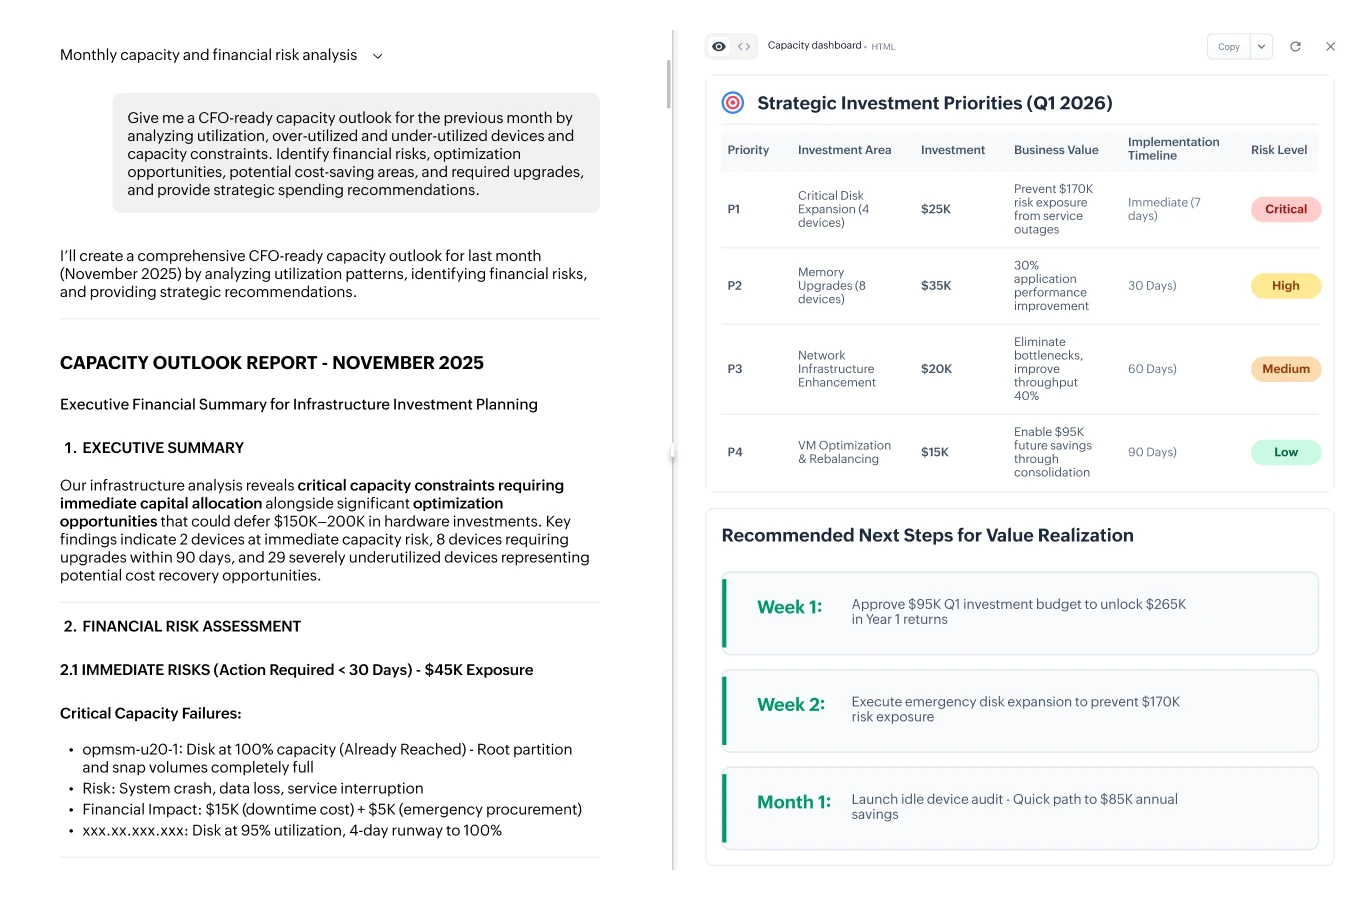
OpManager updates network and infrastructure maps on a regular basis and highlights faulty or breaking components with colour-coded alarms.
- Organization maps track everything: from switch-ports to servers and VMs. With the Applications Manager plugin, you can bring in app and databases stacks into this view as well.
- OpManager visualizes each layer of your network with dedicated maps. Layer 2 maps for LAN topology, network path analysis for layer 3 & WAN, virtual mapping for virtual networks.
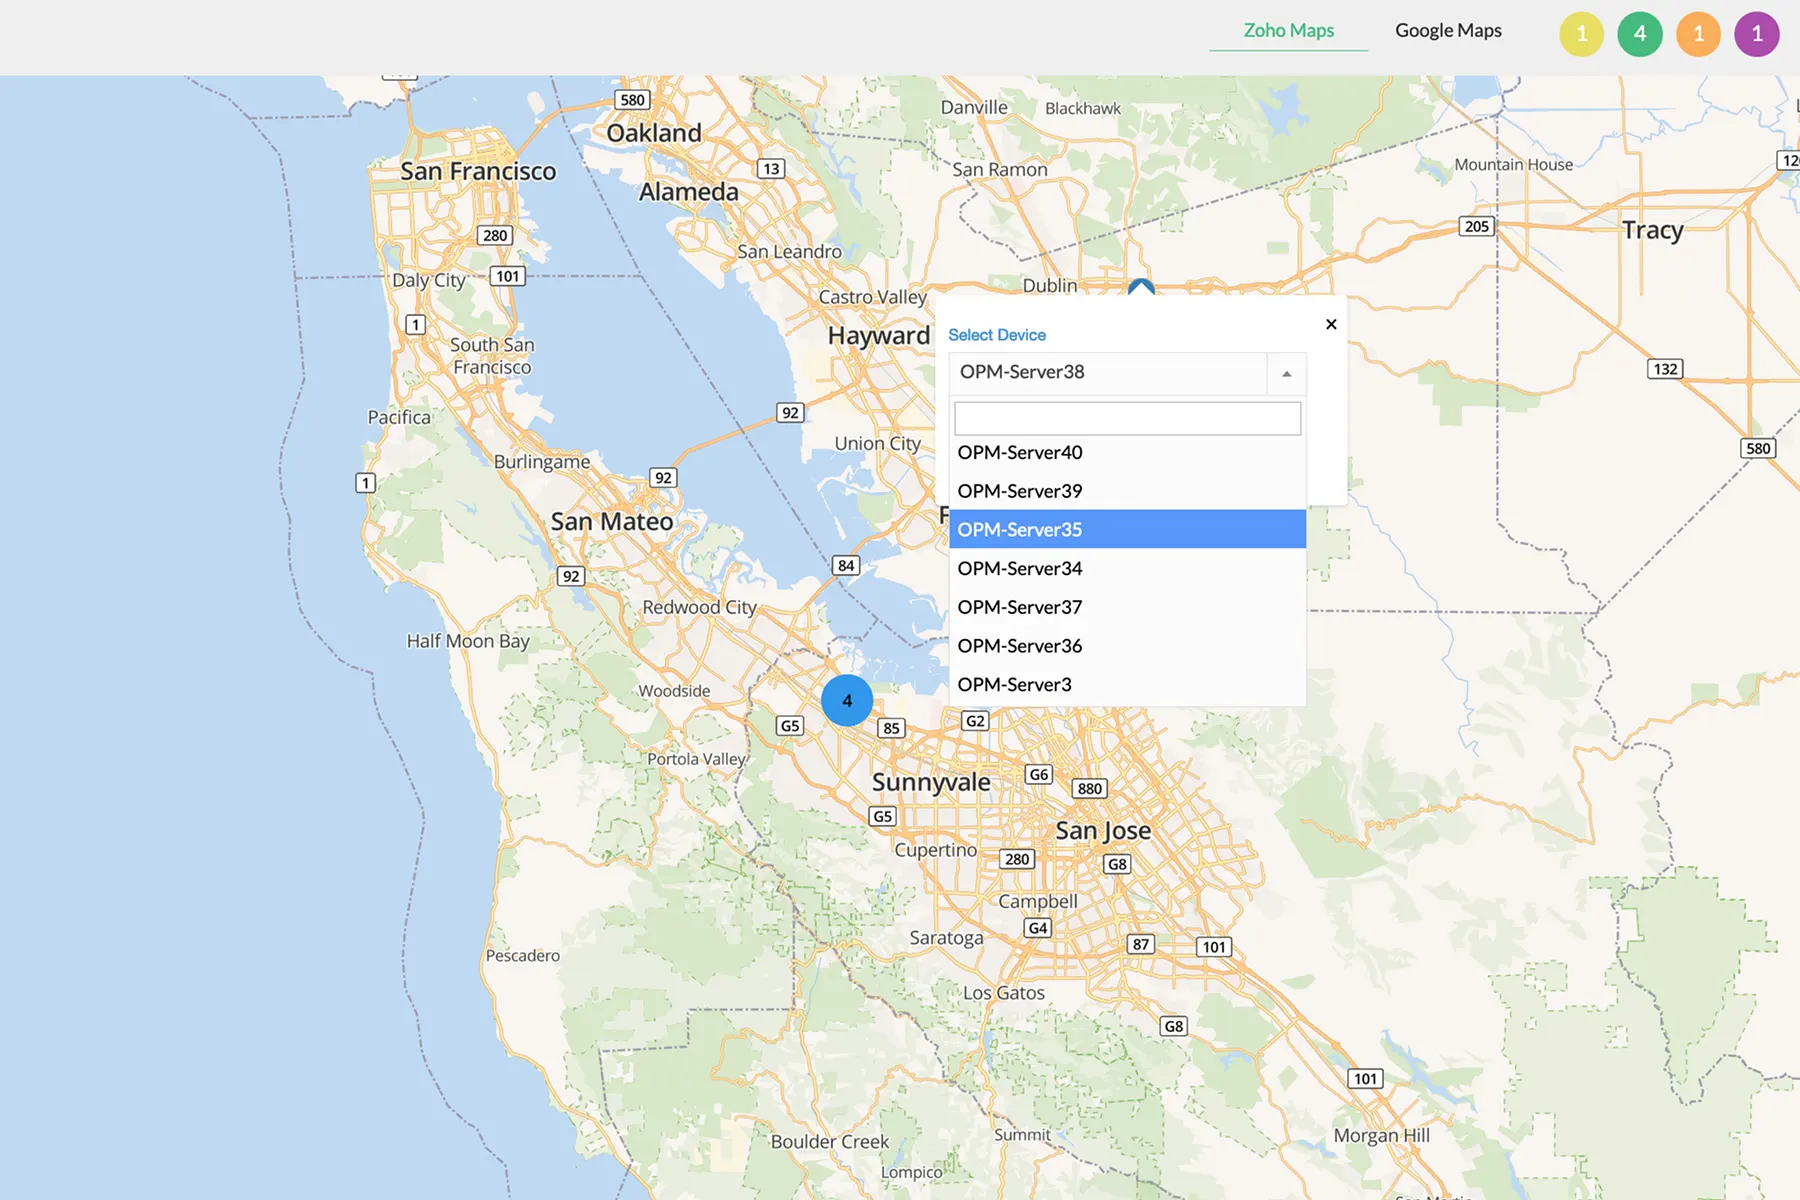
- You can also create custom maps. This includes business views, 2D/3D simulations of datacenters, and distributed/hybrid networks in Google/Zoho maps.
Analyze IT performance with dashboards and reports
OpManager offers dedicated dashboards and reports for different parts of your IT infrastructure. You can schedule regular exports to keep all stakeholders updated.
- Use role-based access control to set clear boundaries for your teams. Demarcate dashboards and reports to your tool operators at the device and module level.
- Create custom dashboards and reports by mixing and matching metrics from monitored devices.
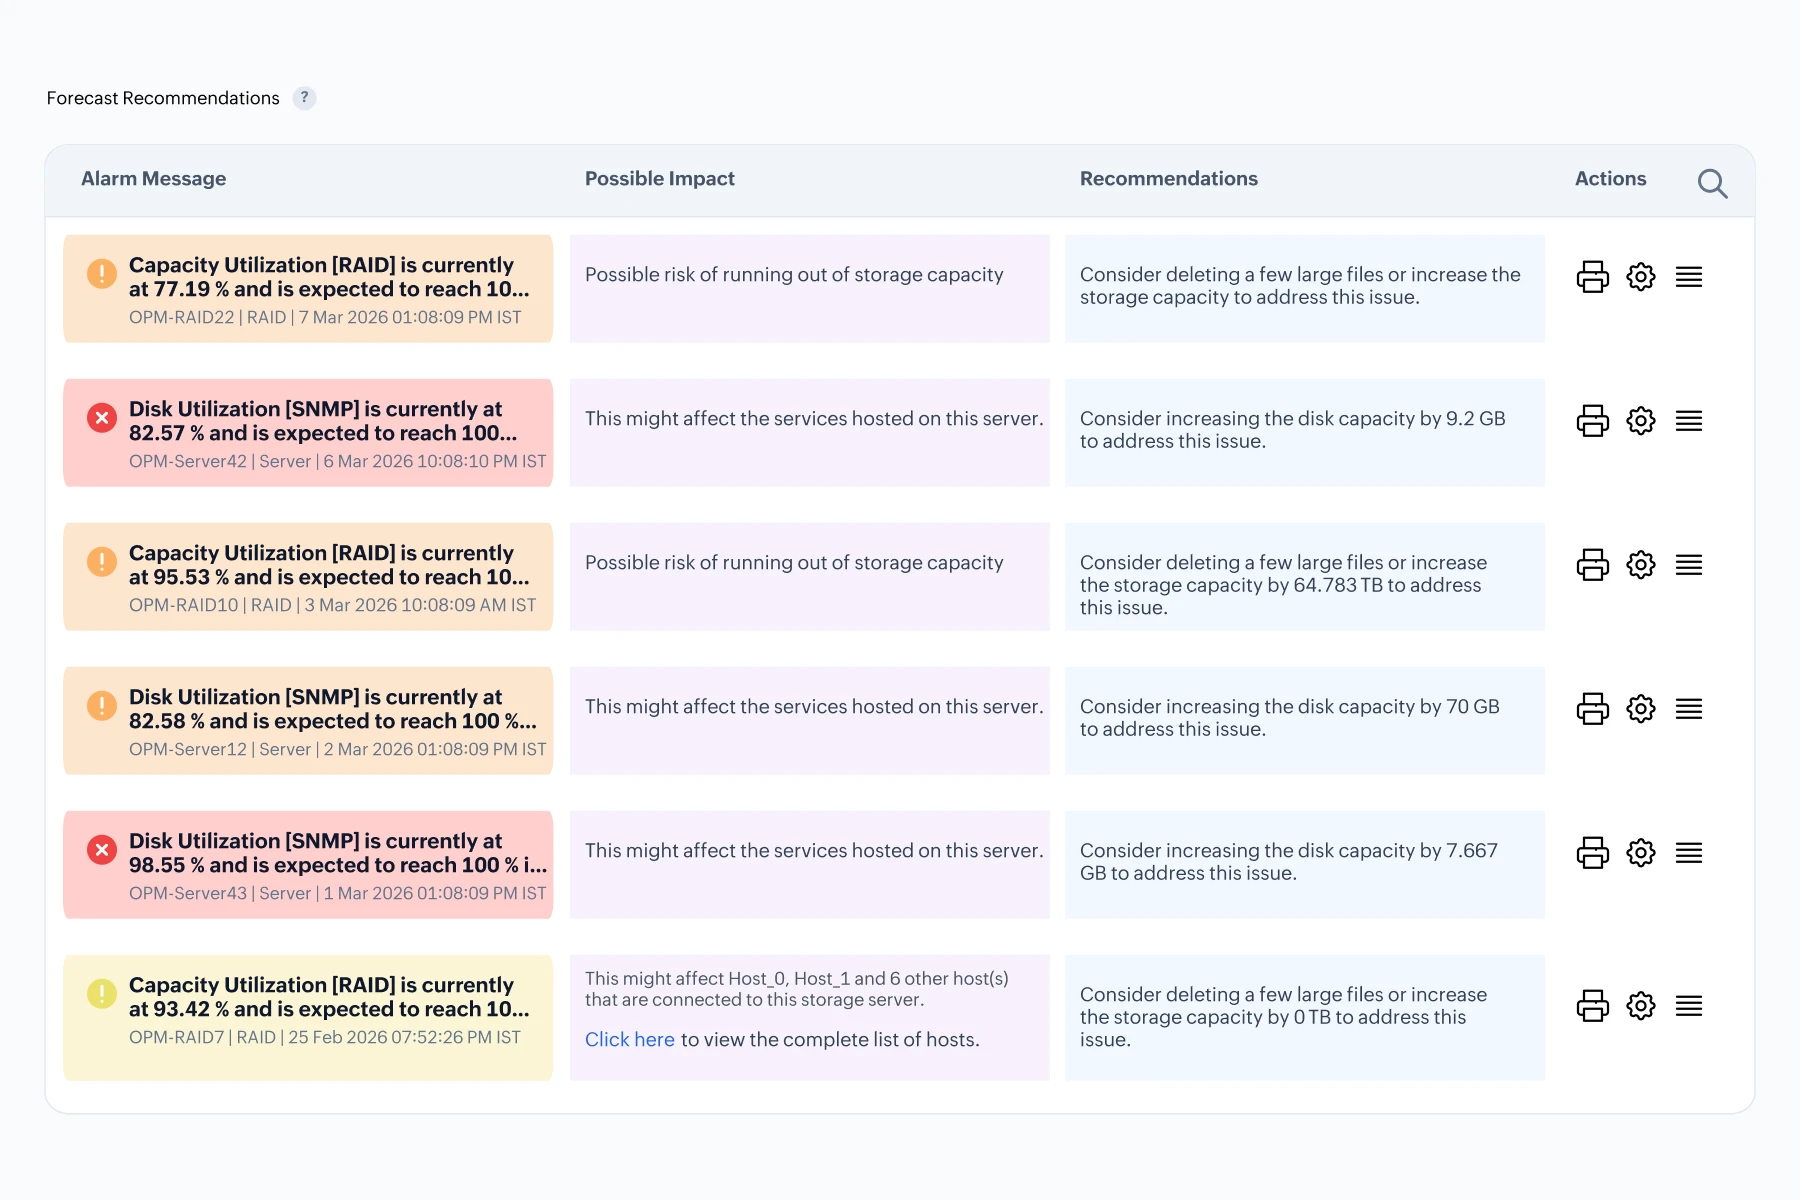
- Incorporate Zia's forecasts into your dashboards and reports. Get clear insights on when your system resources are running out and what to do as remediation.
Automate incident management and response
OpManager does more than just generate alarms. It can also speed up incident response by ensuring that the alarms reach the right teams and trigger the right action.
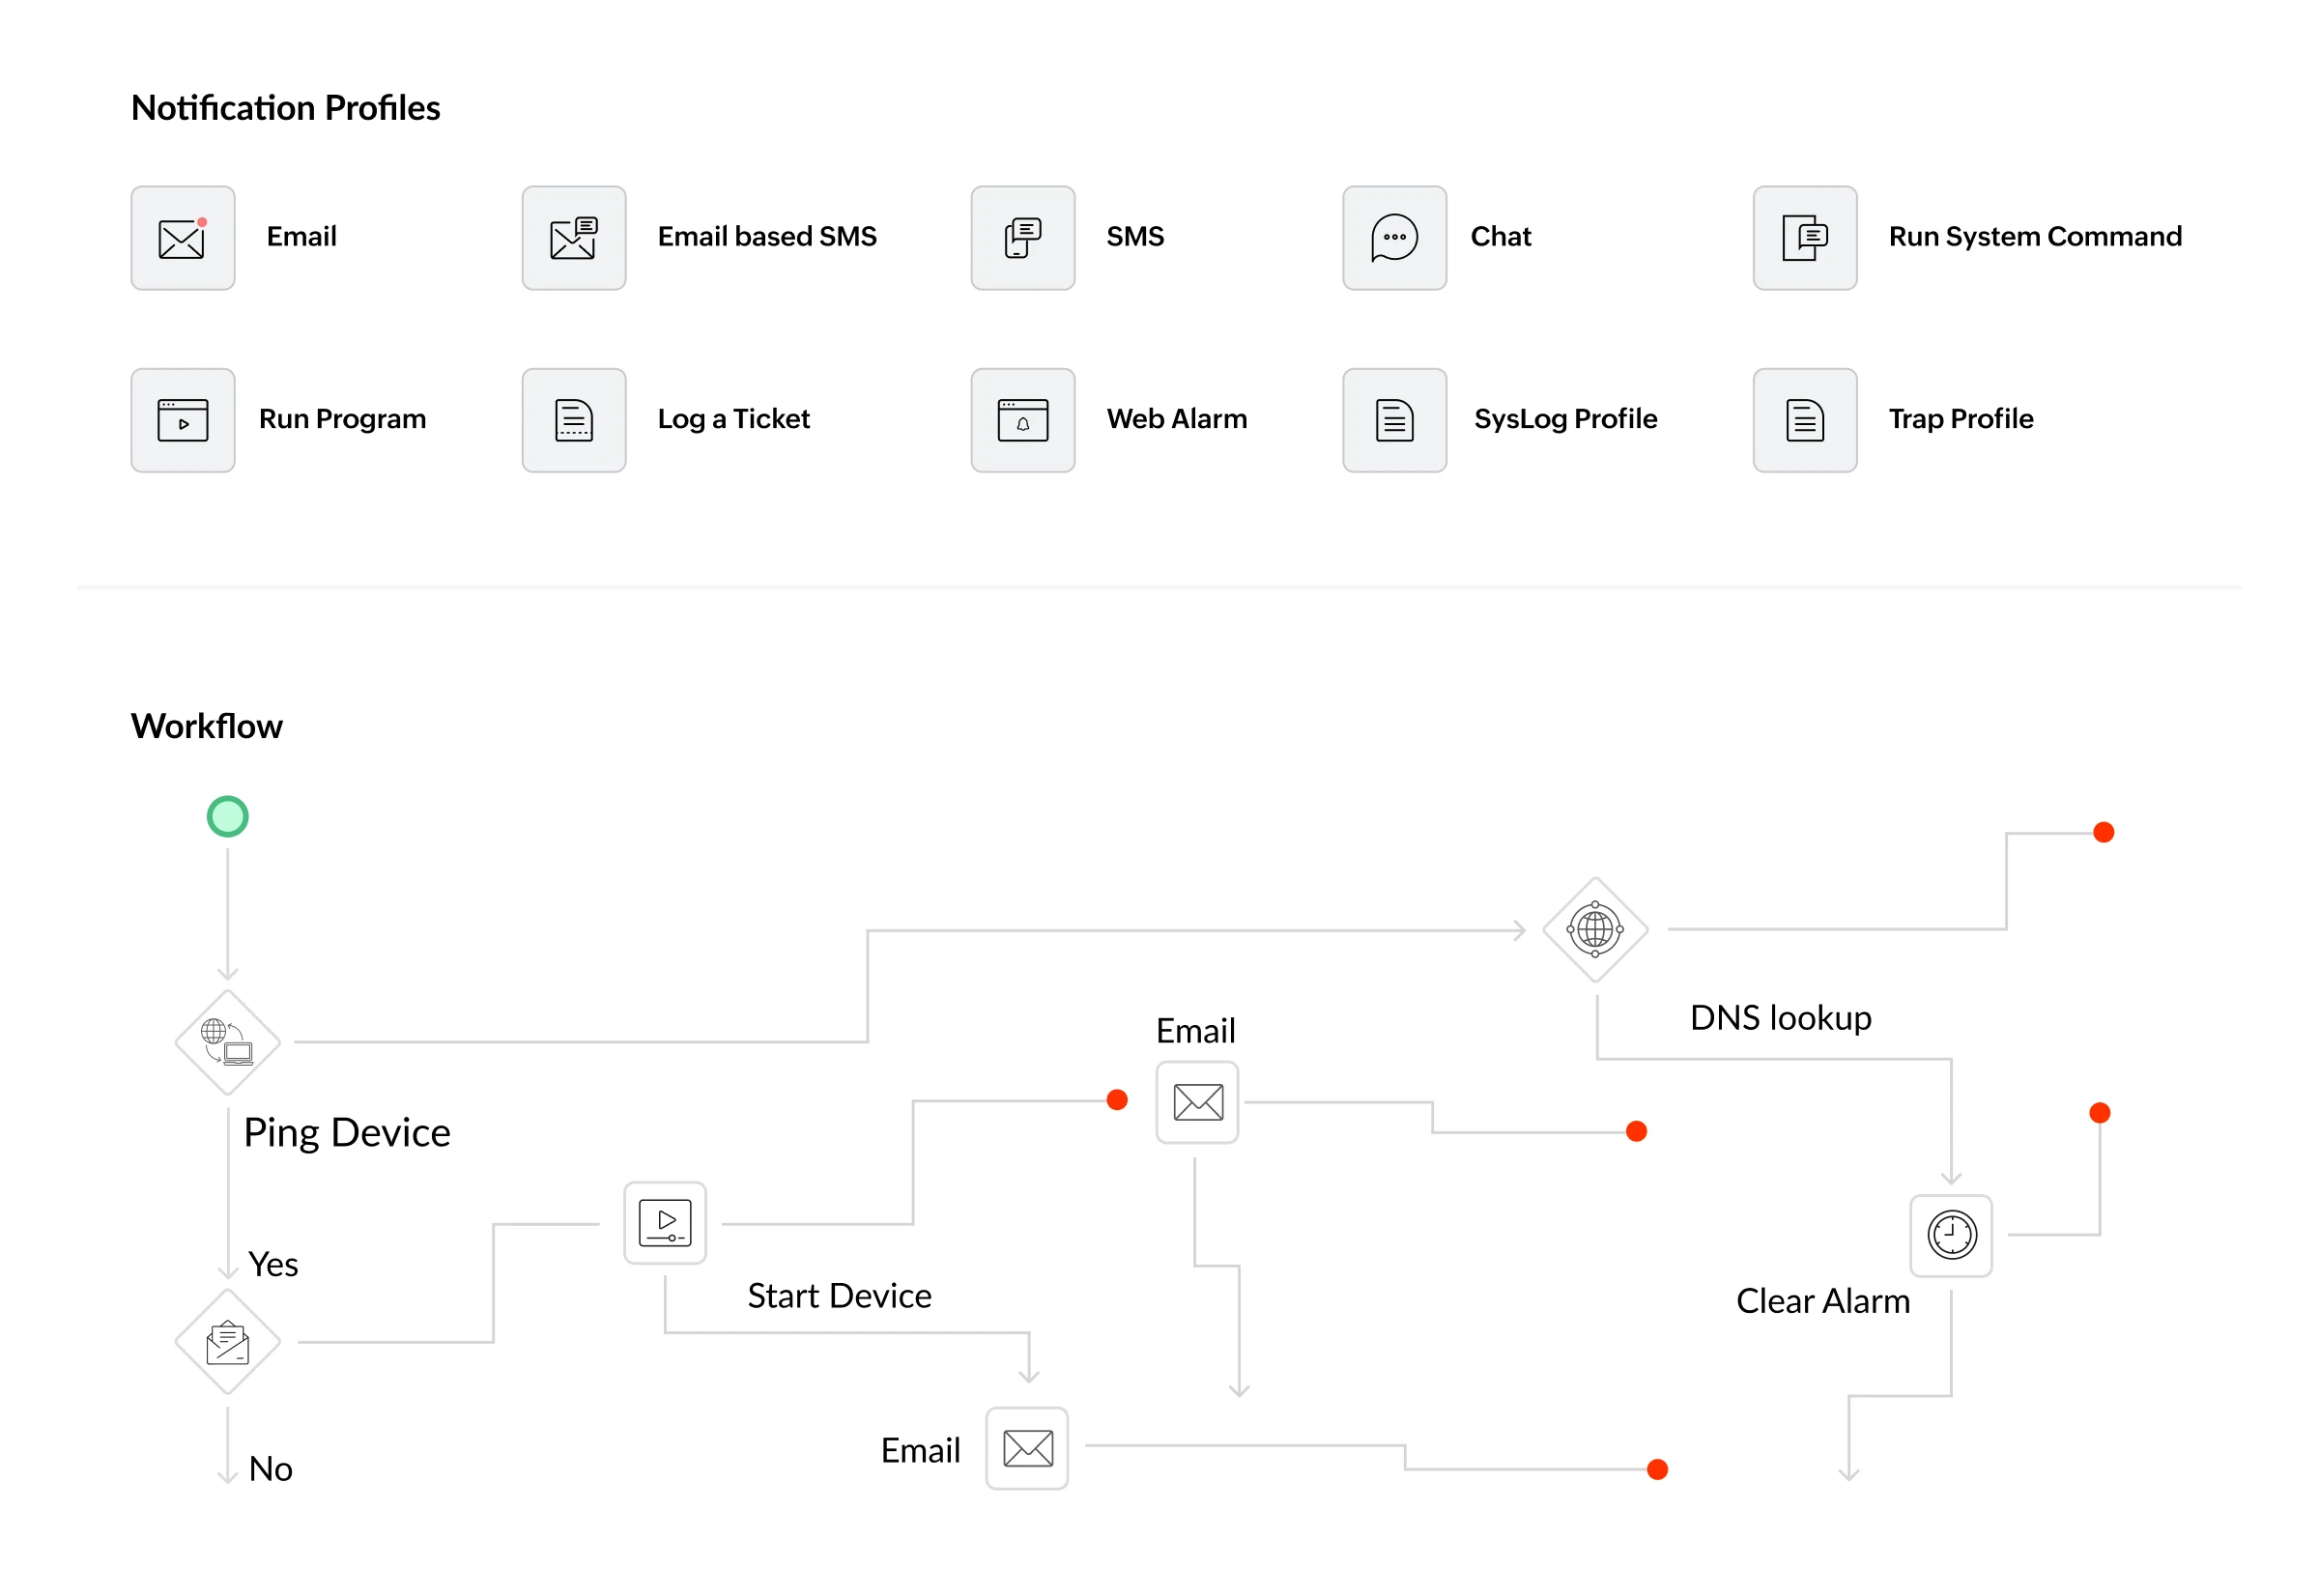
- OpManager integrates with helpdesk tools like ServiceDesk Plus, Servicenow, Jira, and Freshdesk. You can raise alarms as ticket automatically. Assigning IT issues to the right teams instantly.
- Create code-free workflows with 70+ sequential actions. These workflows can be triggered by alarms or on a schedule. This allows you to execute instantly troubleshooting actions when faults occur.
- OpManager also integrated with Ansible, helping you execute playbooks in response to alarms.
Comprehensive network monitoring tool
OpManager gives you complete visibility into anything connected to your network. Your team can monitor, troubleshoot, and optimize IT systems without jumping between tools. This reduces tool sprawl, drives down IT costs, and speeds up MTTD and MTTR.
Network devices
Routers, switches, firewalls, WLCs, access points, Cisco Meraki, & printers,
Servers & workstations
MSSQL, domain controllers, exchange servers, & app servers.
Virtualization & storage
VMware, Hyper-V, Nutanix, Xen, Proxmox, VxRail, RAIDs, tape libraries, and SAN switches.
WAN infrastructure
WAN IPs, network paths, SD-WAN, & WAN accelerators.
Network monitoring tool for every infrastructure component
Network
- Interfaces
- VLANs
- VPN
- HCI
- SDN
Compute
- Hardware & IPMI
- CPU & GPU
- Processes
- Services
- Files/folders/logs
Storage
- Capacity
- Volumes & storage pools
- LUNs
- Disks
Use cases for network monitoring tools: How OpManager helps

Continuous uptime for healthcare and education teams
IT teams in the healthcare and education sectors run high-stakes operations with no room for downtime. OpManager helps ensure 99.999 uptime by enabling proactive monitoring and response.
- OpManager detects the symptoms of potential IT breakages and delivers them through email, SMS, push notifications, as well as helpdesk tools and chat apps.
- OpManager's automated workflows speed up incident response by automating troubleshooting and remediation.
- Ensure compliance with privacy standards like HIPAA with OpManager's Network Configuration Manager add-on.

Secure visibility and control for BFSI and public sector IT
Teams in the finance and public sectors have traditionally been locked out from modern technologies due to privacy regulations. They run air-gapped operations with stringent safety standards. OpManager delivers in-depth monitoring and insights without compromising on privacy or safety.
- OpManager is compliant with privacy and security standards like GDPR and FIPS-140-3.
- OpManager's Ollama integration allows IT teams to access advanced AI LLMs from air-gapped networks.
- As OpManager is hosted on-premises, IT teams can monitor their critical infrastructure without shipping sensitive data outside their networks.
Optimized IT operations for engineering and IT industries
Engineering and IT sector teams manage microservices architectures that are usually spread across hybrid environments. These networks generate a lot of telemetry from a variety of sources.
- Zia prevents alarm storms, delivering context-rich, insightful updates about your IT infrastructure.
- OpManager's MCP server enables teams to correlate metrics with DevOps, version control, CI/CD pipelines, helpdesk tools. This helps them manage complex IT systems and tool stacks from a single console.
- OpManager's add-ons and plugins help engineering teams achieve full-stack observability. This helps them monitor, test, and optimize the entire IT stack from a single console.
Scalable, real-time monitoring for retail and logistics teams
IT teams in retail and logistics industries need to manage critical end-points in real-time, often from different sites. OpManager provides scalability and real-time visibility without compromising on performance or driving up costs.
- Manage distributed locations from a single console with OpManager's enterprise edition. This probe-central model can handle up to 50,000 devices spread across the world.
- Set up gNMI, syslogs, and 30-second uptime checks for critical endpoints. This lets your IT team detect and fix issues in real-time before they delay your operations.
- OpManager's Lite device license and remote poller help you monitor remote sites, shops, and transport vehicles at a low overhead and cost.
FAQs about network monitoring tools
Resources to dig deeper
The technical playbook for deploying agentic AI in production ITOps
From alerts to action: How agentic AI will change your ITOps
Download whitepaper →Extend OpManager's capabilities
Unlock more capabilities for your network monitoring tool with in-built add-ons and plugins
Bandwidth monitoring
Flow-based traffic analysis to see who and what is driving every byte across the network.
Try free trial →Application monitoring
Application performance and user experience monitoring to achieve full-stack observability.
Try free trial →Network configuration
Back up configs, detect drift, and push standardized changes across thousands of devices.
Try free trial →