Commonly available operations for apps
- To add a license to an app
- To add an invoice to an app
- To update or renew a license for an app
- To update the owner of an app
- To delete an app
- Enabling Report Settings
- Adding compliance documents
- To disable license sync
- To view AI usage
Adding a license to an app
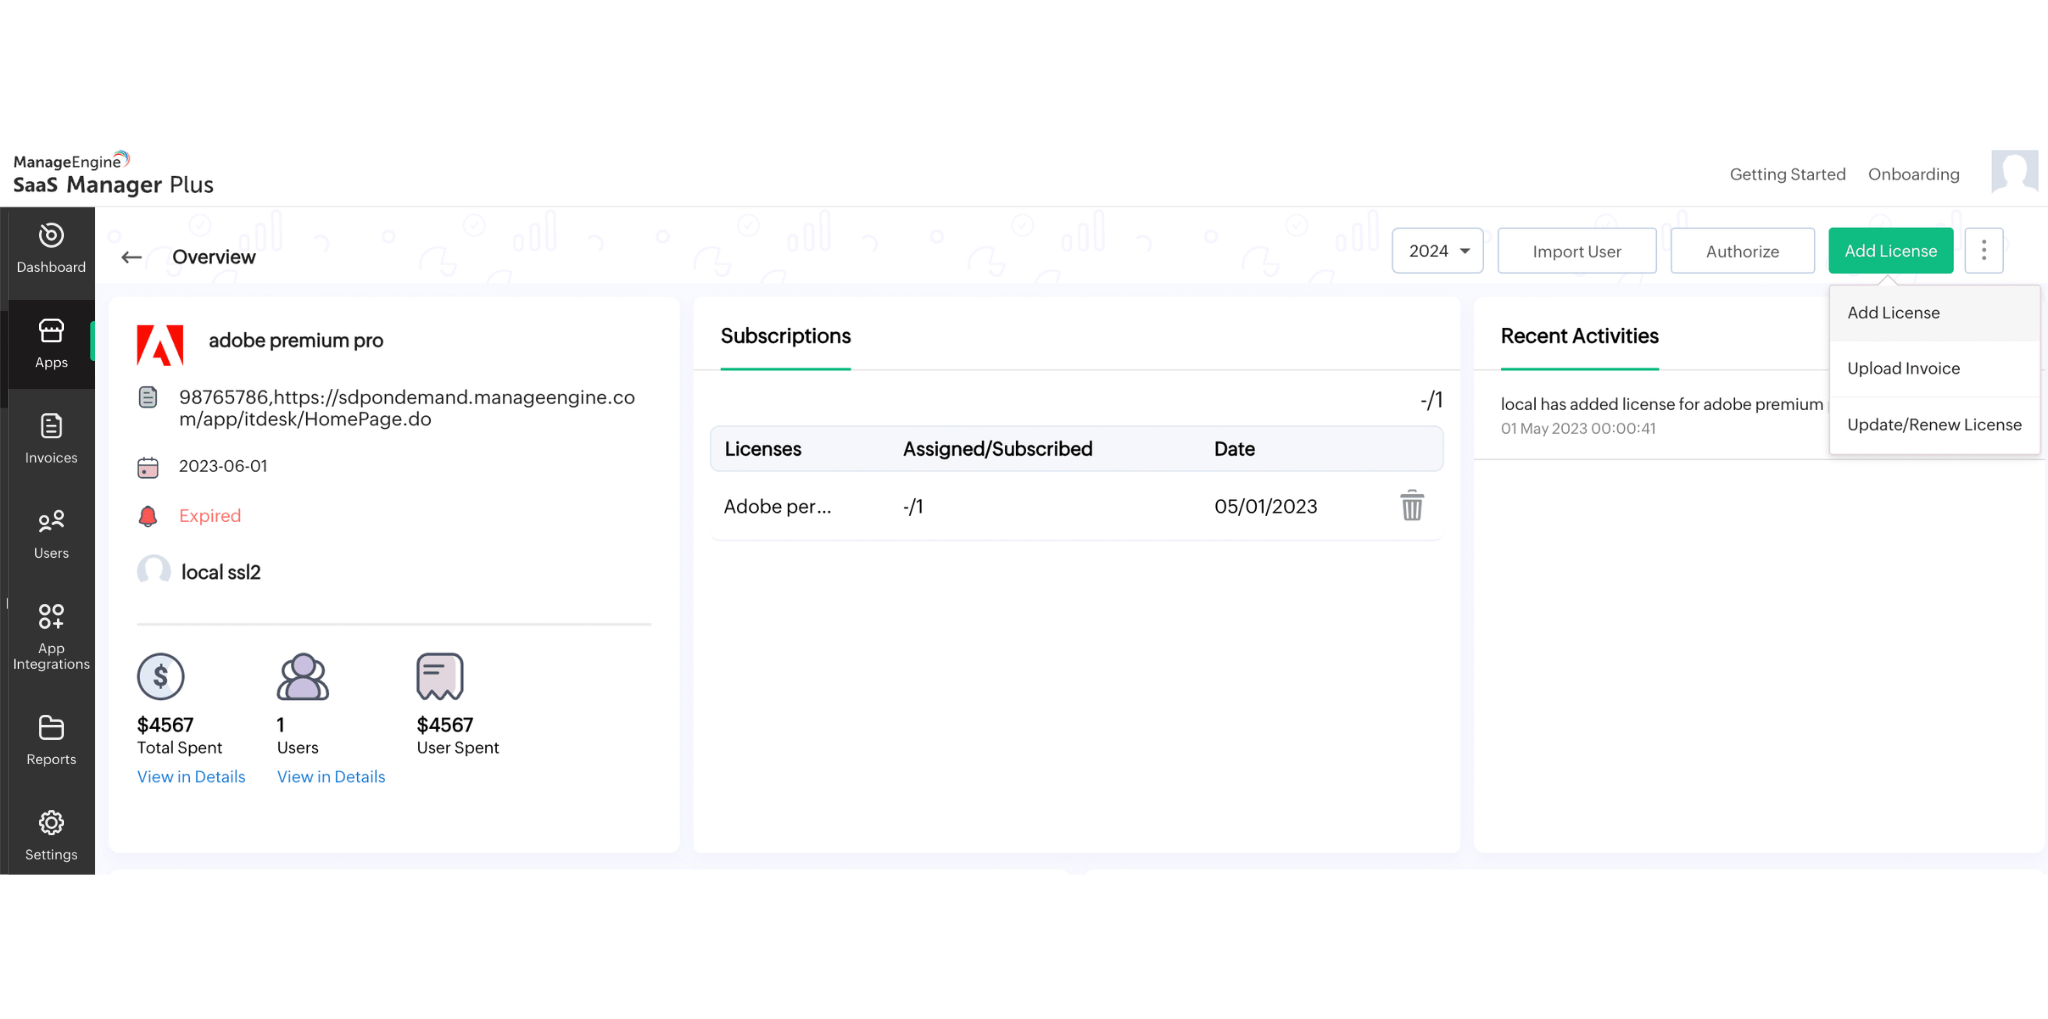
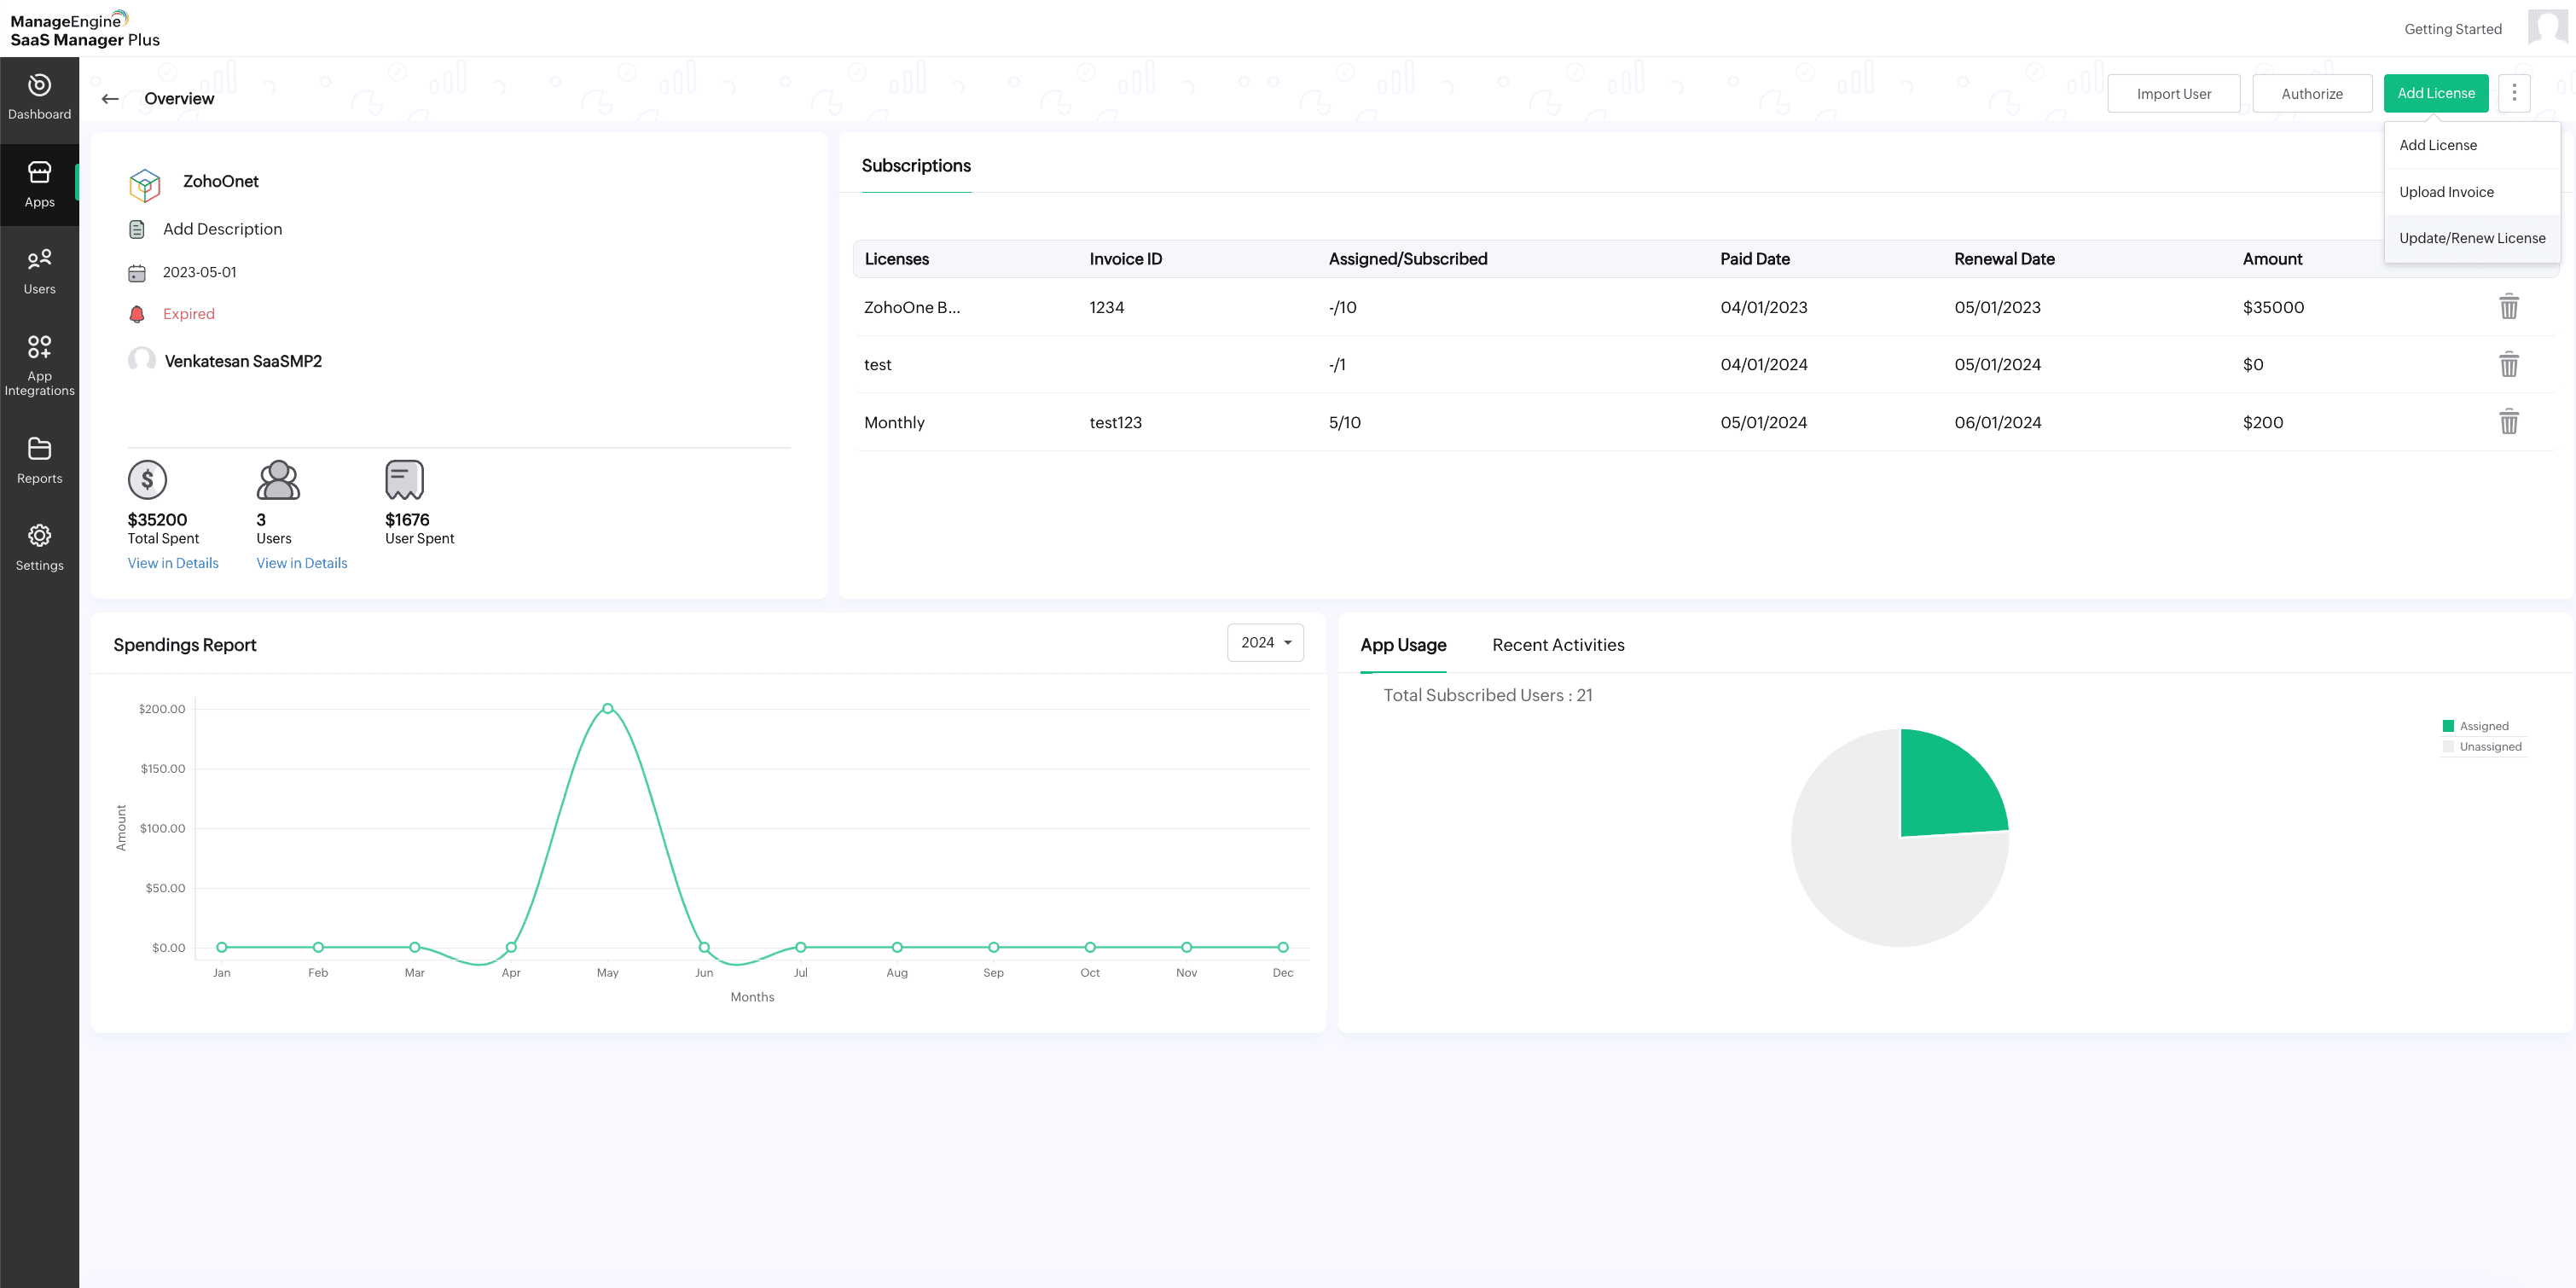
- Select the app from the list.
- Click Add button in the top-right corner and click Add License from the drop-down list.
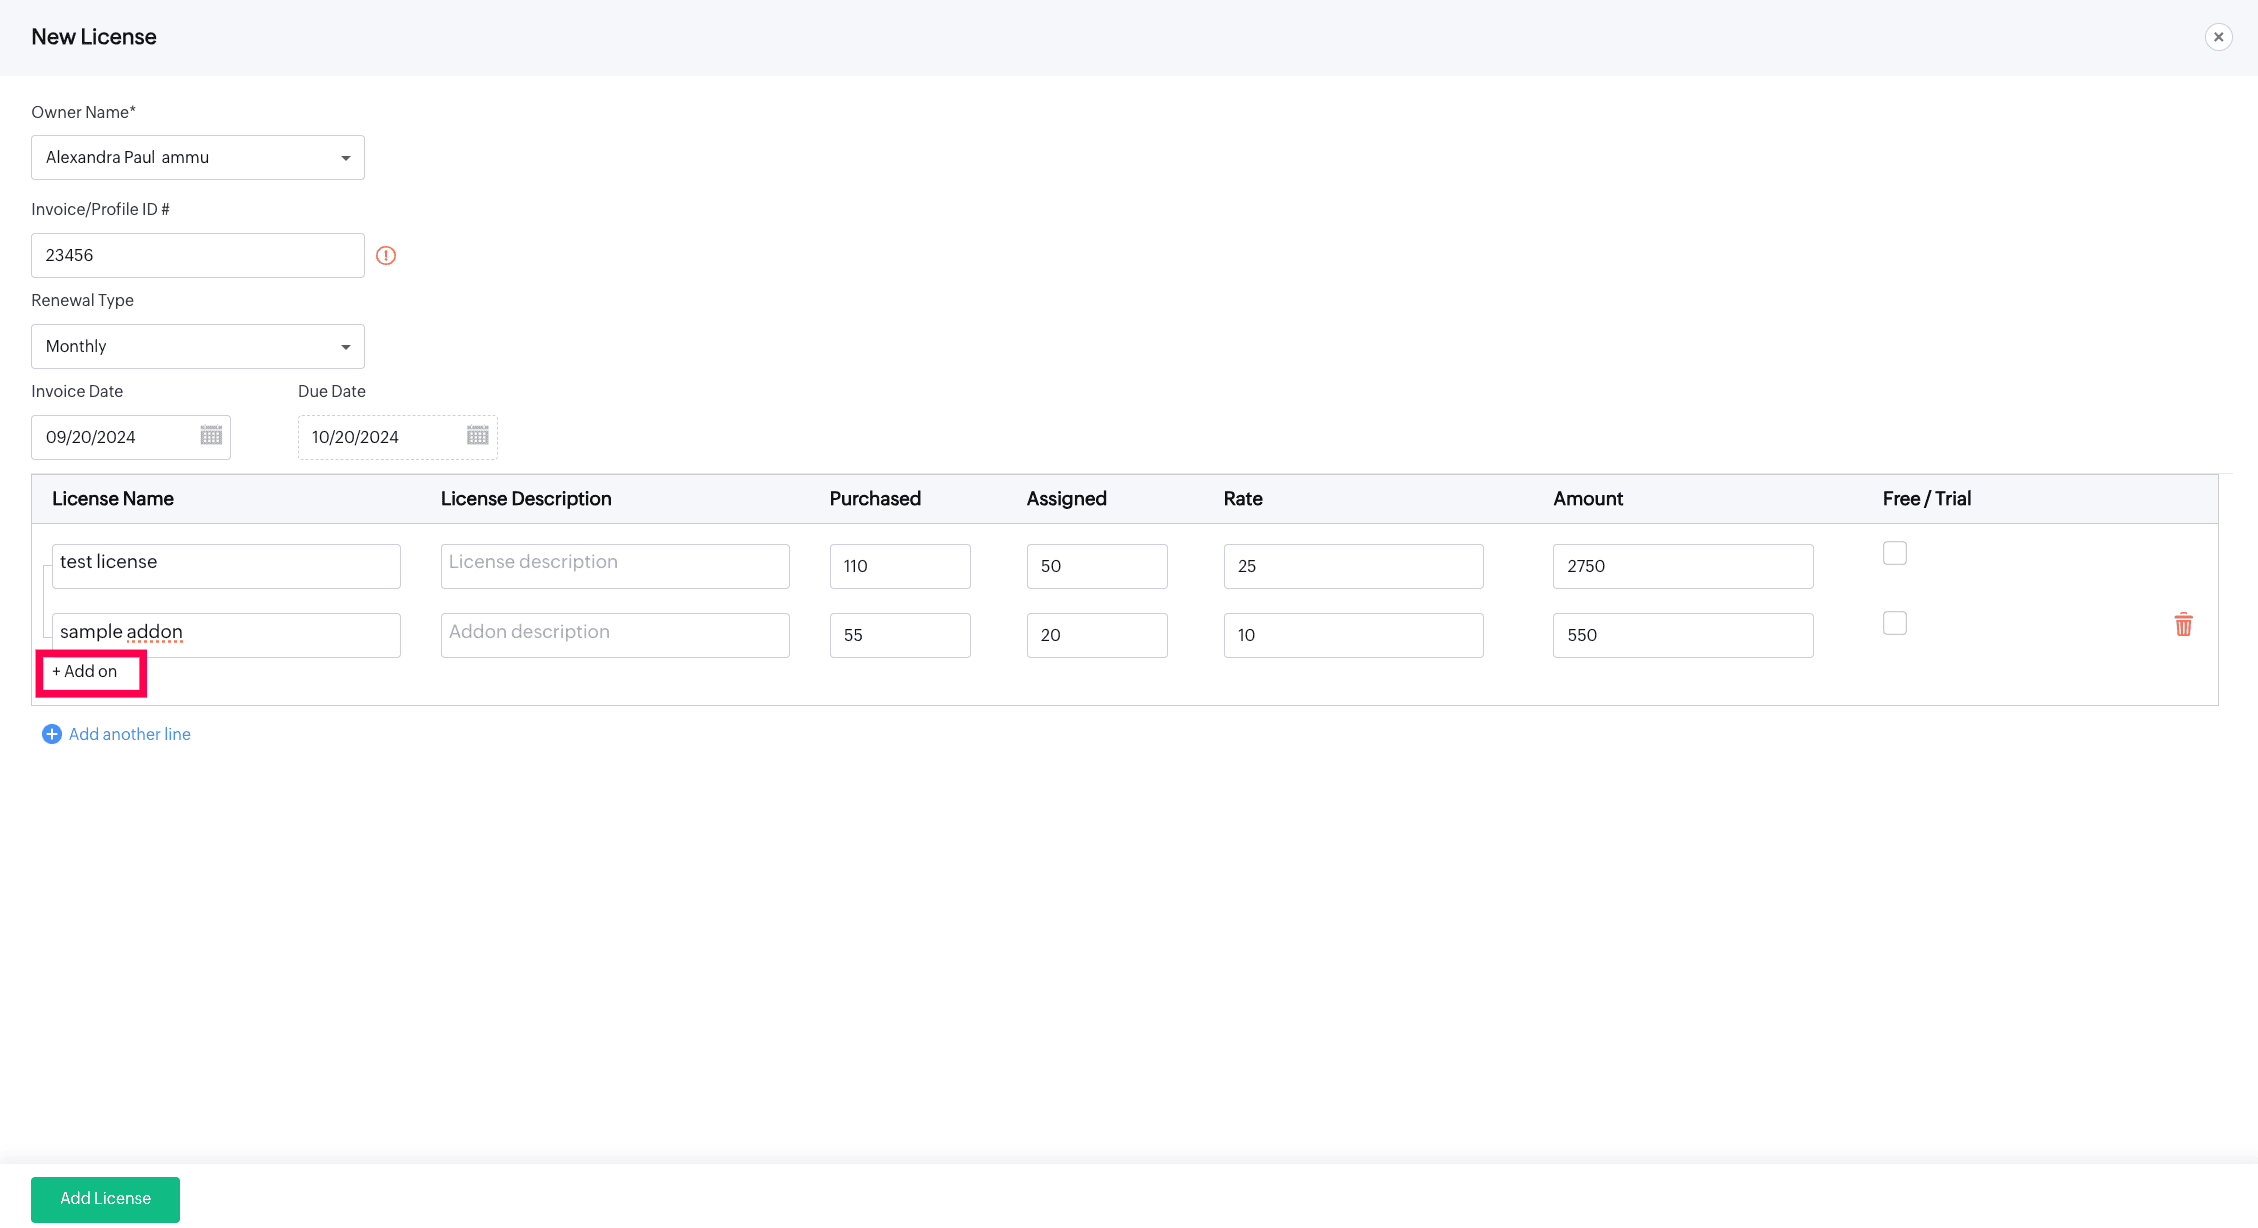
- In the new window, enter the required details for the new license, such as Owner Name, Invoice/Profile ID, Renewal Type, Invoice Date, Due Date, License Name, Description, Purchased, Assigned, Rate, Amount, Add on(to include add-ons to the new/existing license), and Free/Trial.
- Click Add Another Line to add more license details, if required.
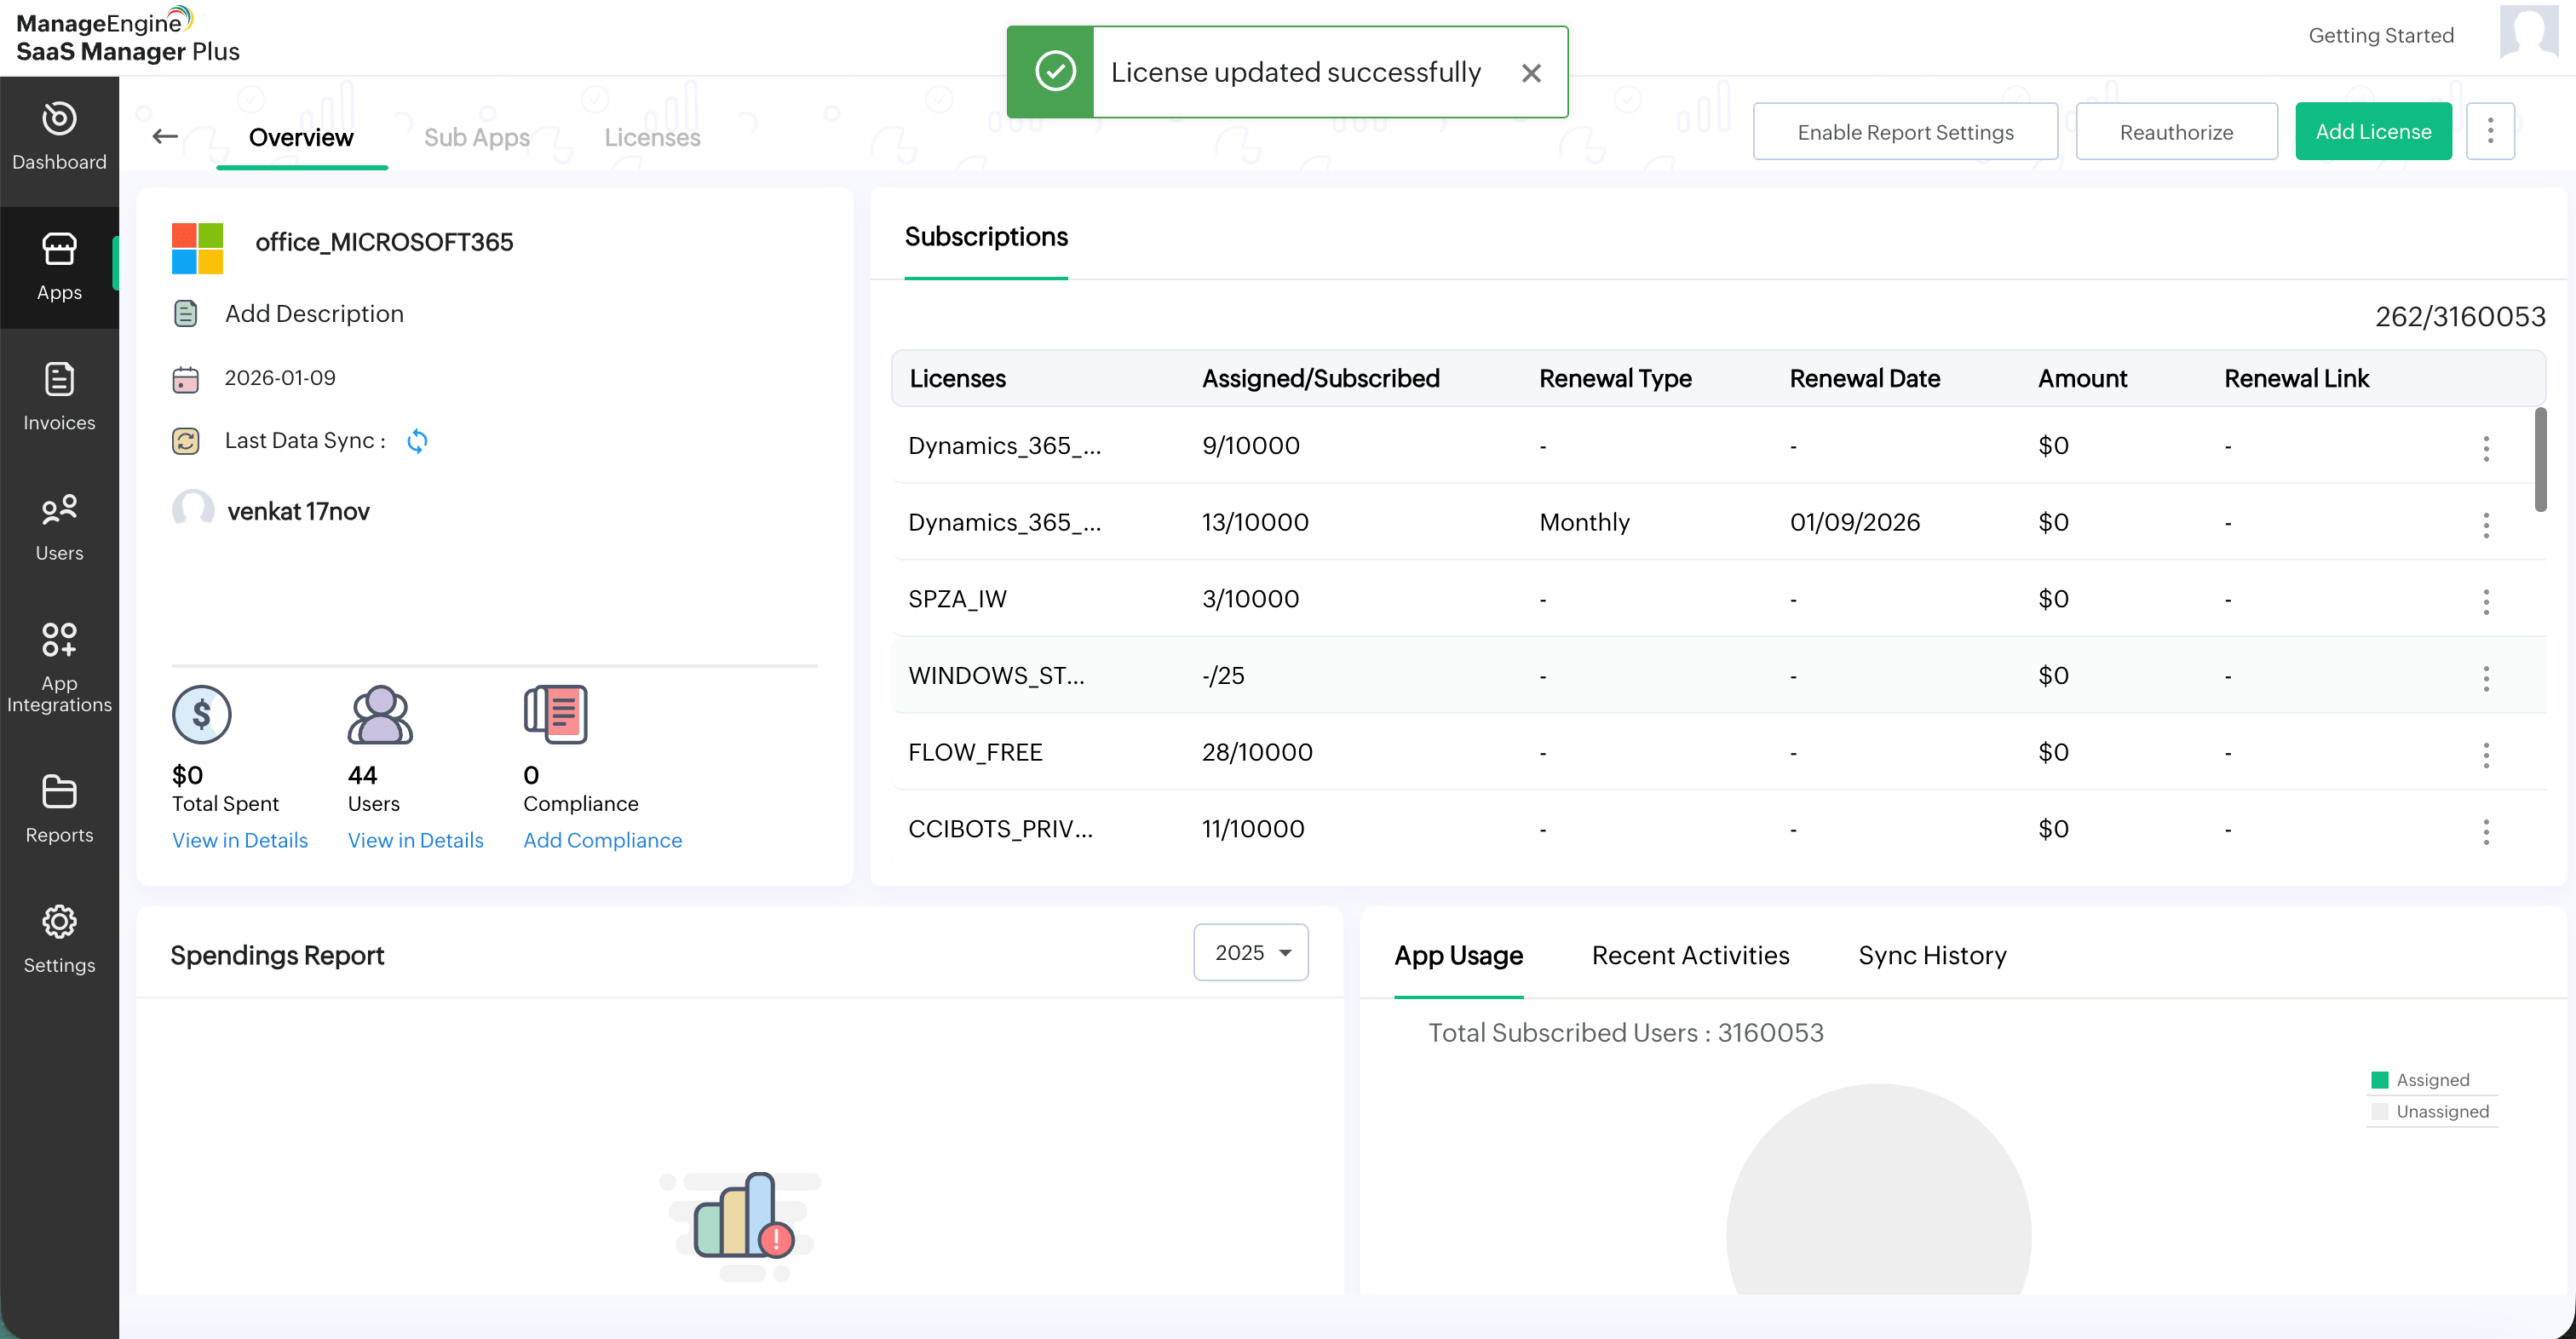
- Finally, click Add License to save the details to the selected vendor.
Note: To get a detailed view of Total Spent and Users, click on View in Details available above the Spendings Report.
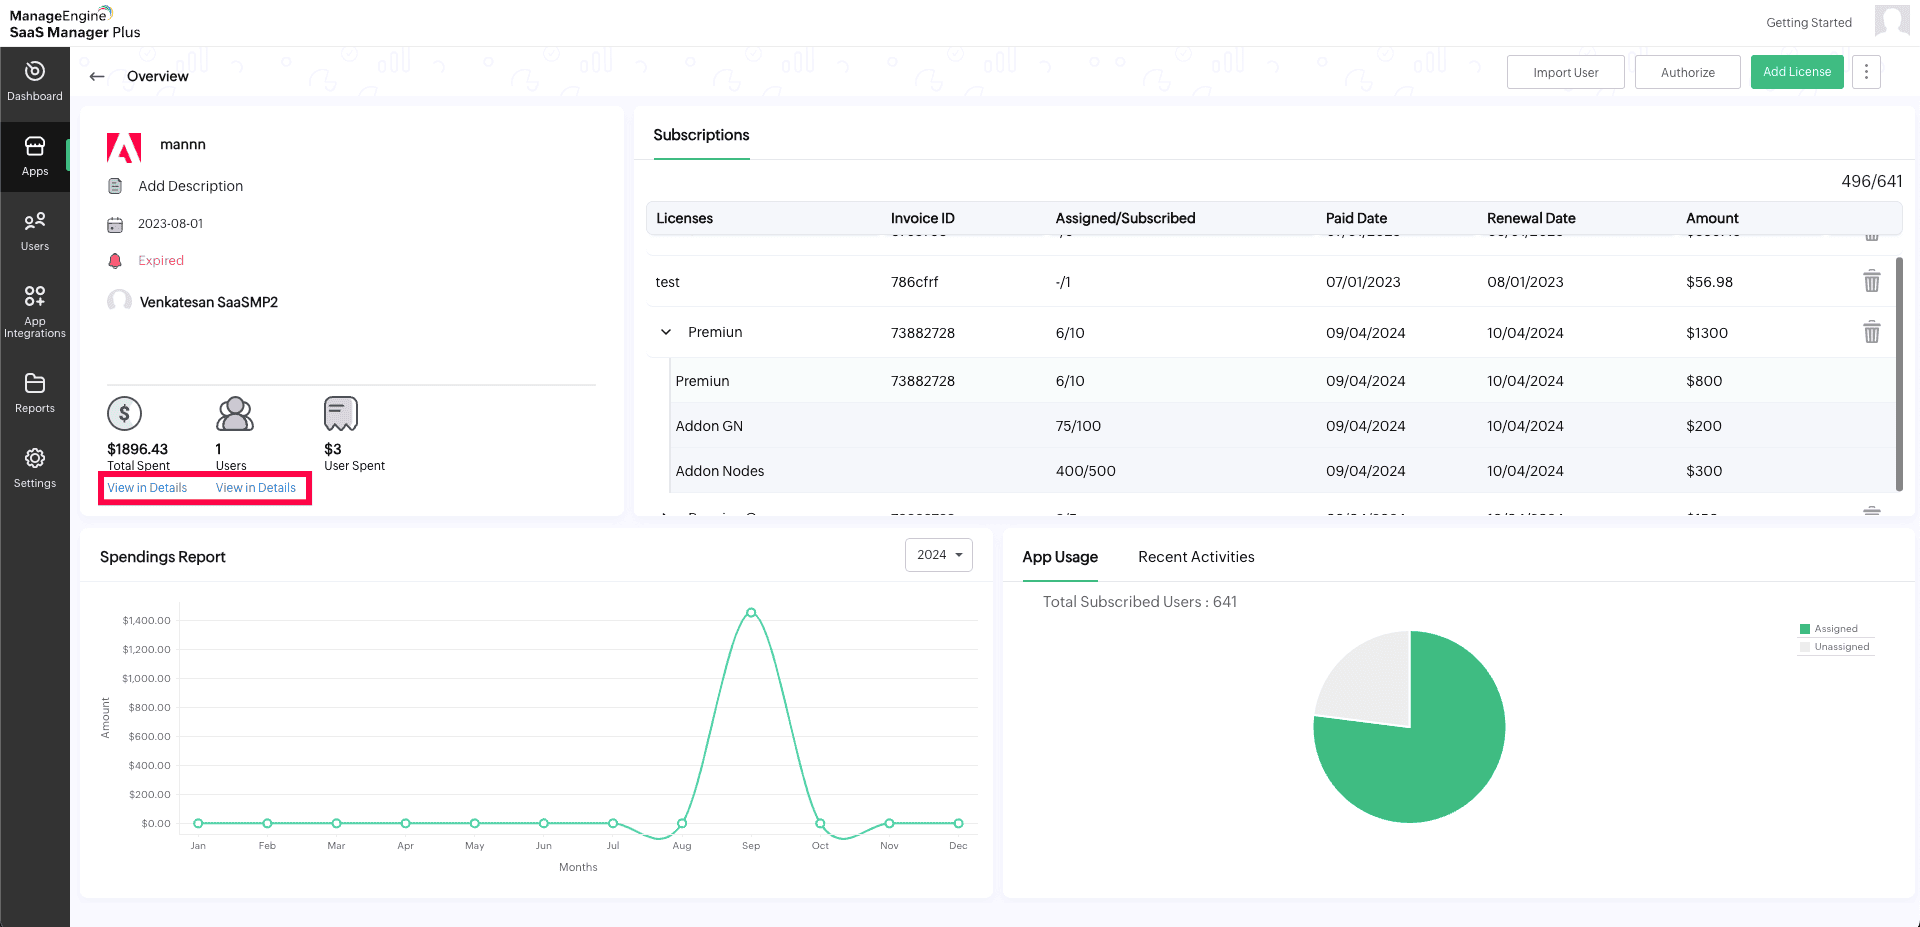
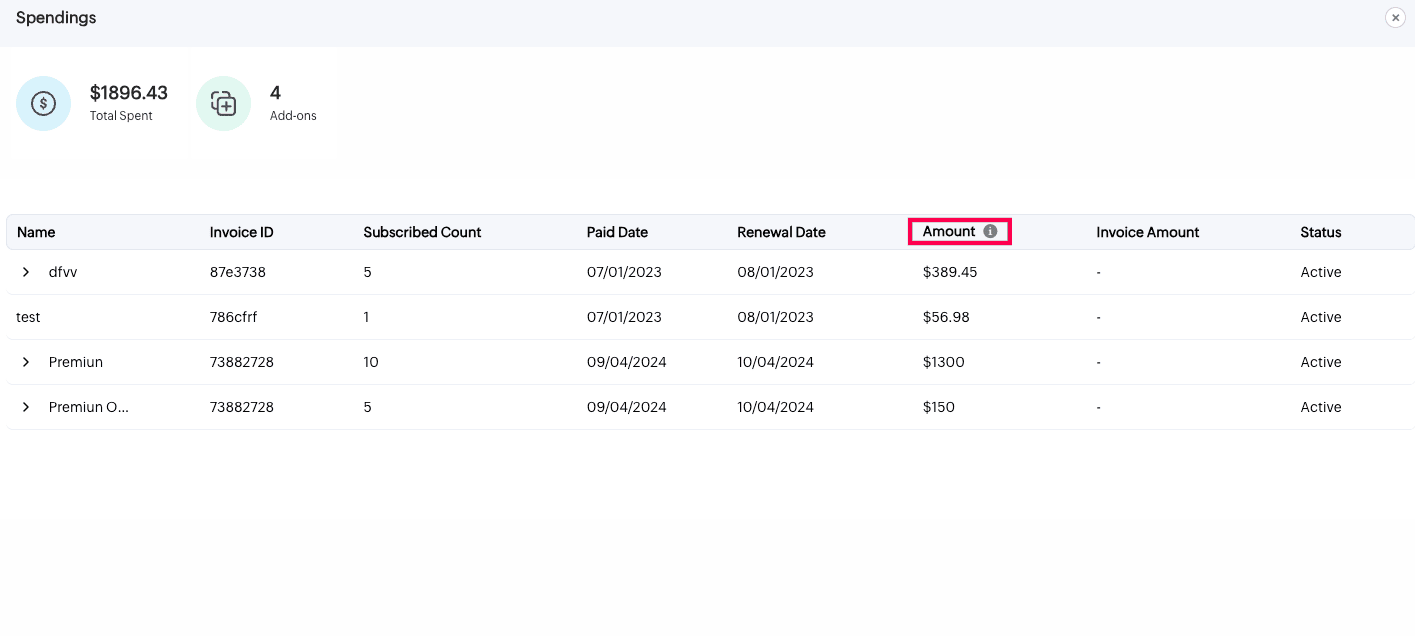
- Clicking on the View in Details will give a detailed spending history of the associated license. The Invoice Amount is the original invoice price, whereas Amount refers to the final price converted to the base currency selected in SaaS Manager Plus.
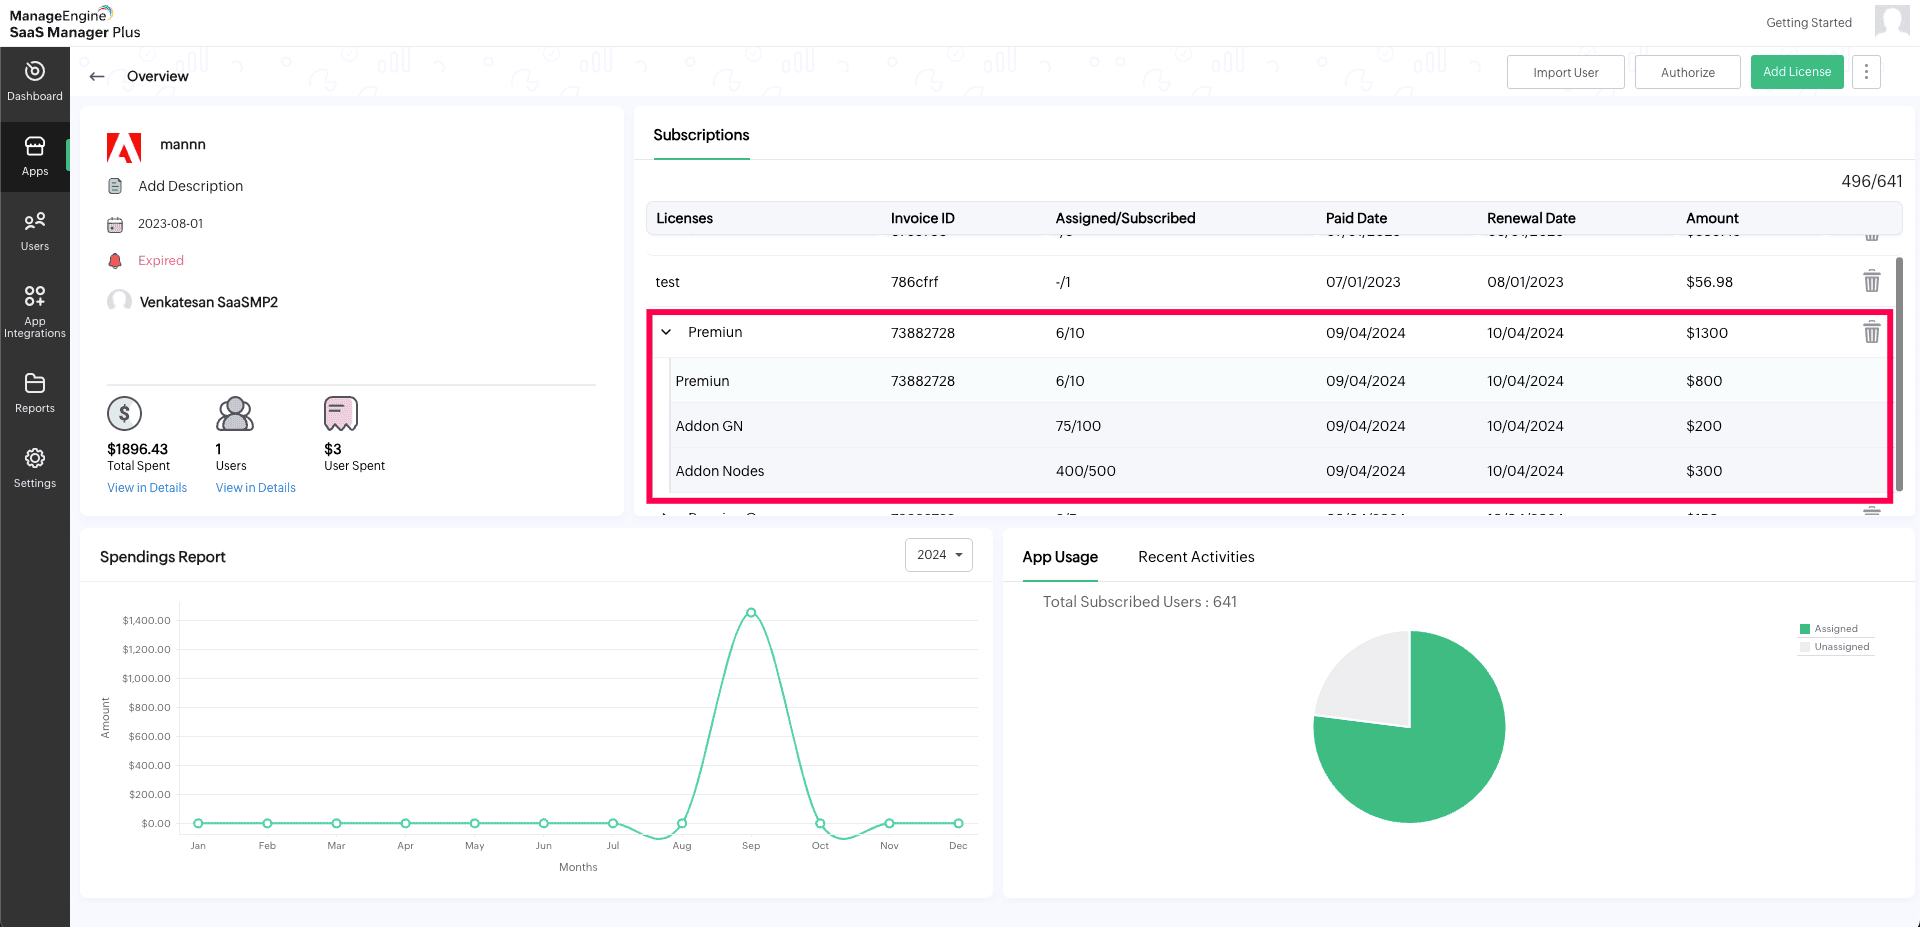
- The add-ons are reflected under the respective license in the Subscriptions section.
Adding an invoice to an app
- Select the app from the list.
- Click Add License button in the top-right corner and click Add Invoice from the drop-down list.
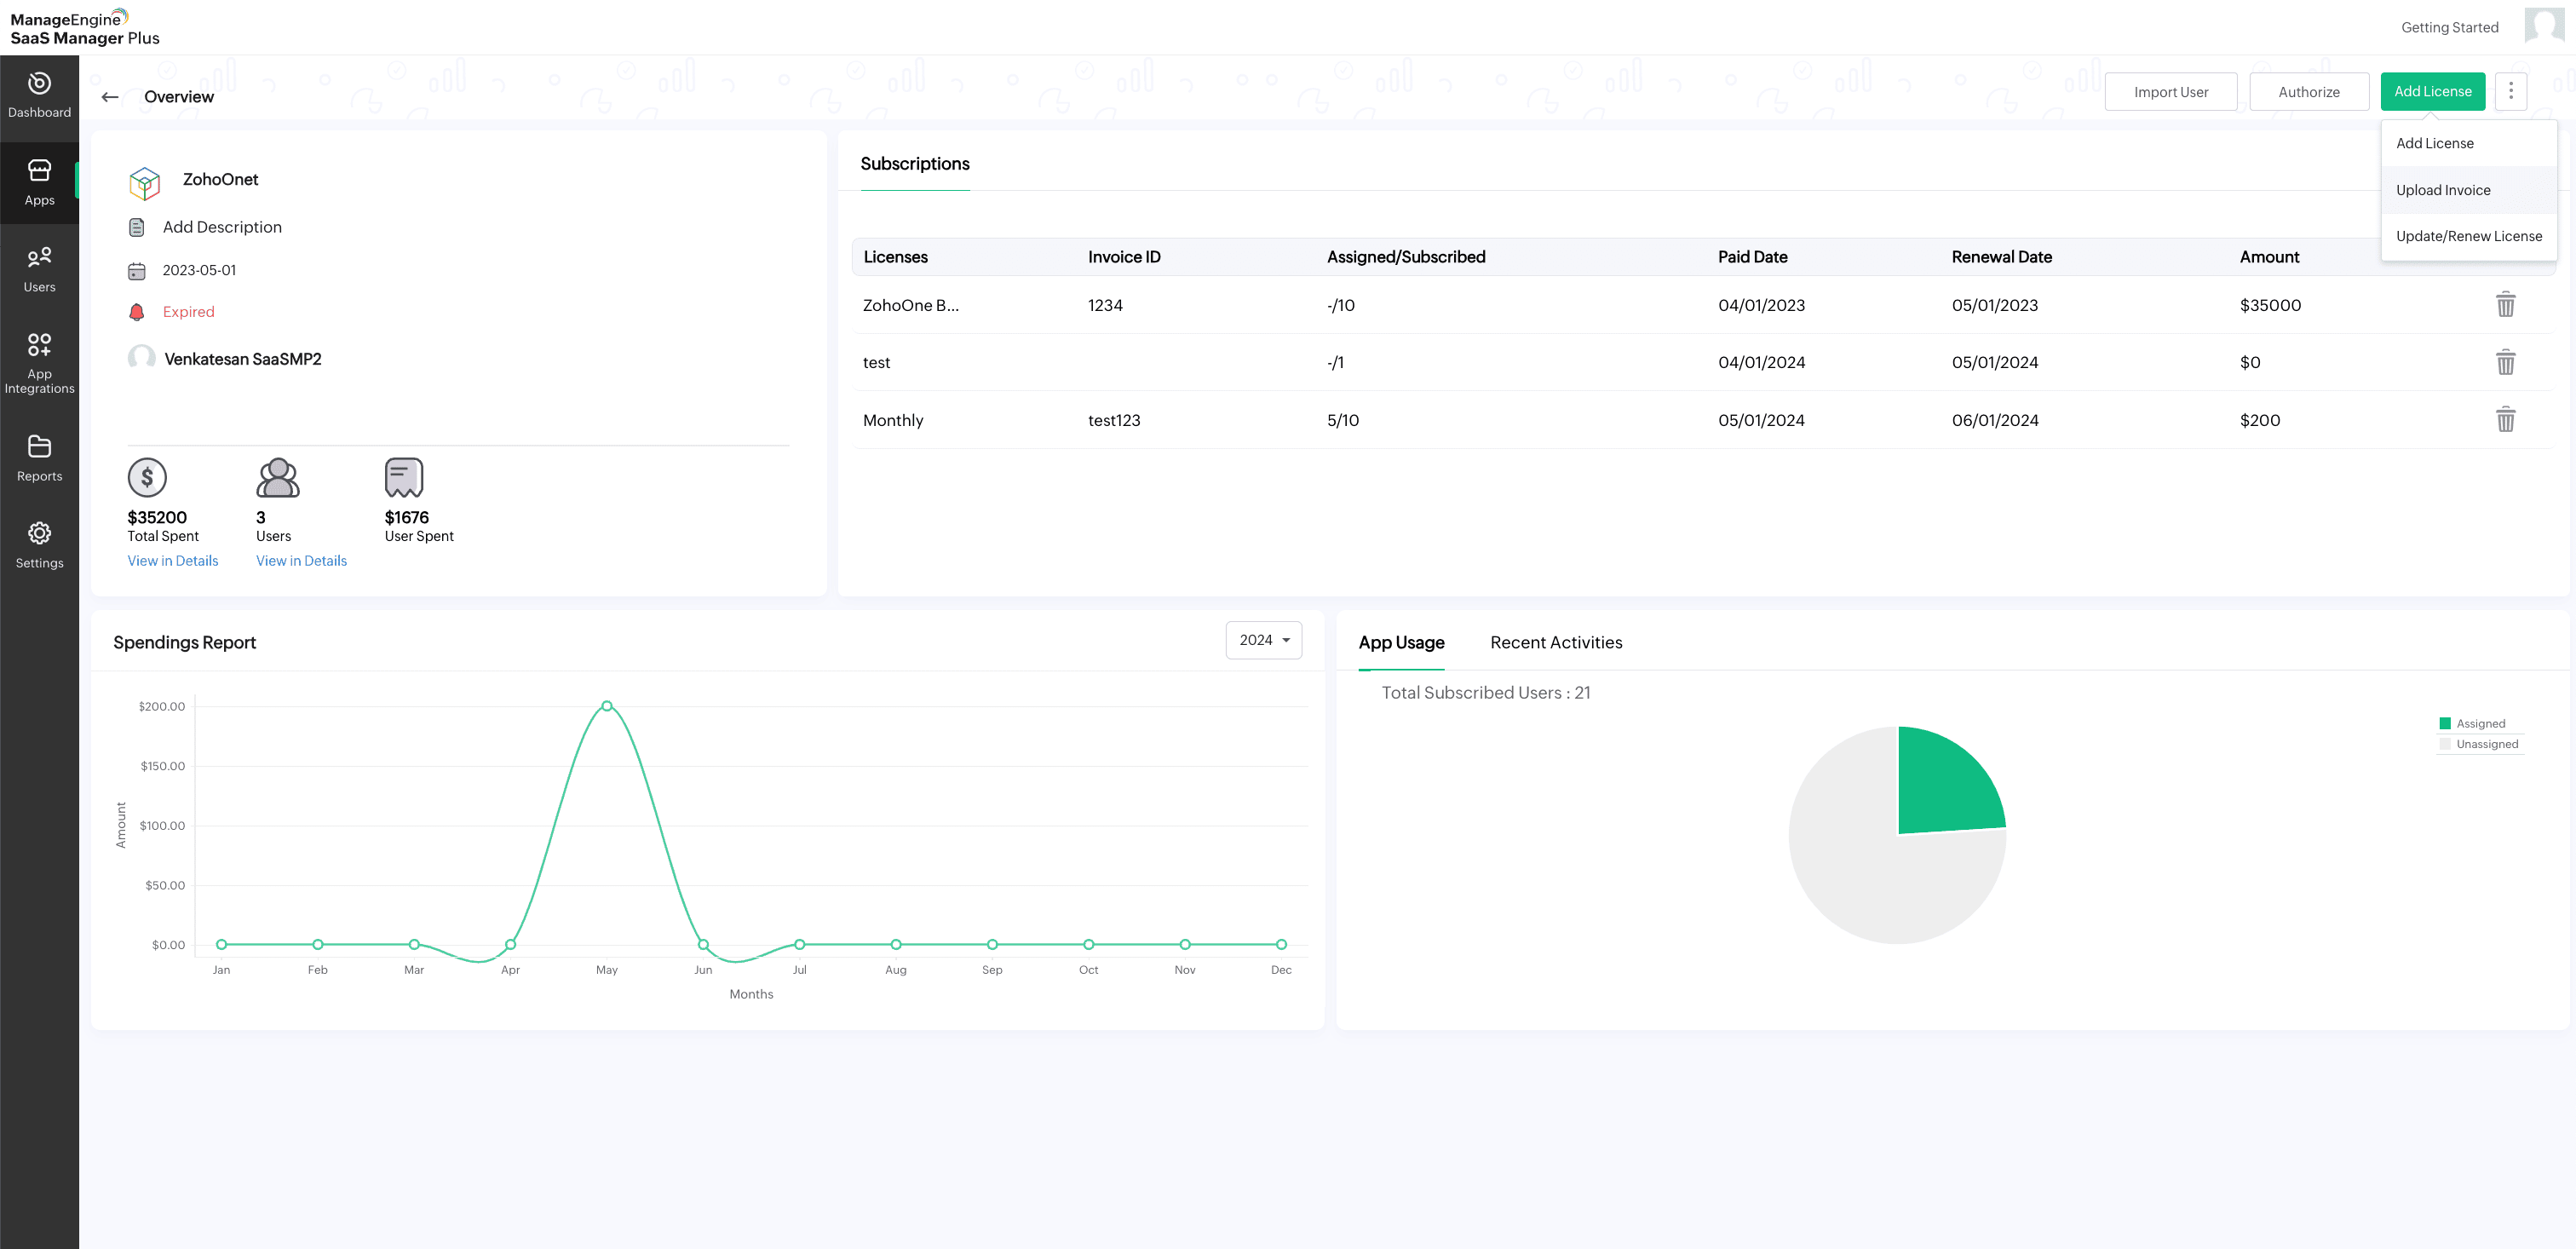
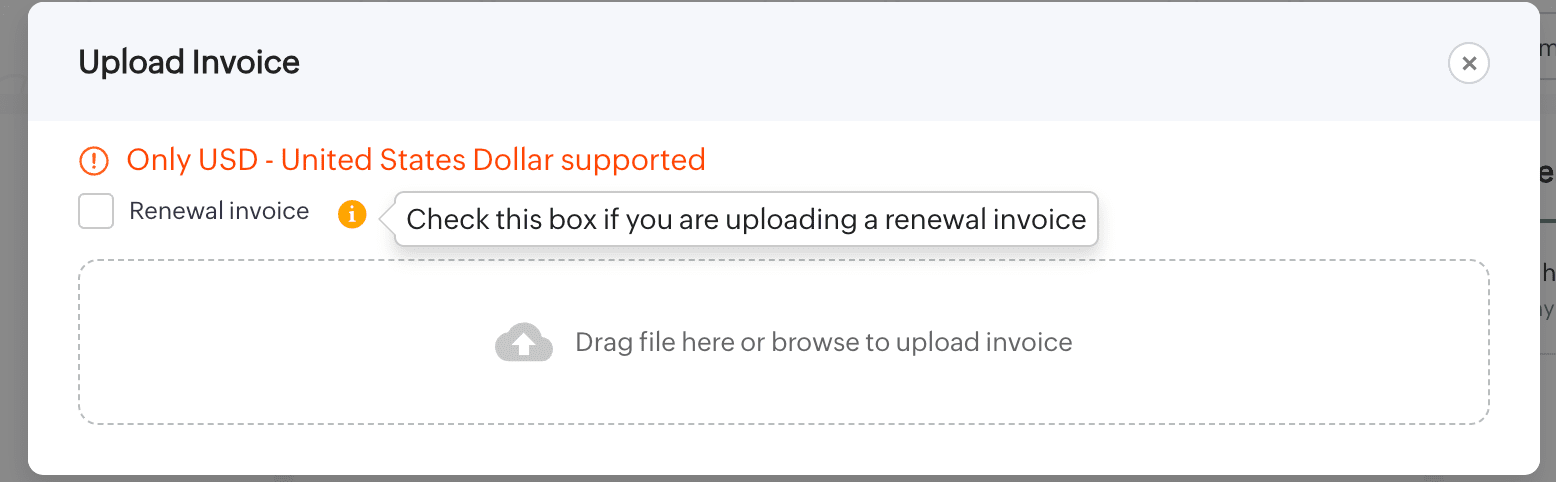
- Drag and drop the invoice file or browse to upload it from your system.
- Once the upload is successful, the new invoice details will be added to the selected app.
Updating or renewing a license for an app
- Select the vendor from the list.
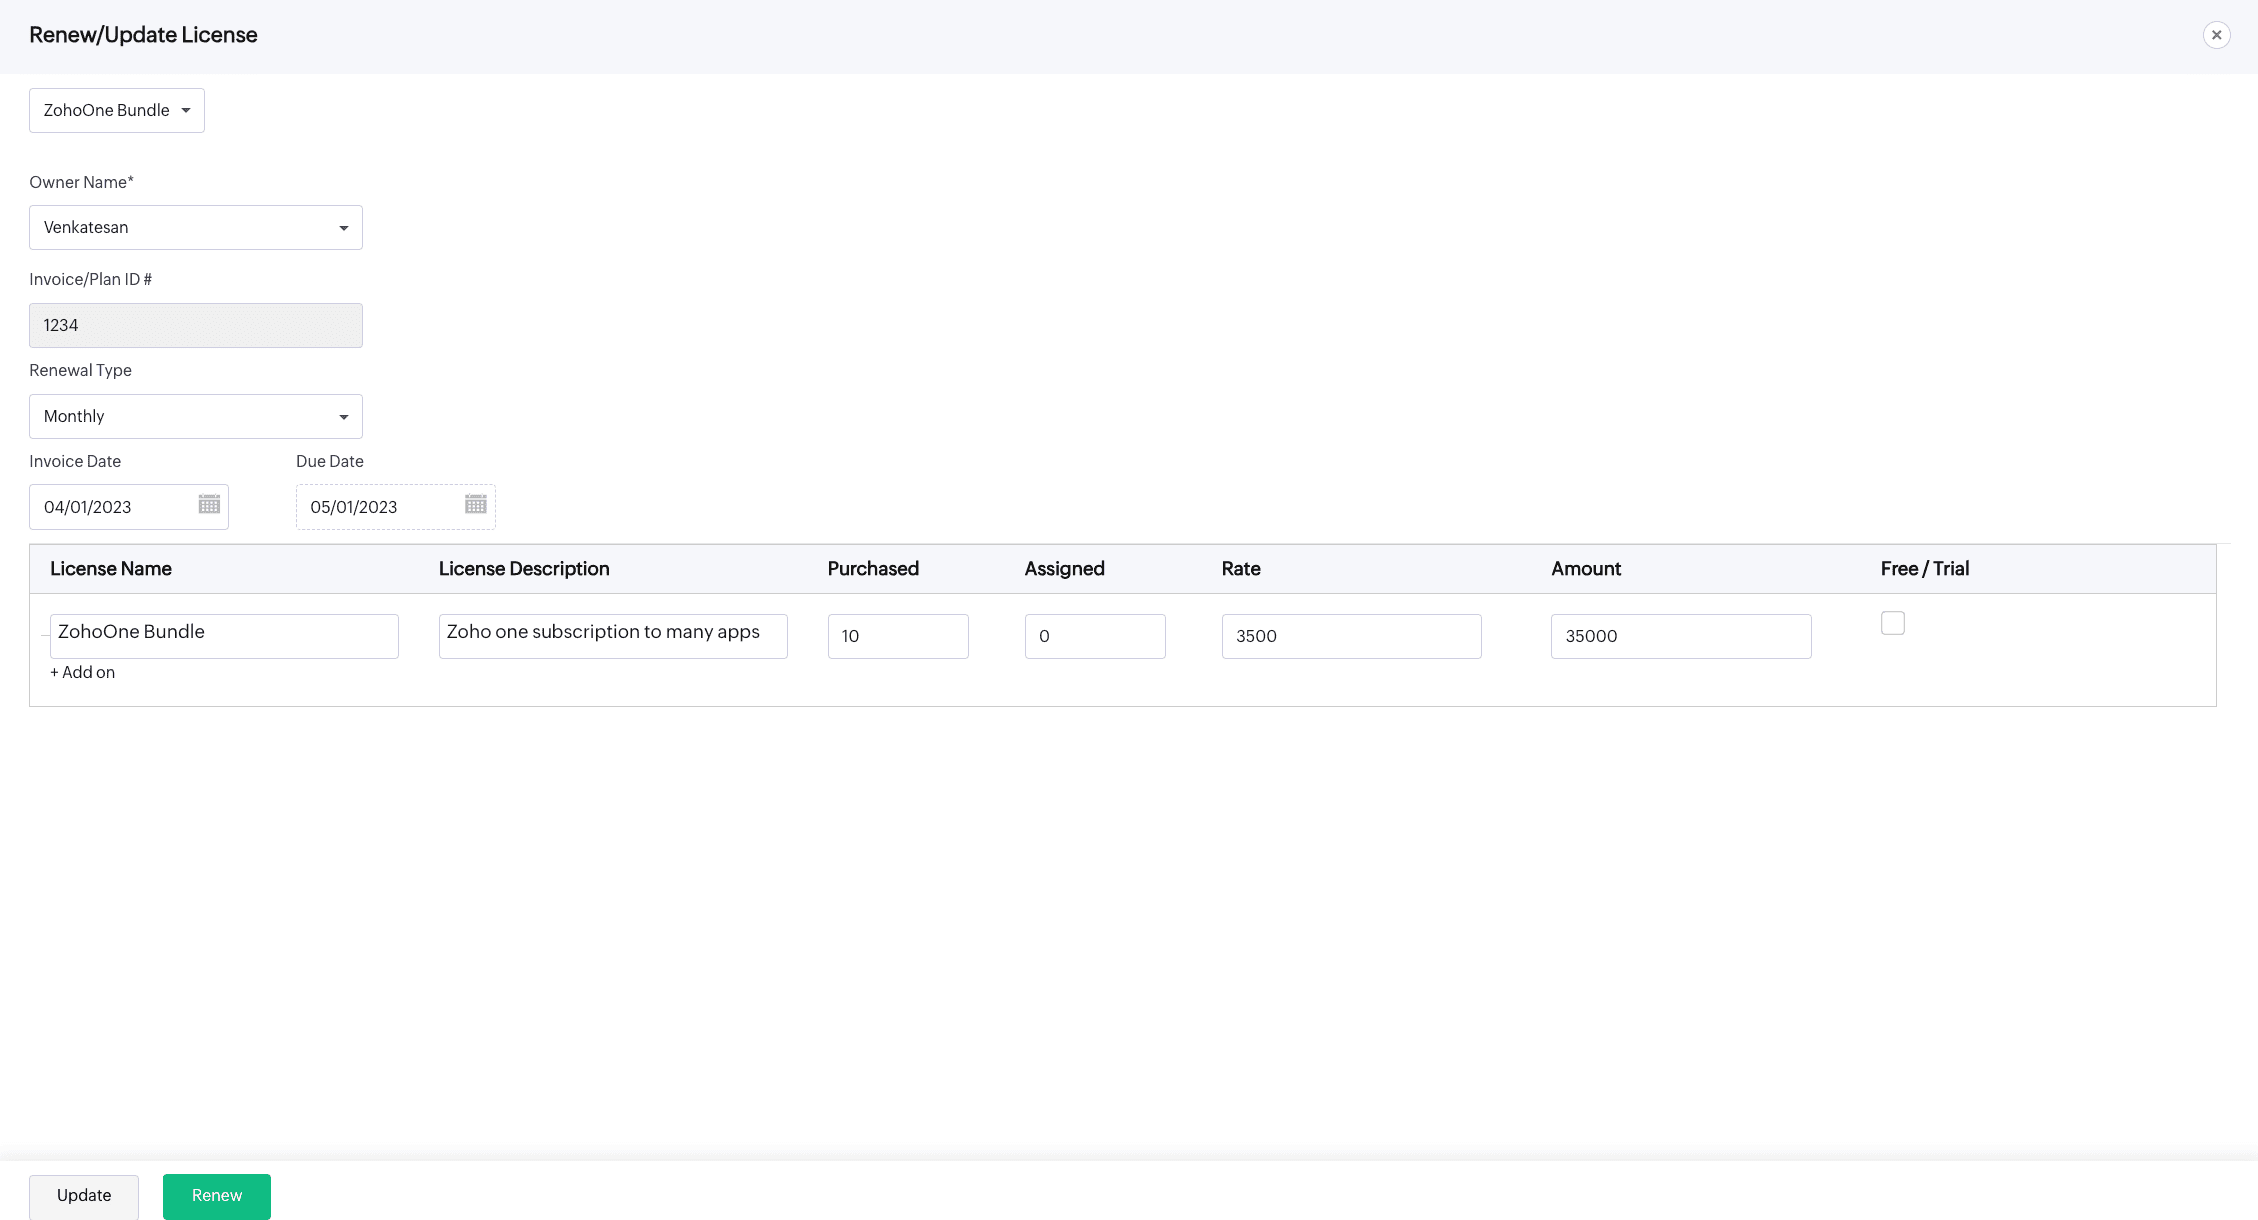
- Hover over the Add License button in the top-right corner and click Update/Renew License from the drop-down list.
- In the new window, select the license you want to update or renew from the drop-down list.
- Update the necessary details like Owner, Invoice/Plan ID, Renewal Type, Invoice Date, Due Date, and Add-on.
- Once you've made the changes, click Update or Renew to save the updates.
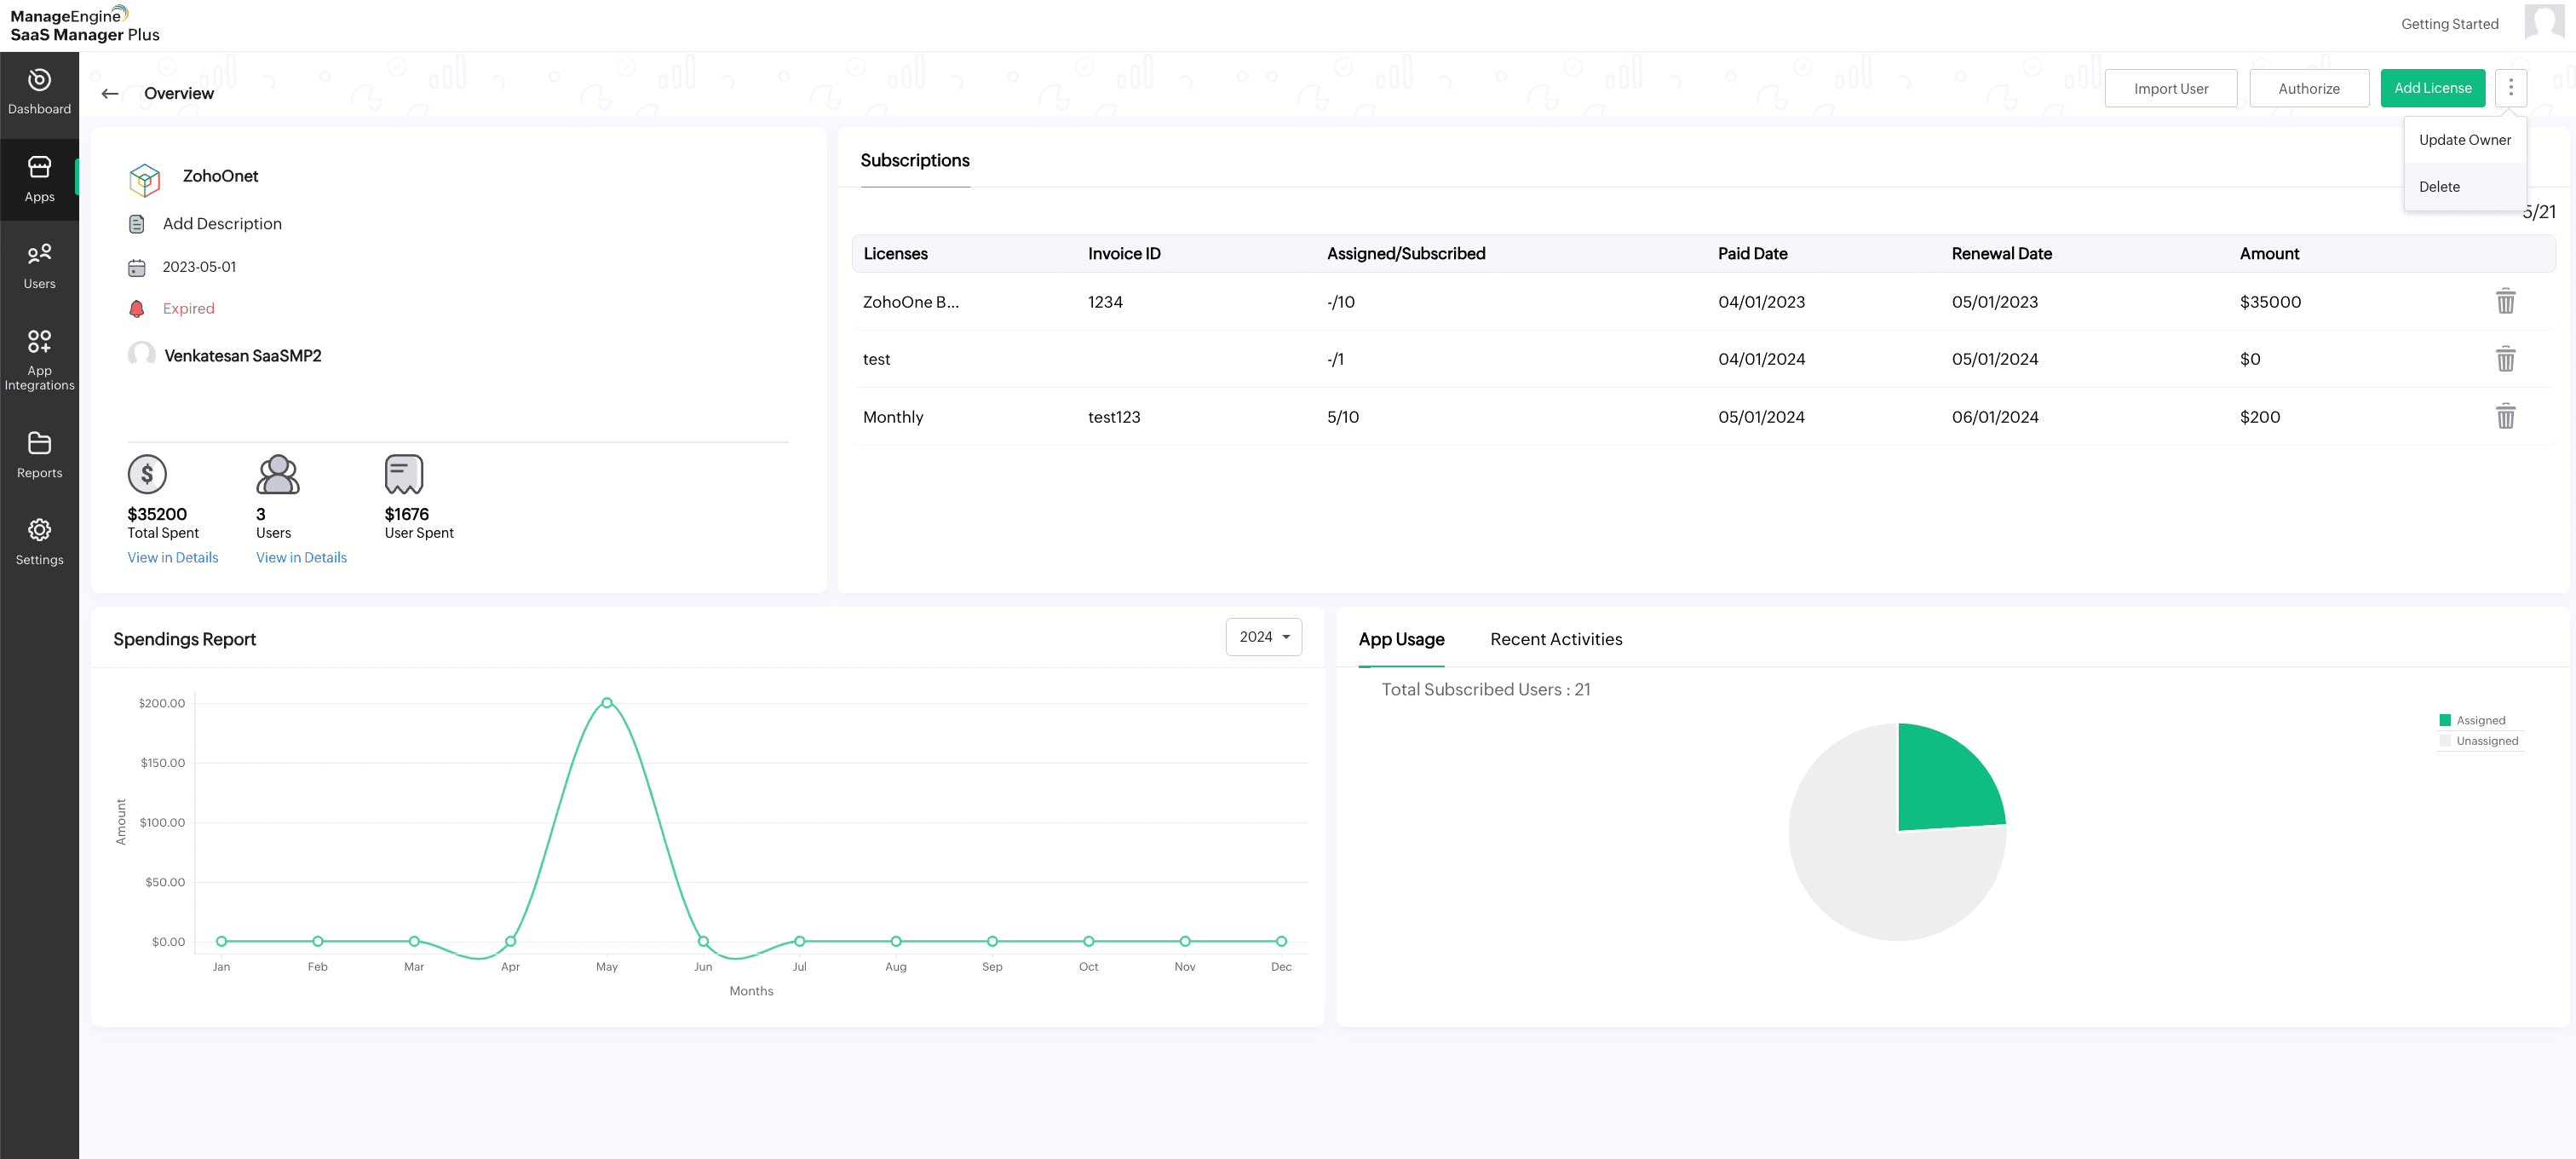
Updating the owner of an app
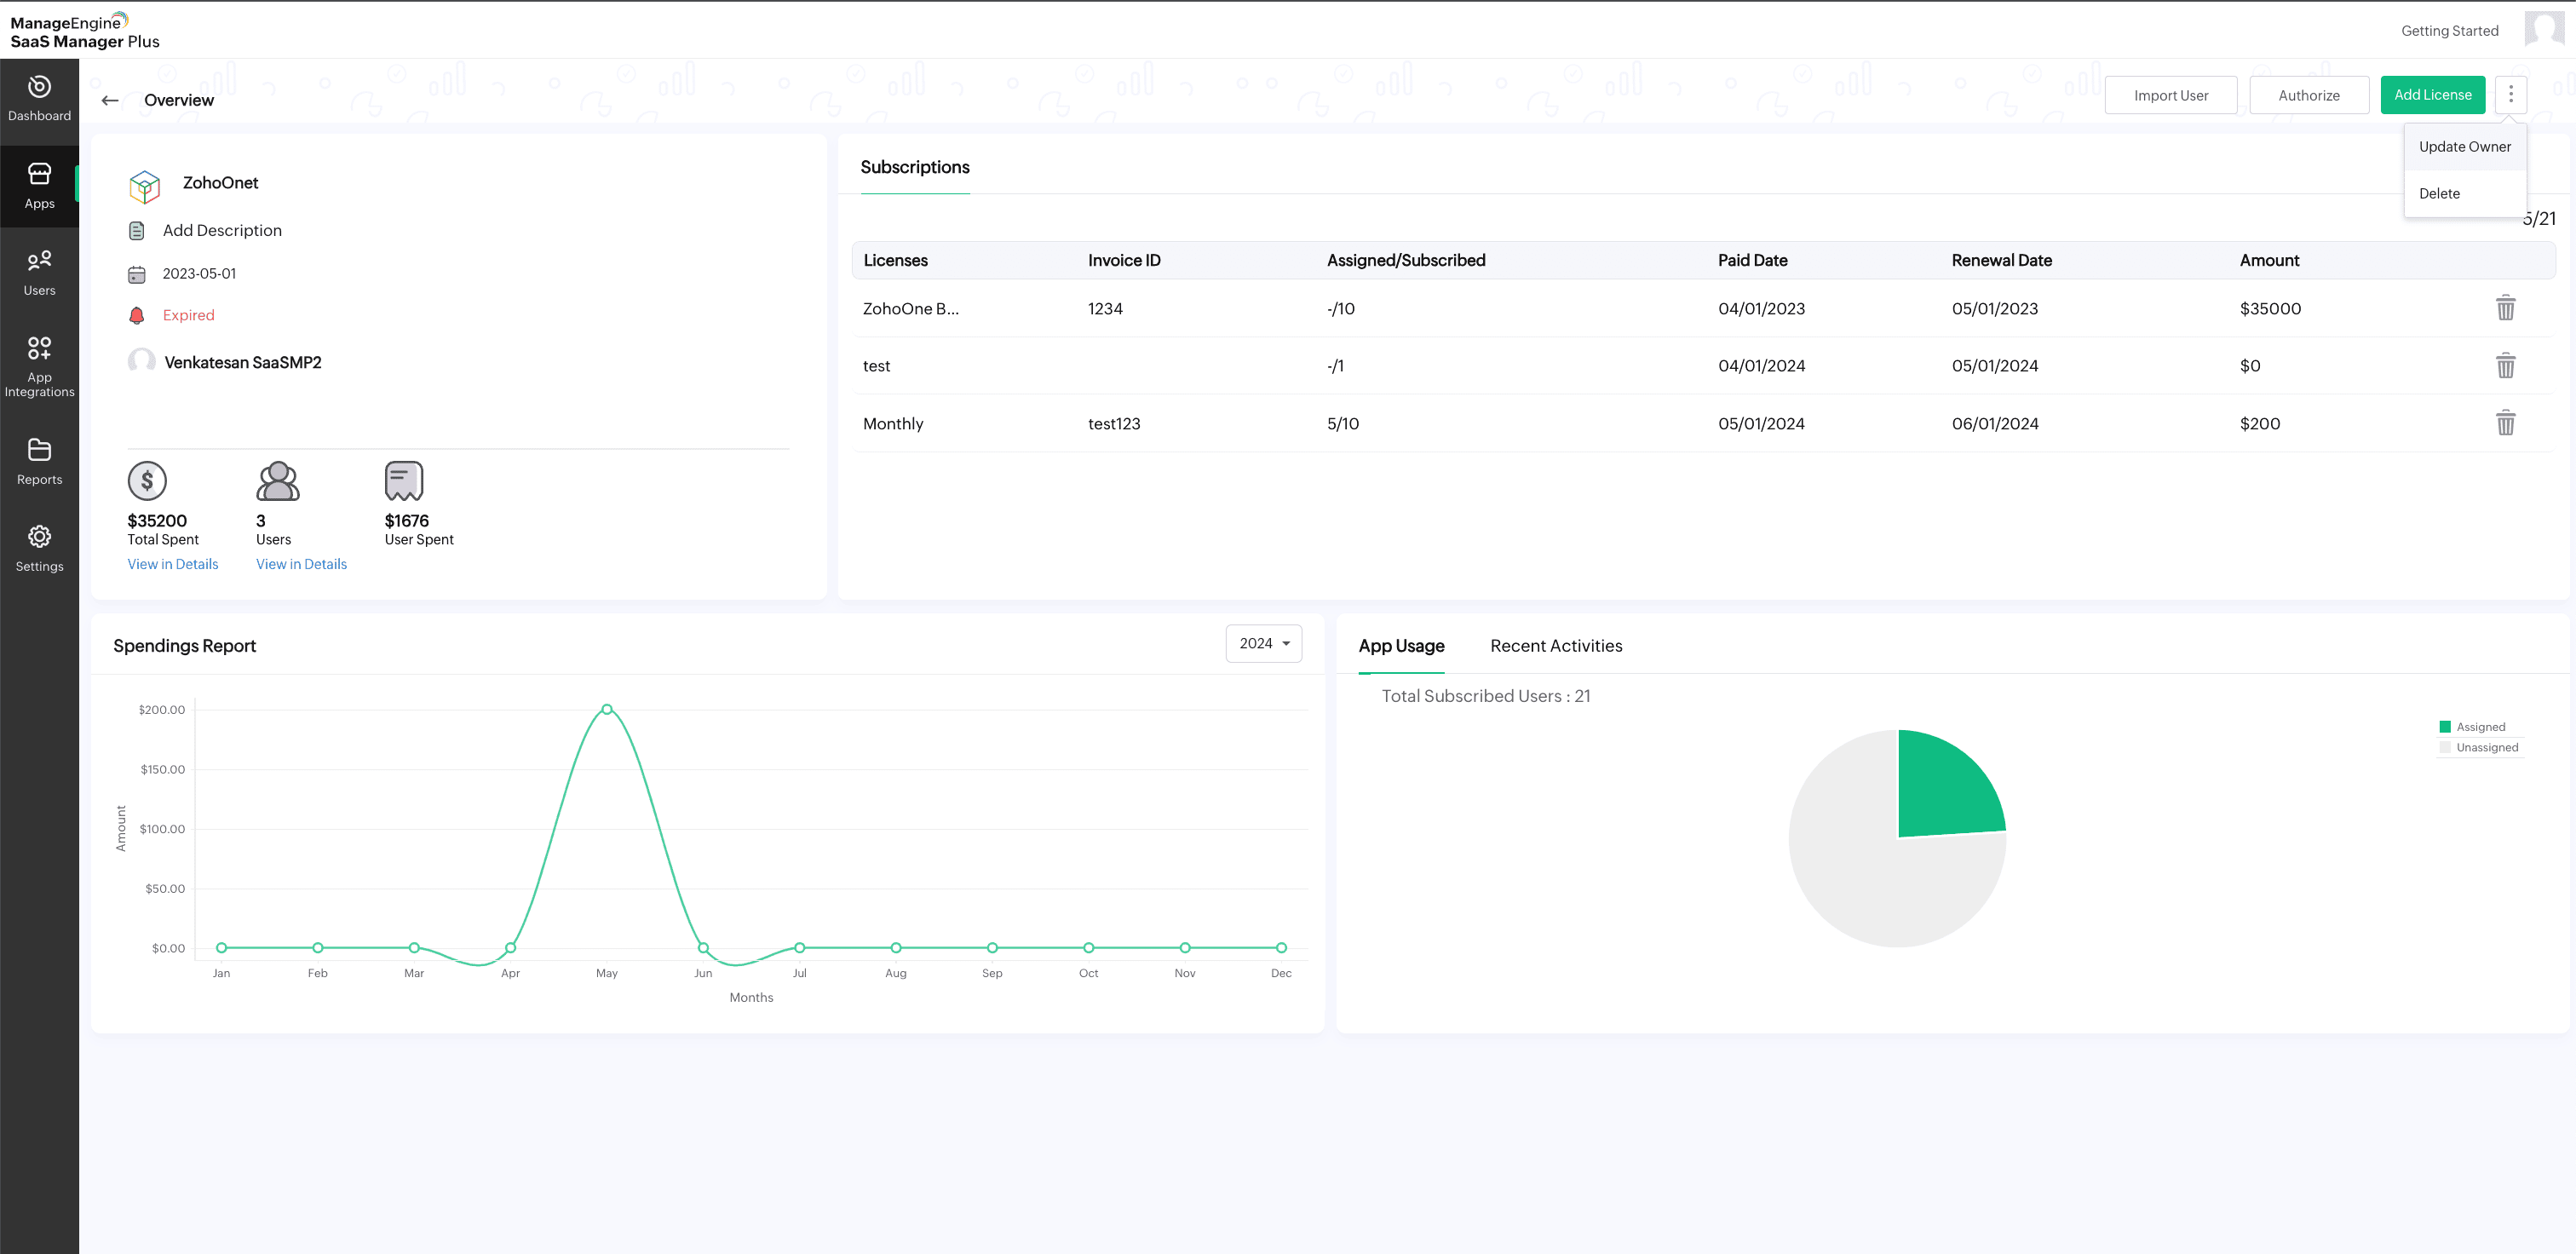
- Select the app from the list.
- Click the kebab menu in the top-right corner and click Update Owner from the drop-down list.
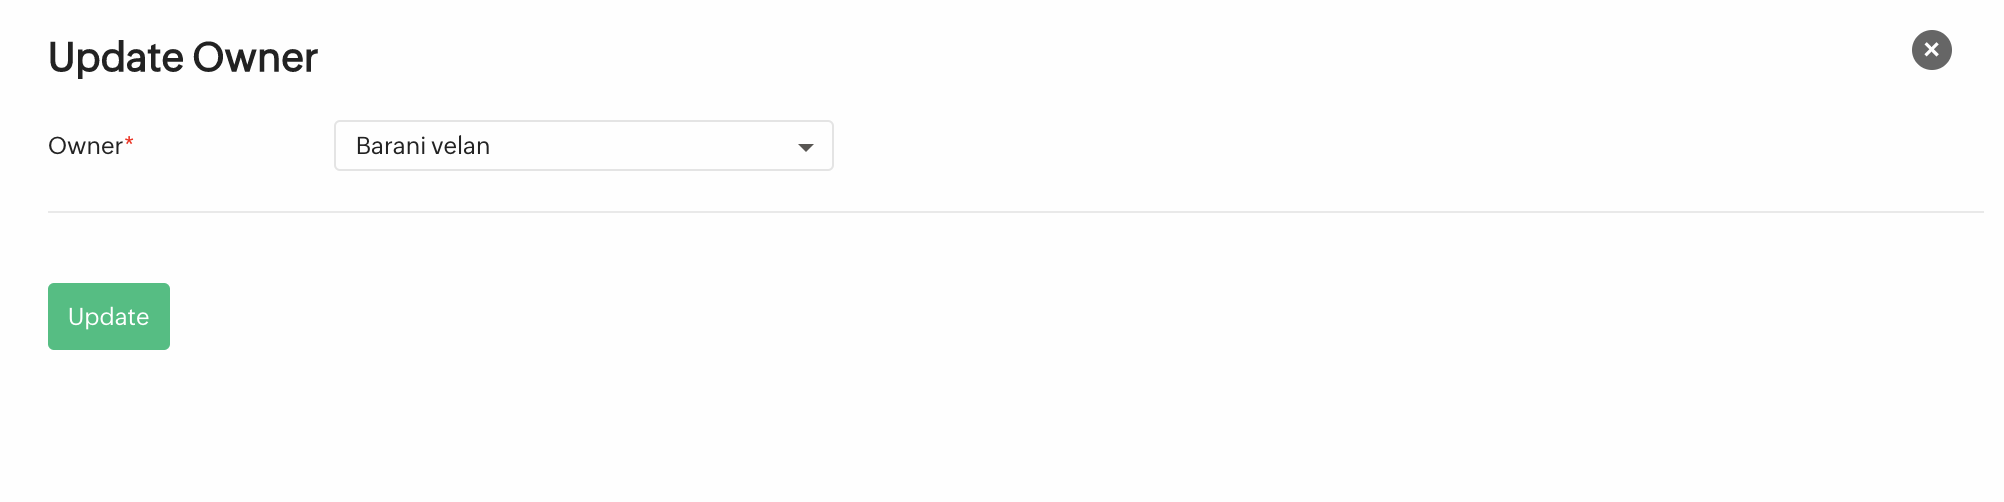
- In the new window, select the new owner from the drop-down list.
- Click Update to save the changes to the selected vendor.
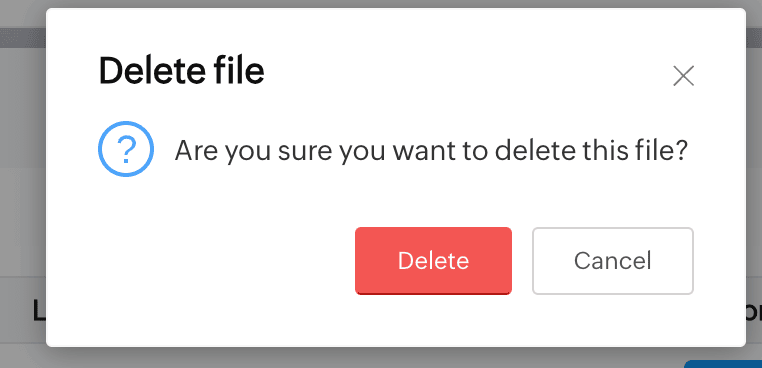
Deleting an app
- Select the app from the list.
- Click the kebab menu in the top-right corner and click Delete from the drop-down list.
Enabling Report Settings
- In the top, you'll find the Enable Report Settings button available only for Microsoft365 vendors.
- Click on Enable Report Settings to fetch the user details along with user principal name and display name for mapping the user activities with the users.
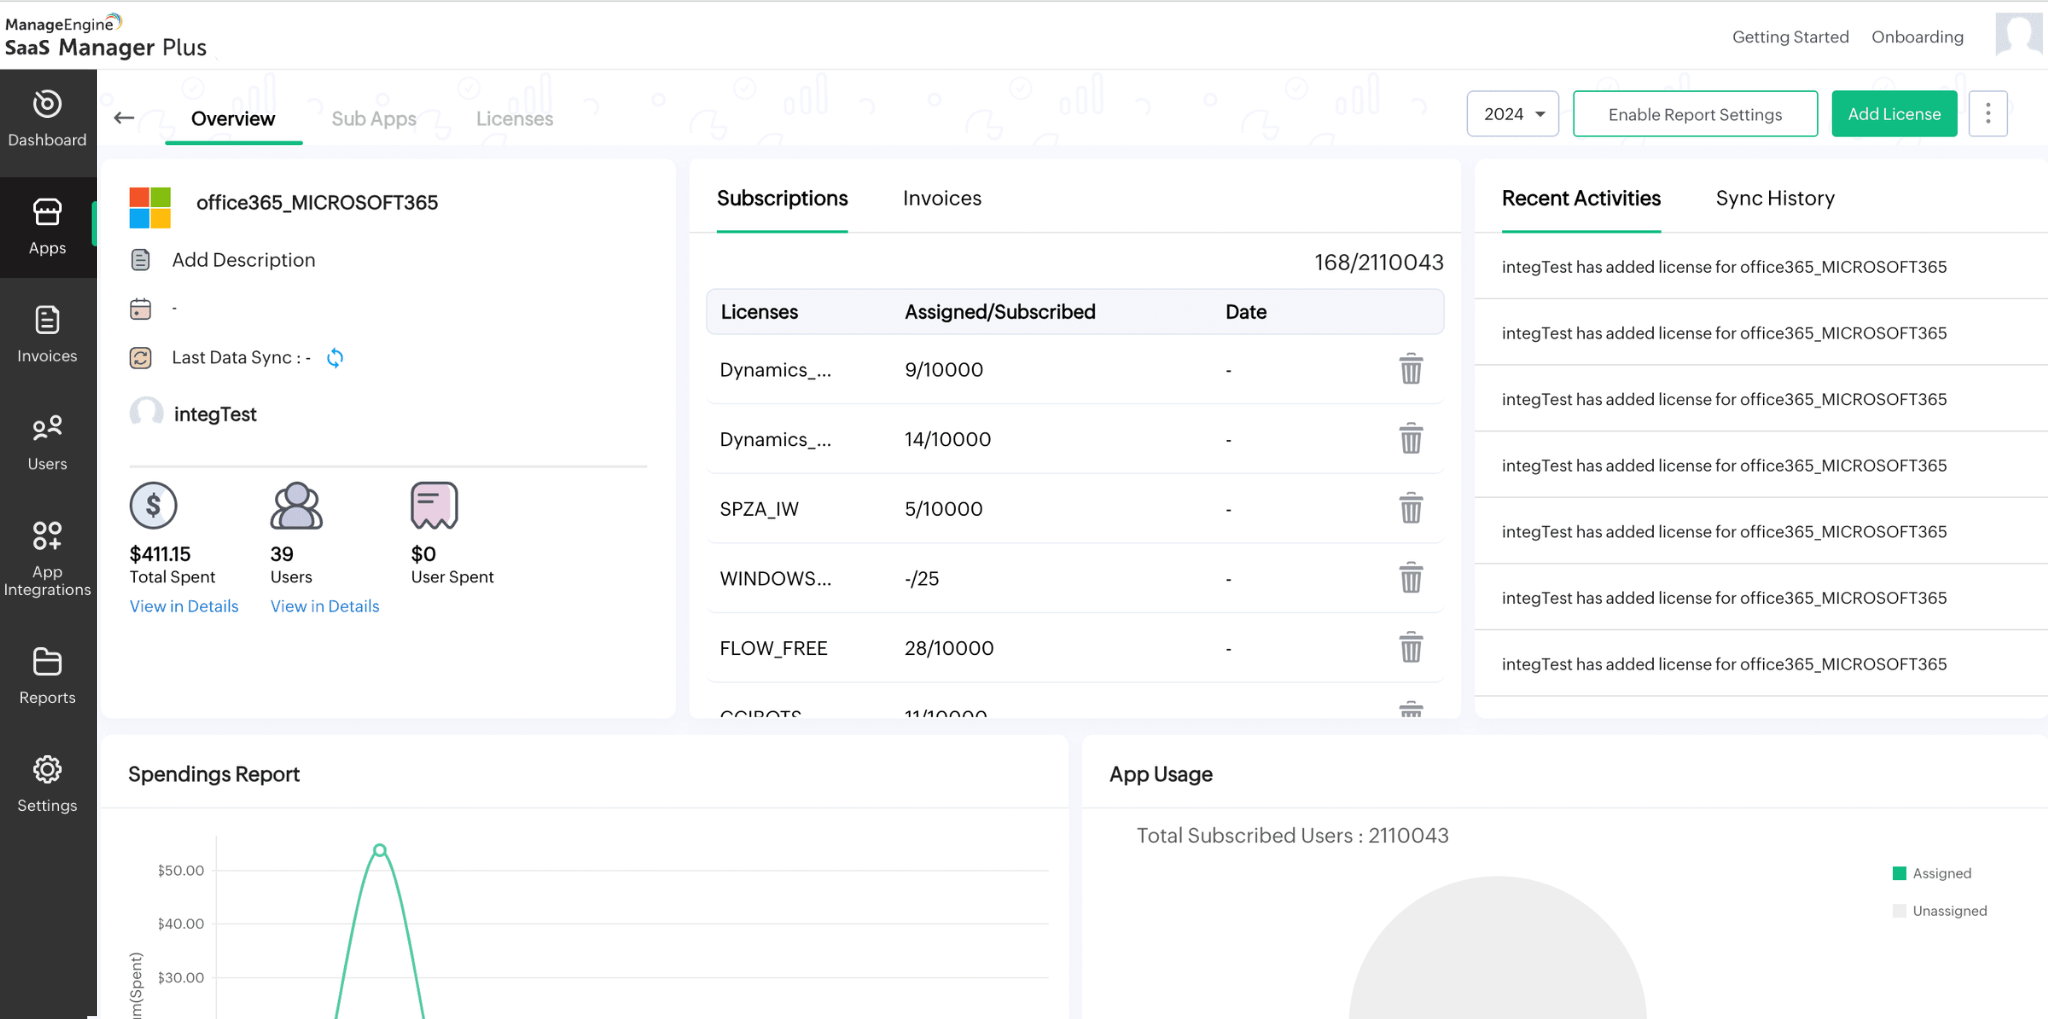
- Sub Apps is available next to Overview in the top right corner.
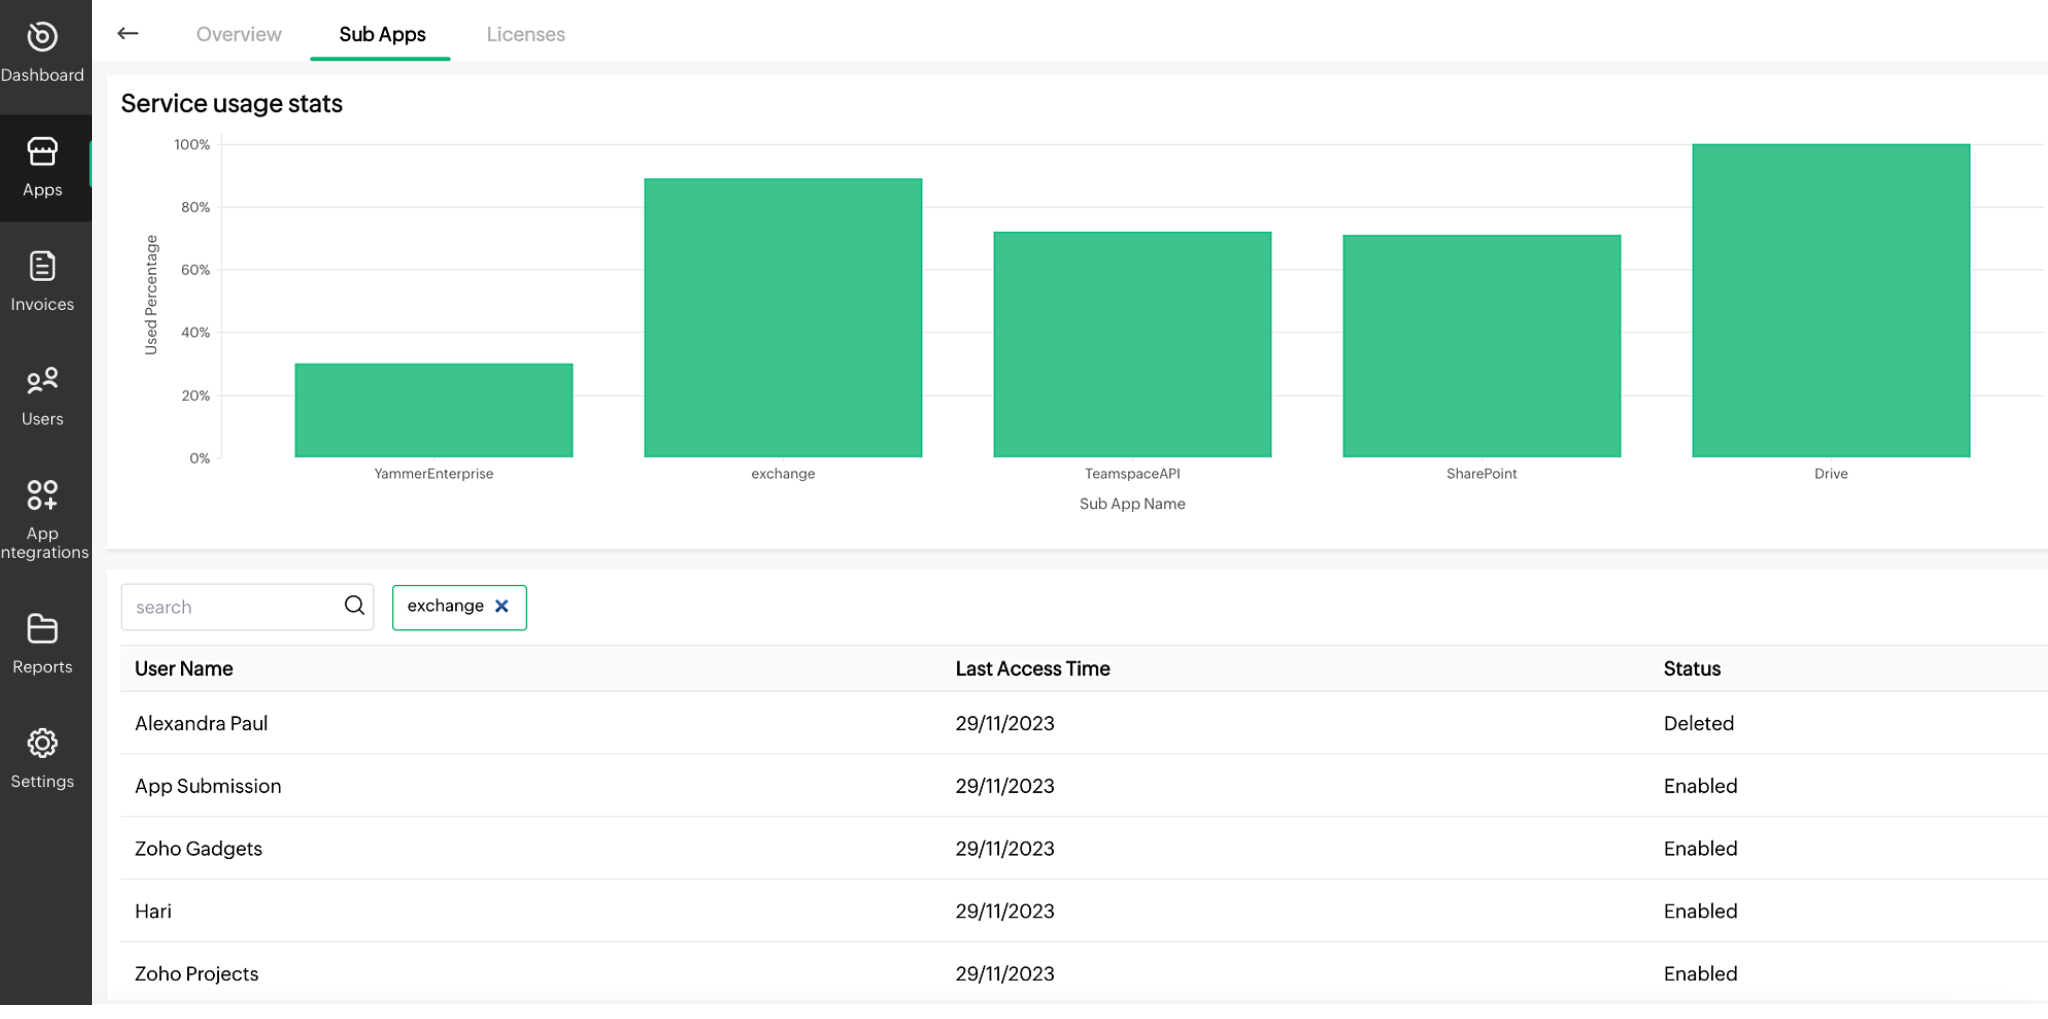
- Click on Sub Apps to check the Service Usage Stats of each sub-app. Service Name, Last Access Time, Last Access User, Active Users Count, and Total Users Count.
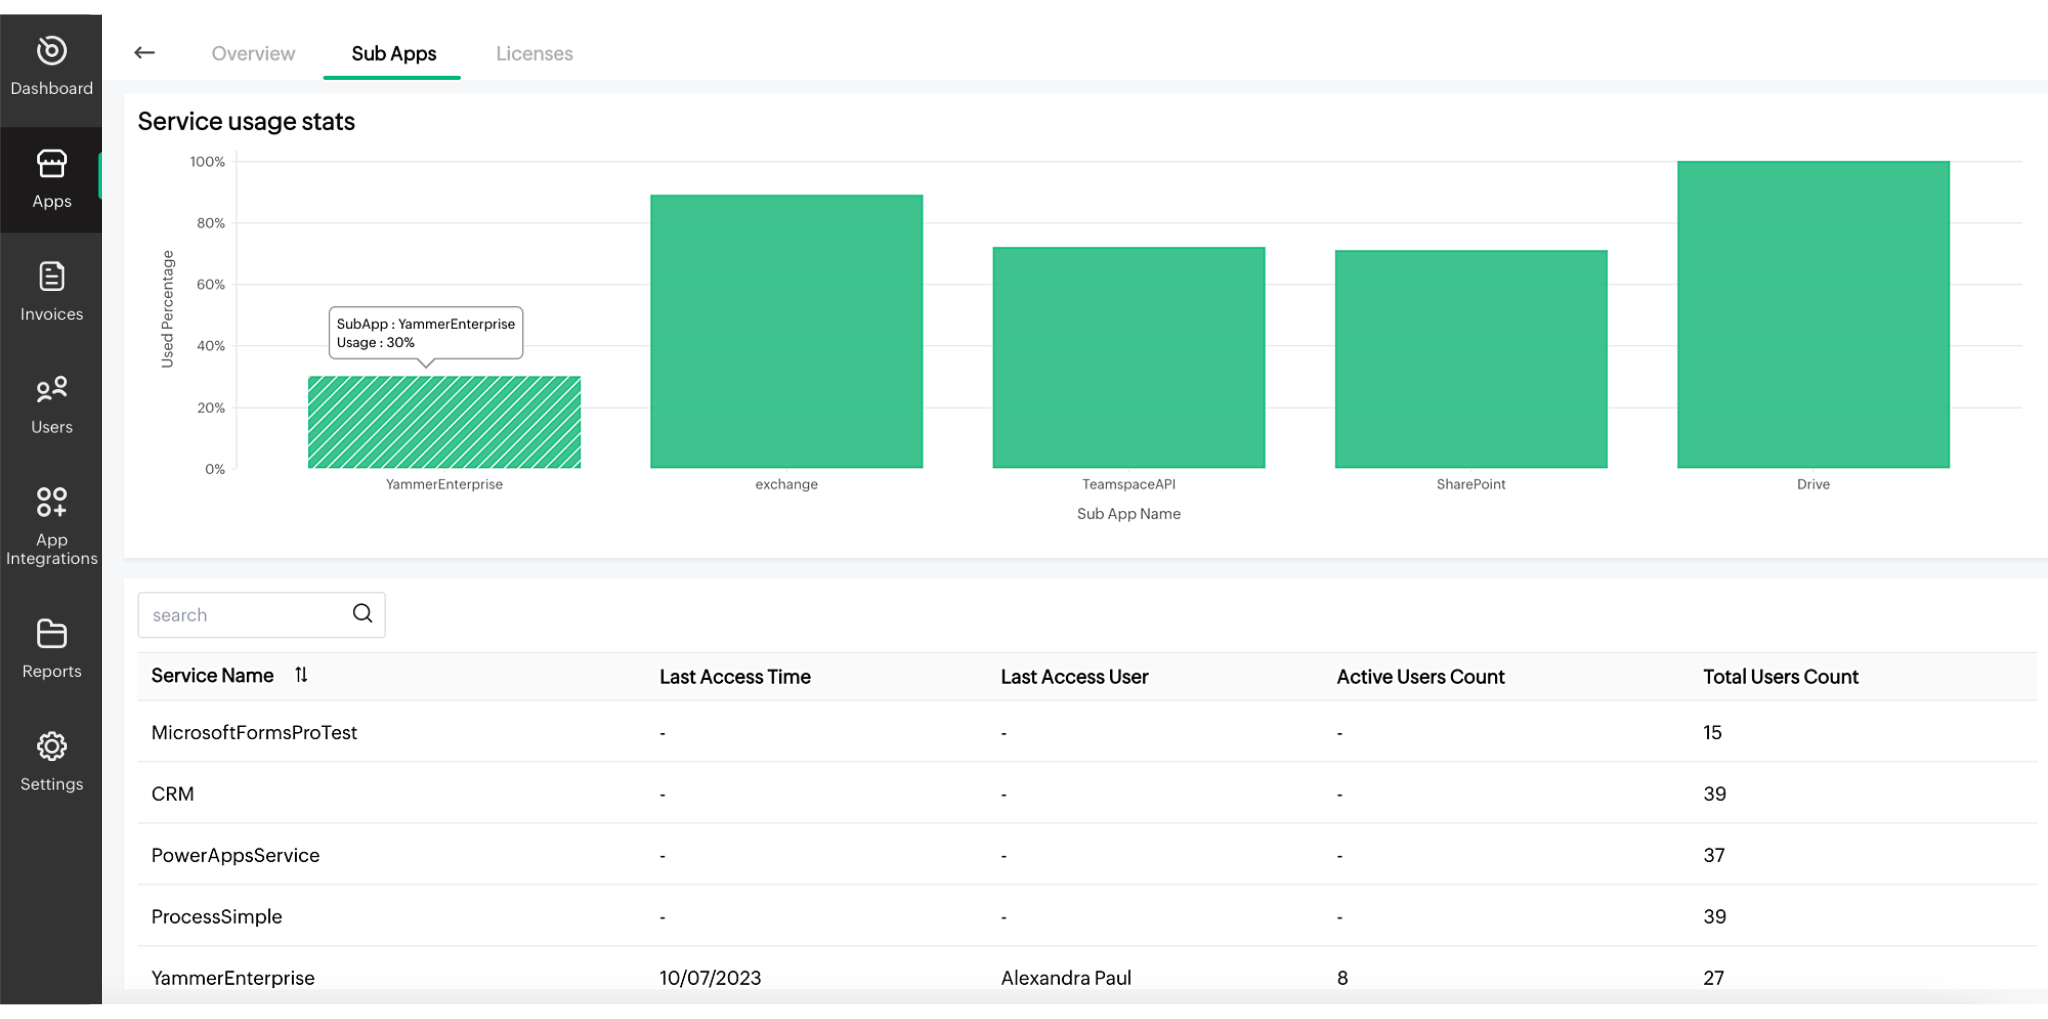
- Click any particular Service Name to check the User Name, Last Access Time, and Status of each user.
Adding compliance documents
- Select the app from the list.
- Click Add Compliance located below the app details.
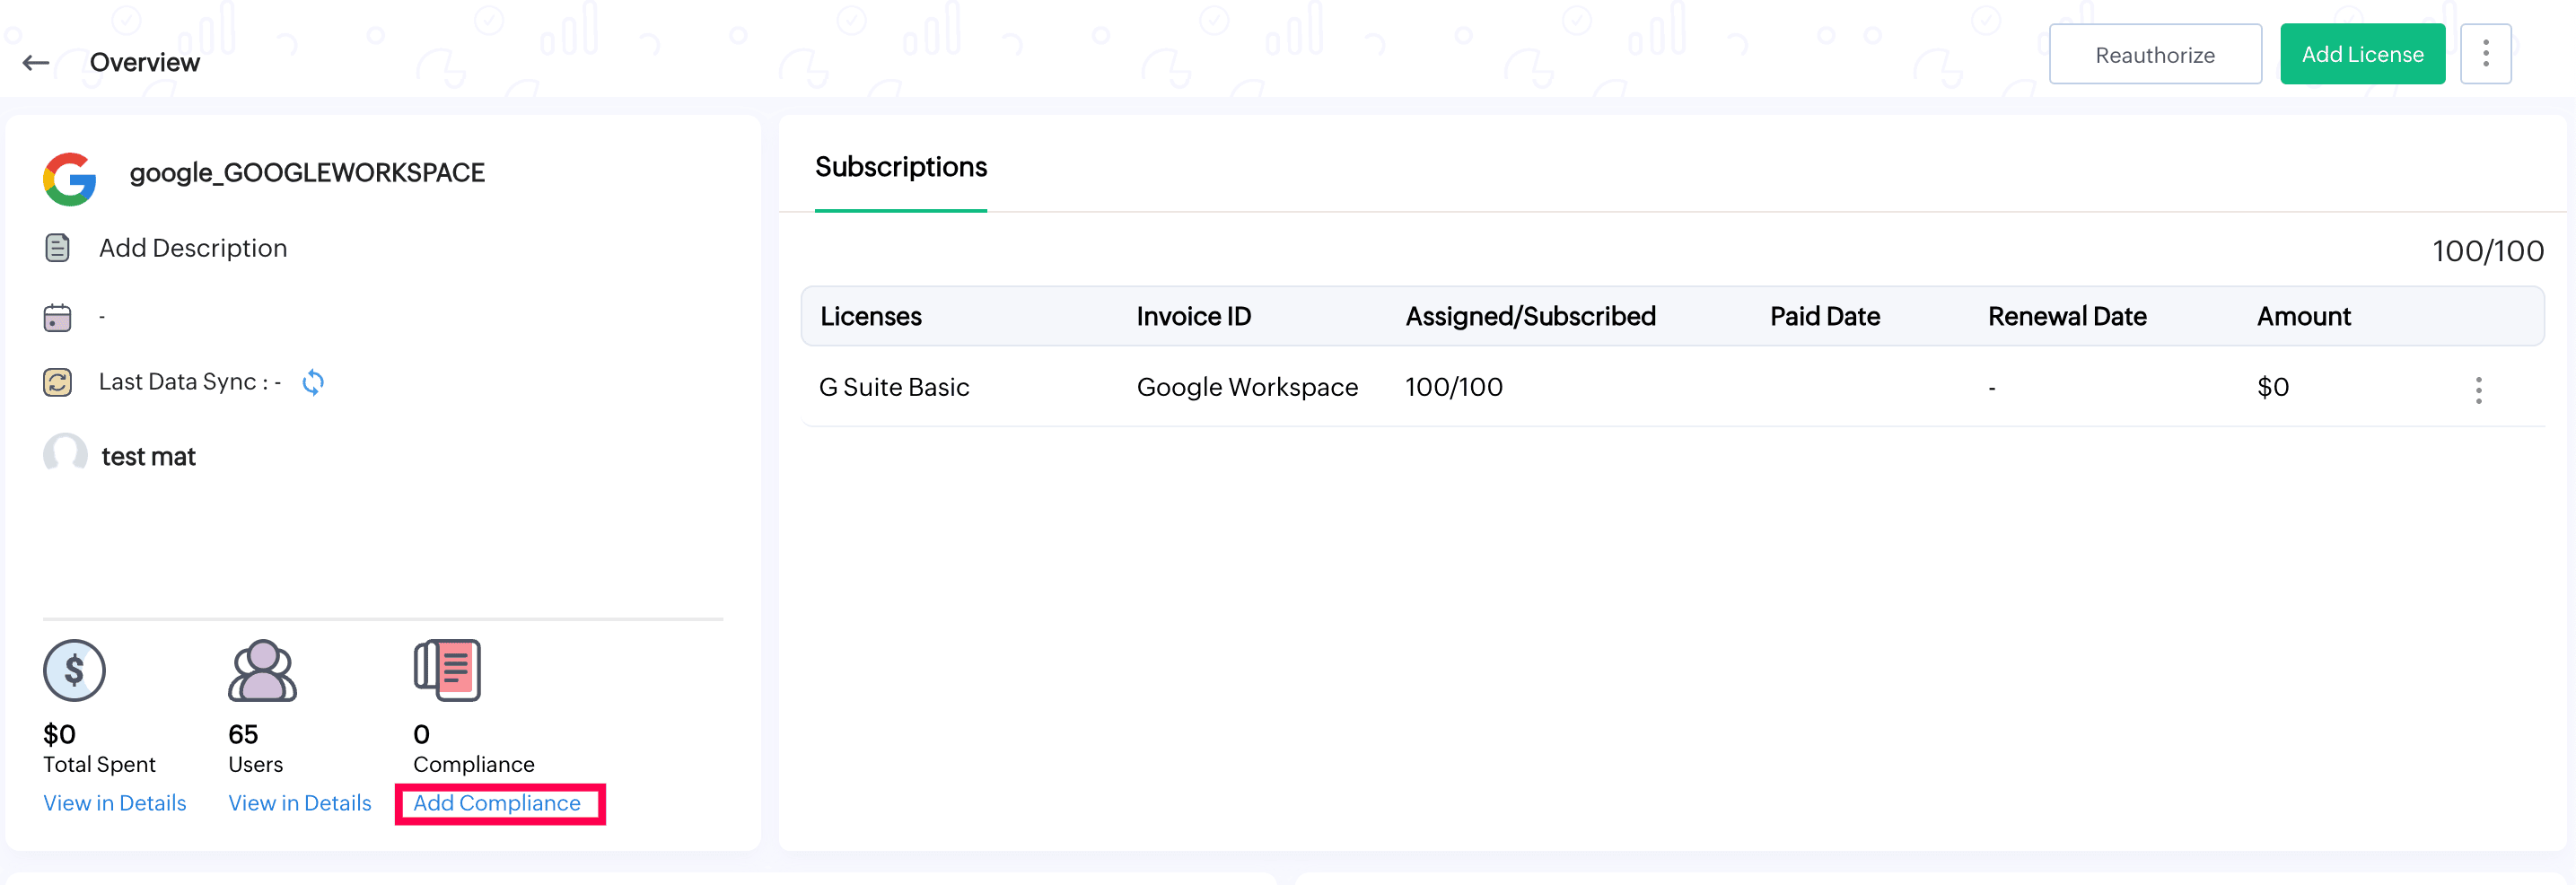
- Upload the required compliance document.
NOTE - Supported file formats are PDF, DOC, and DOCX. The limit of the file size is 5 MB.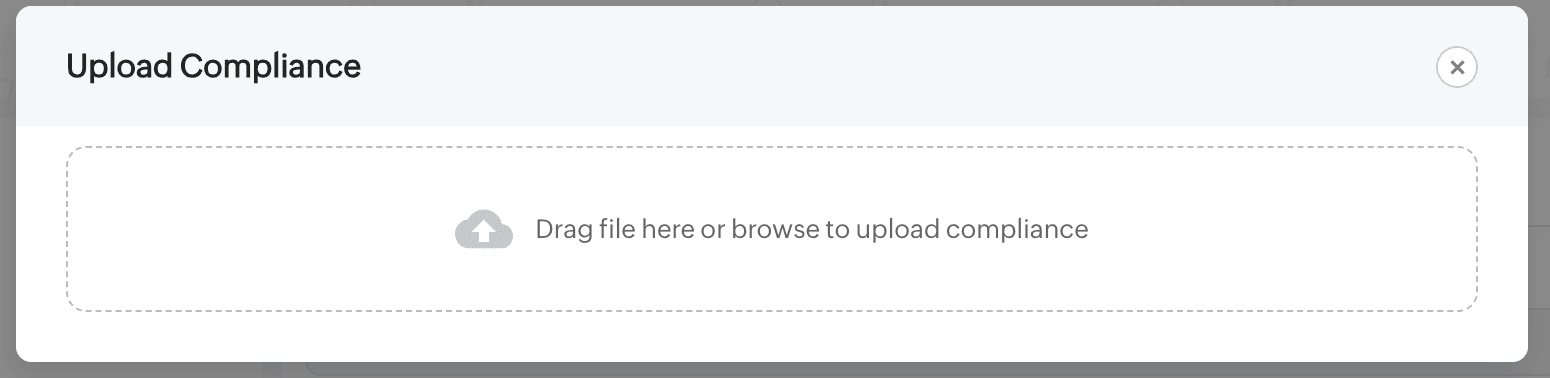
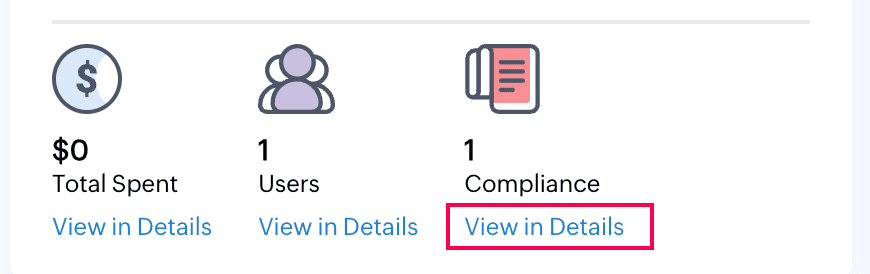
- After successfully uploading the file, you can view the file by clicking View in Details.
- You can download the existing document, or add a new document by clicking the Add button available at the top right corner.
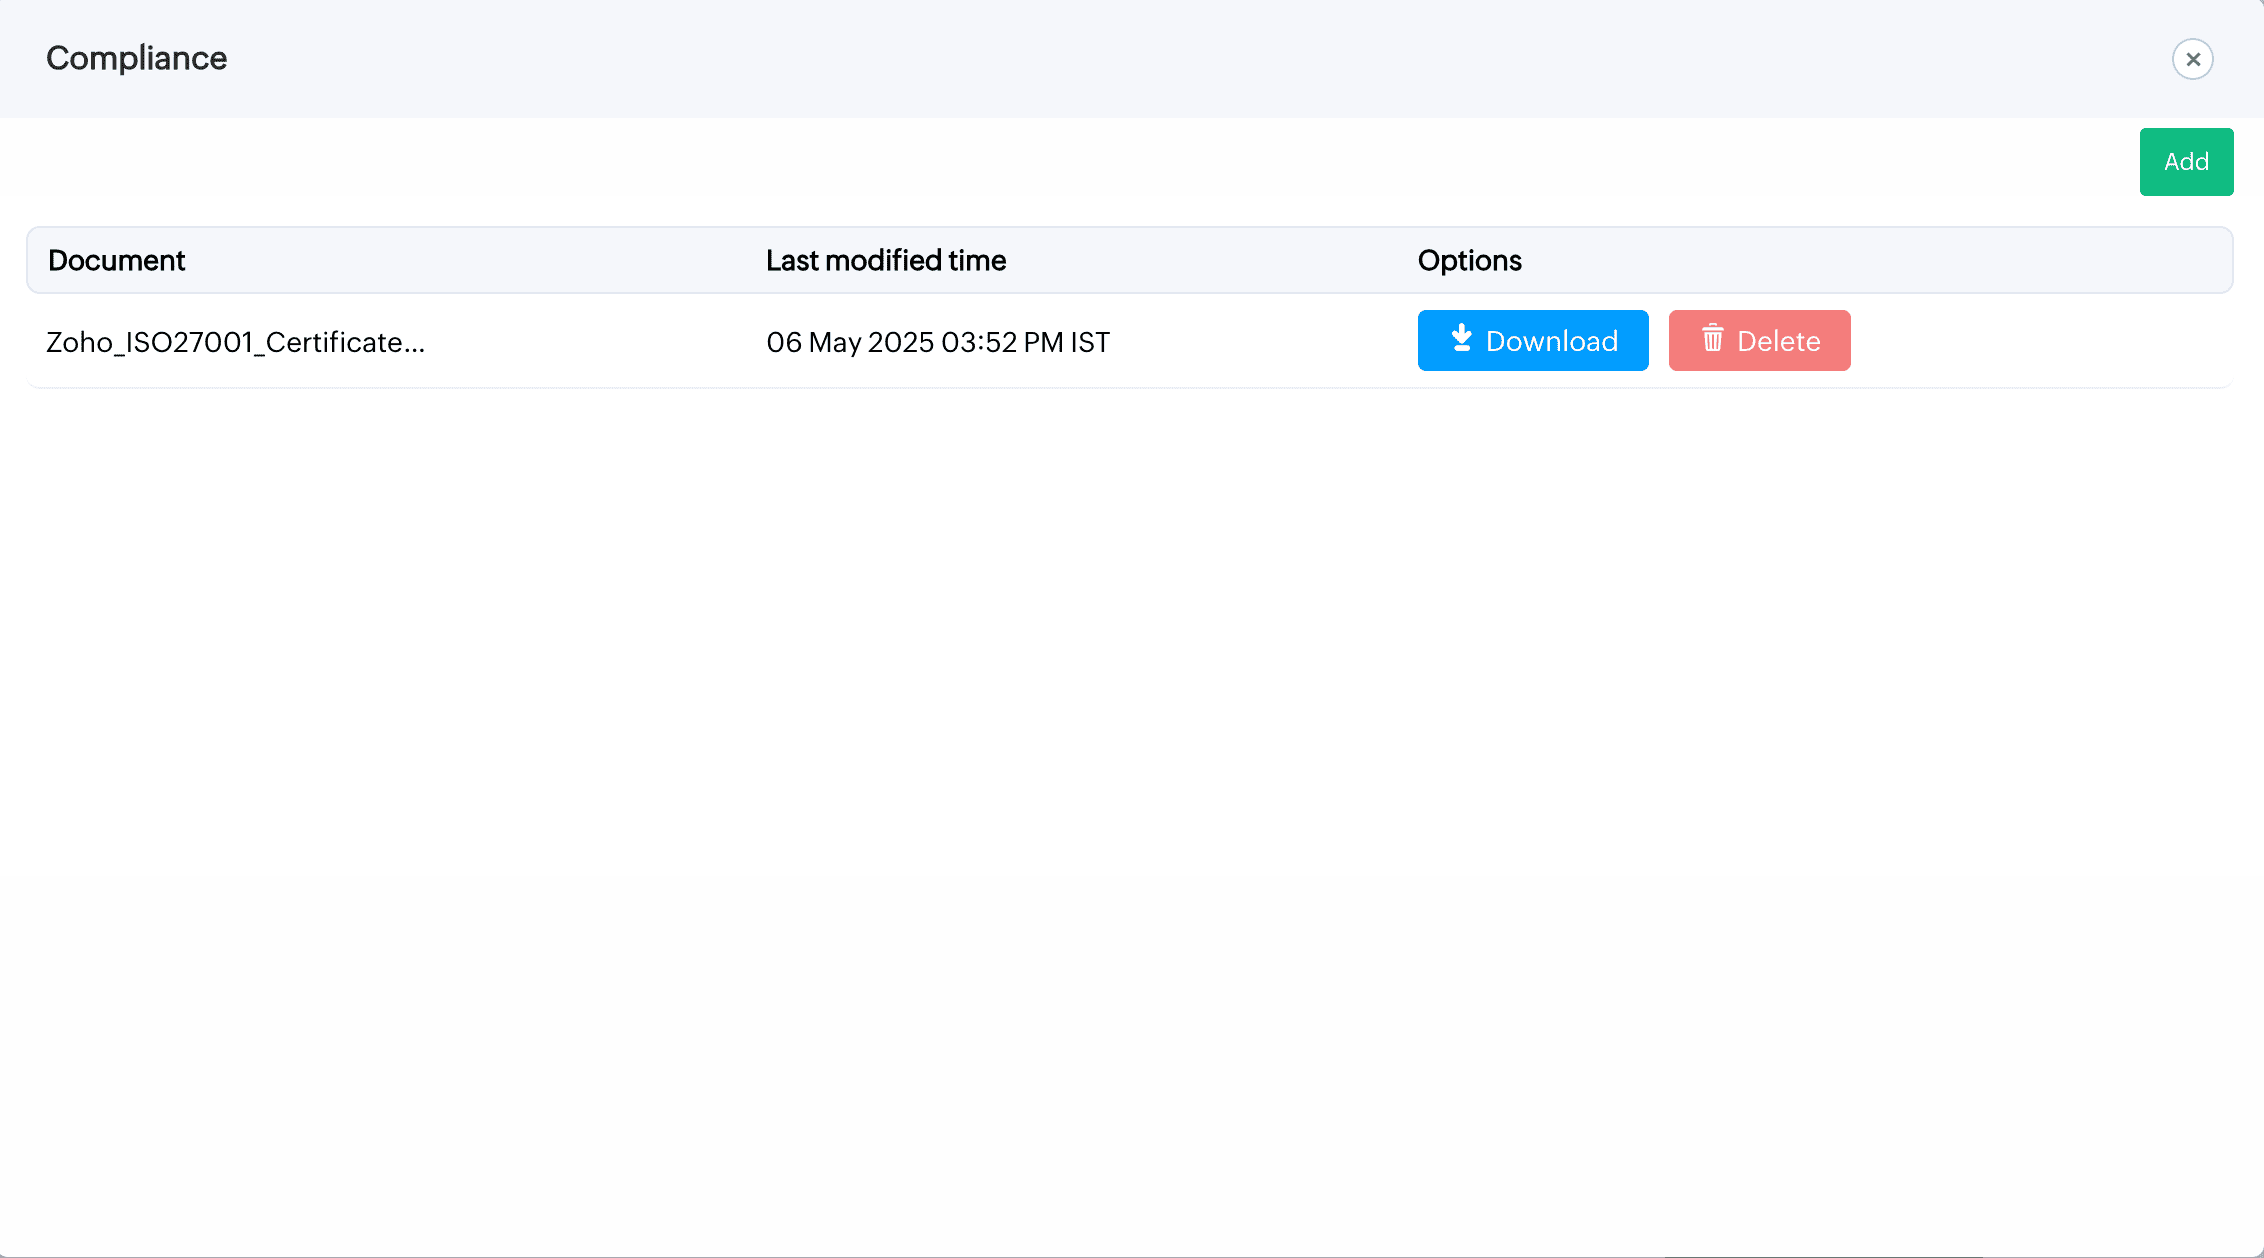
- Click Delete to delete an existing document.
Enabling/disabling license synchronization
To enable/disable license sync
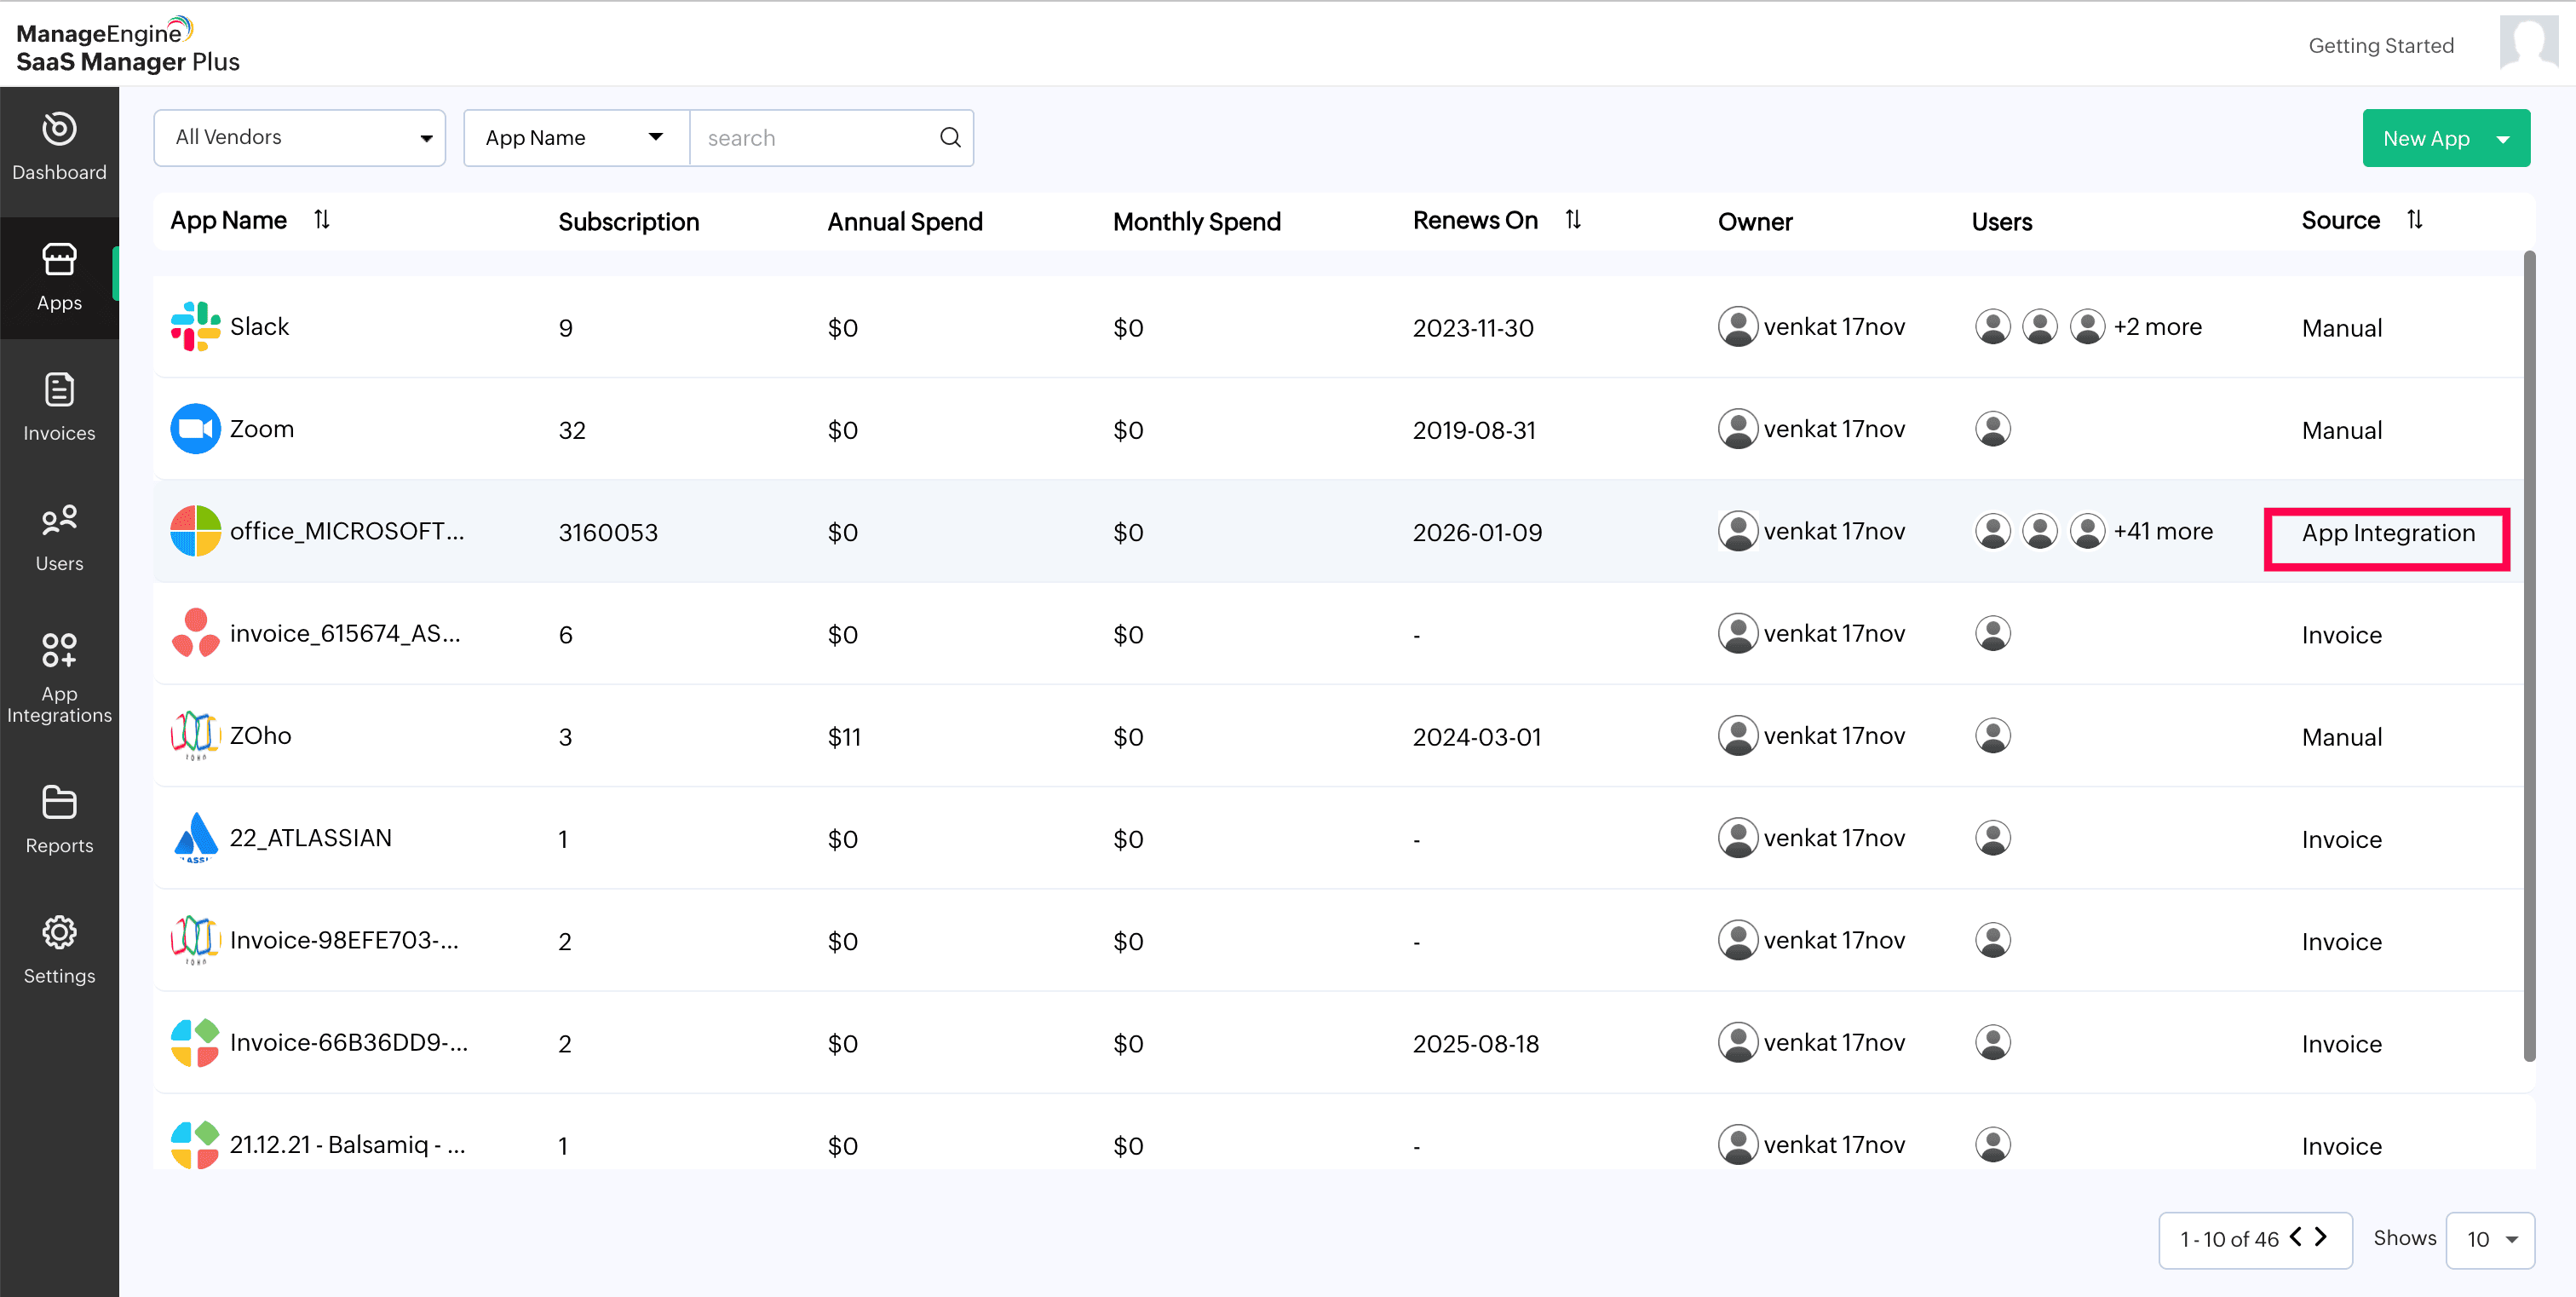
NOTE: This feature is available only for the licenses integrated via the App integration method.
- Select any integrated application from the list. (Make sure the Source is App Integration)
- Under Subscriptions, click the kebab menu available in the right corner and select Edit or Delete.
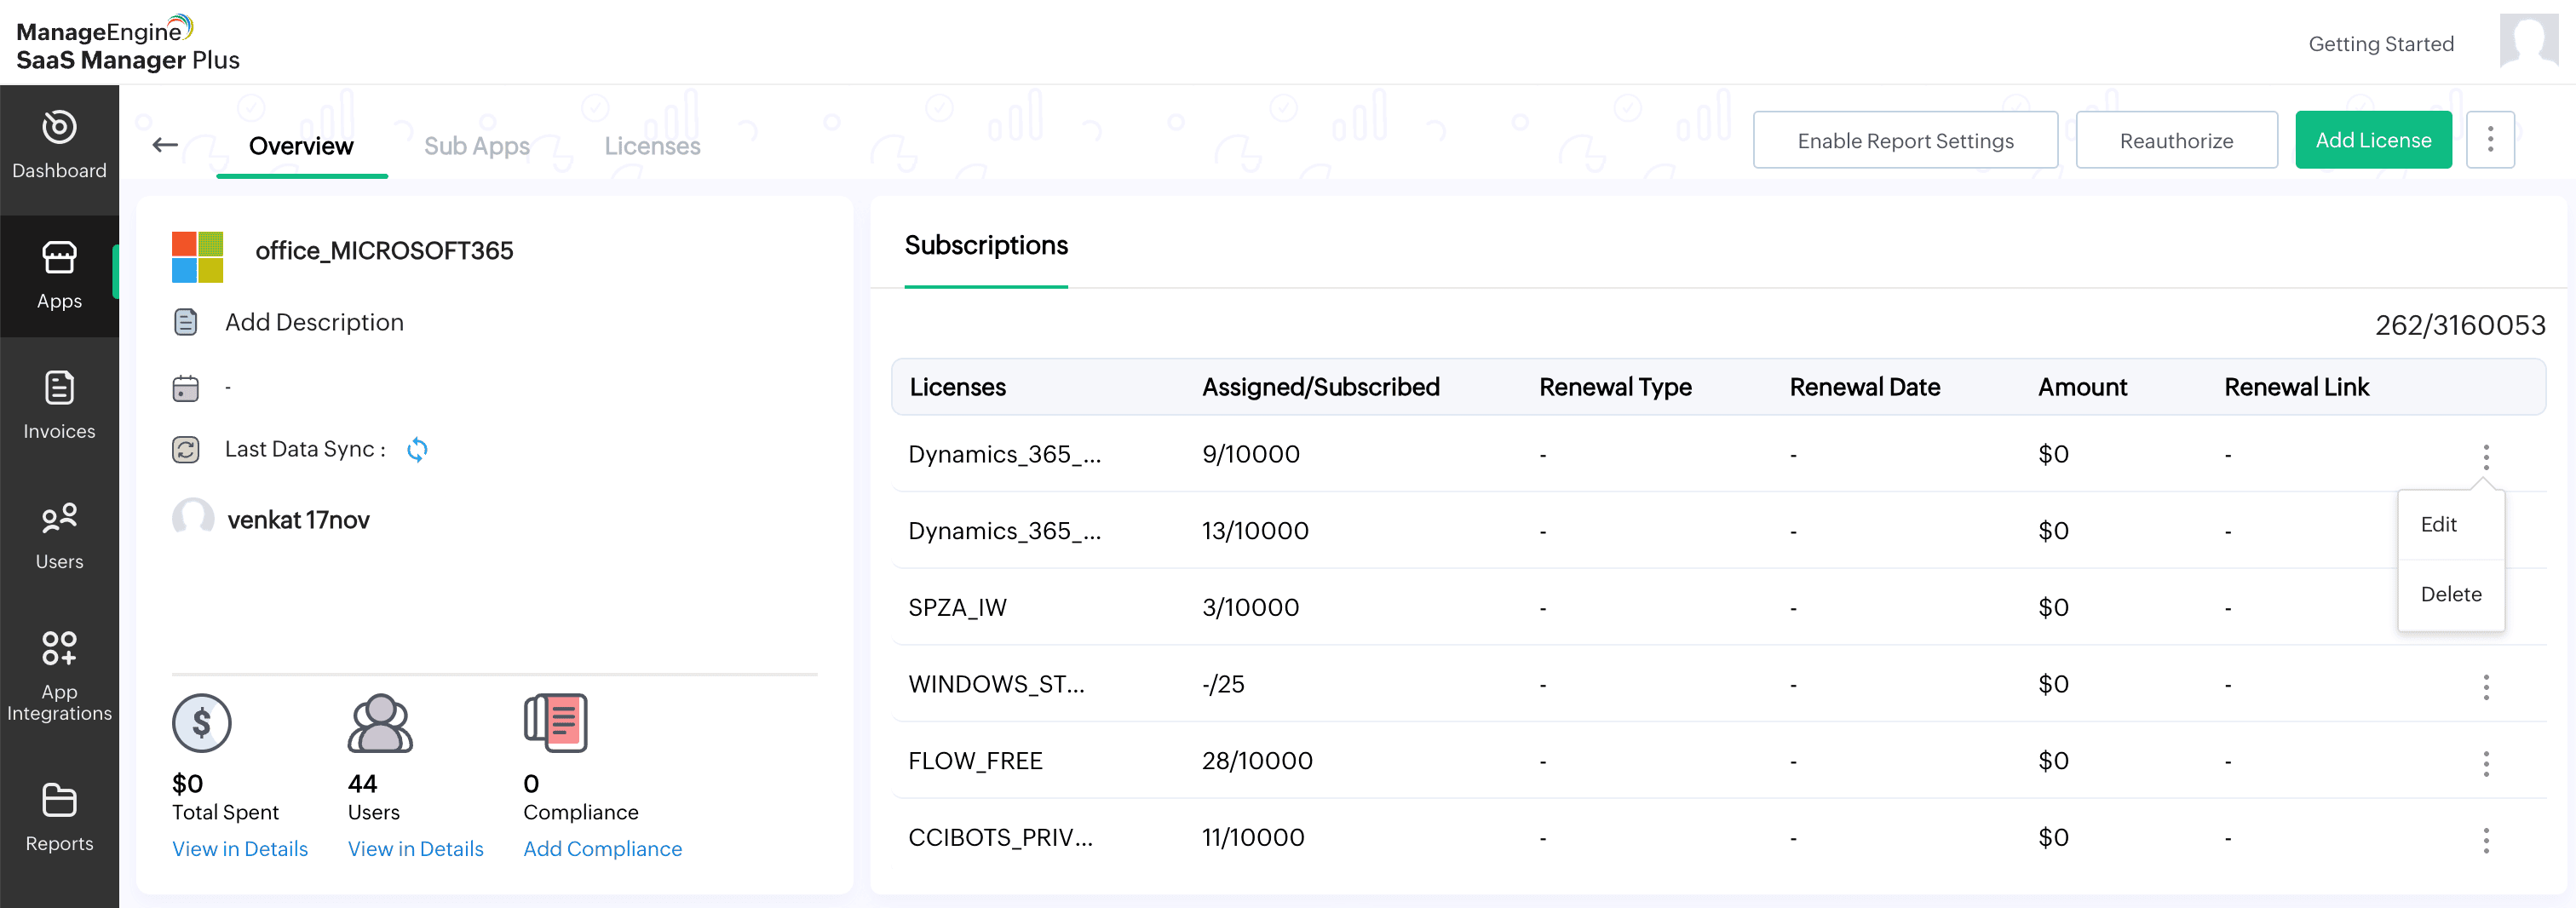
- If Edit is selected, a pop-up window appears, fill in the required details and select the checkbox at the bottom to disable license synchronization.
NOTE: Don't select the checkbox if you want the license synchronization to occur periodically.
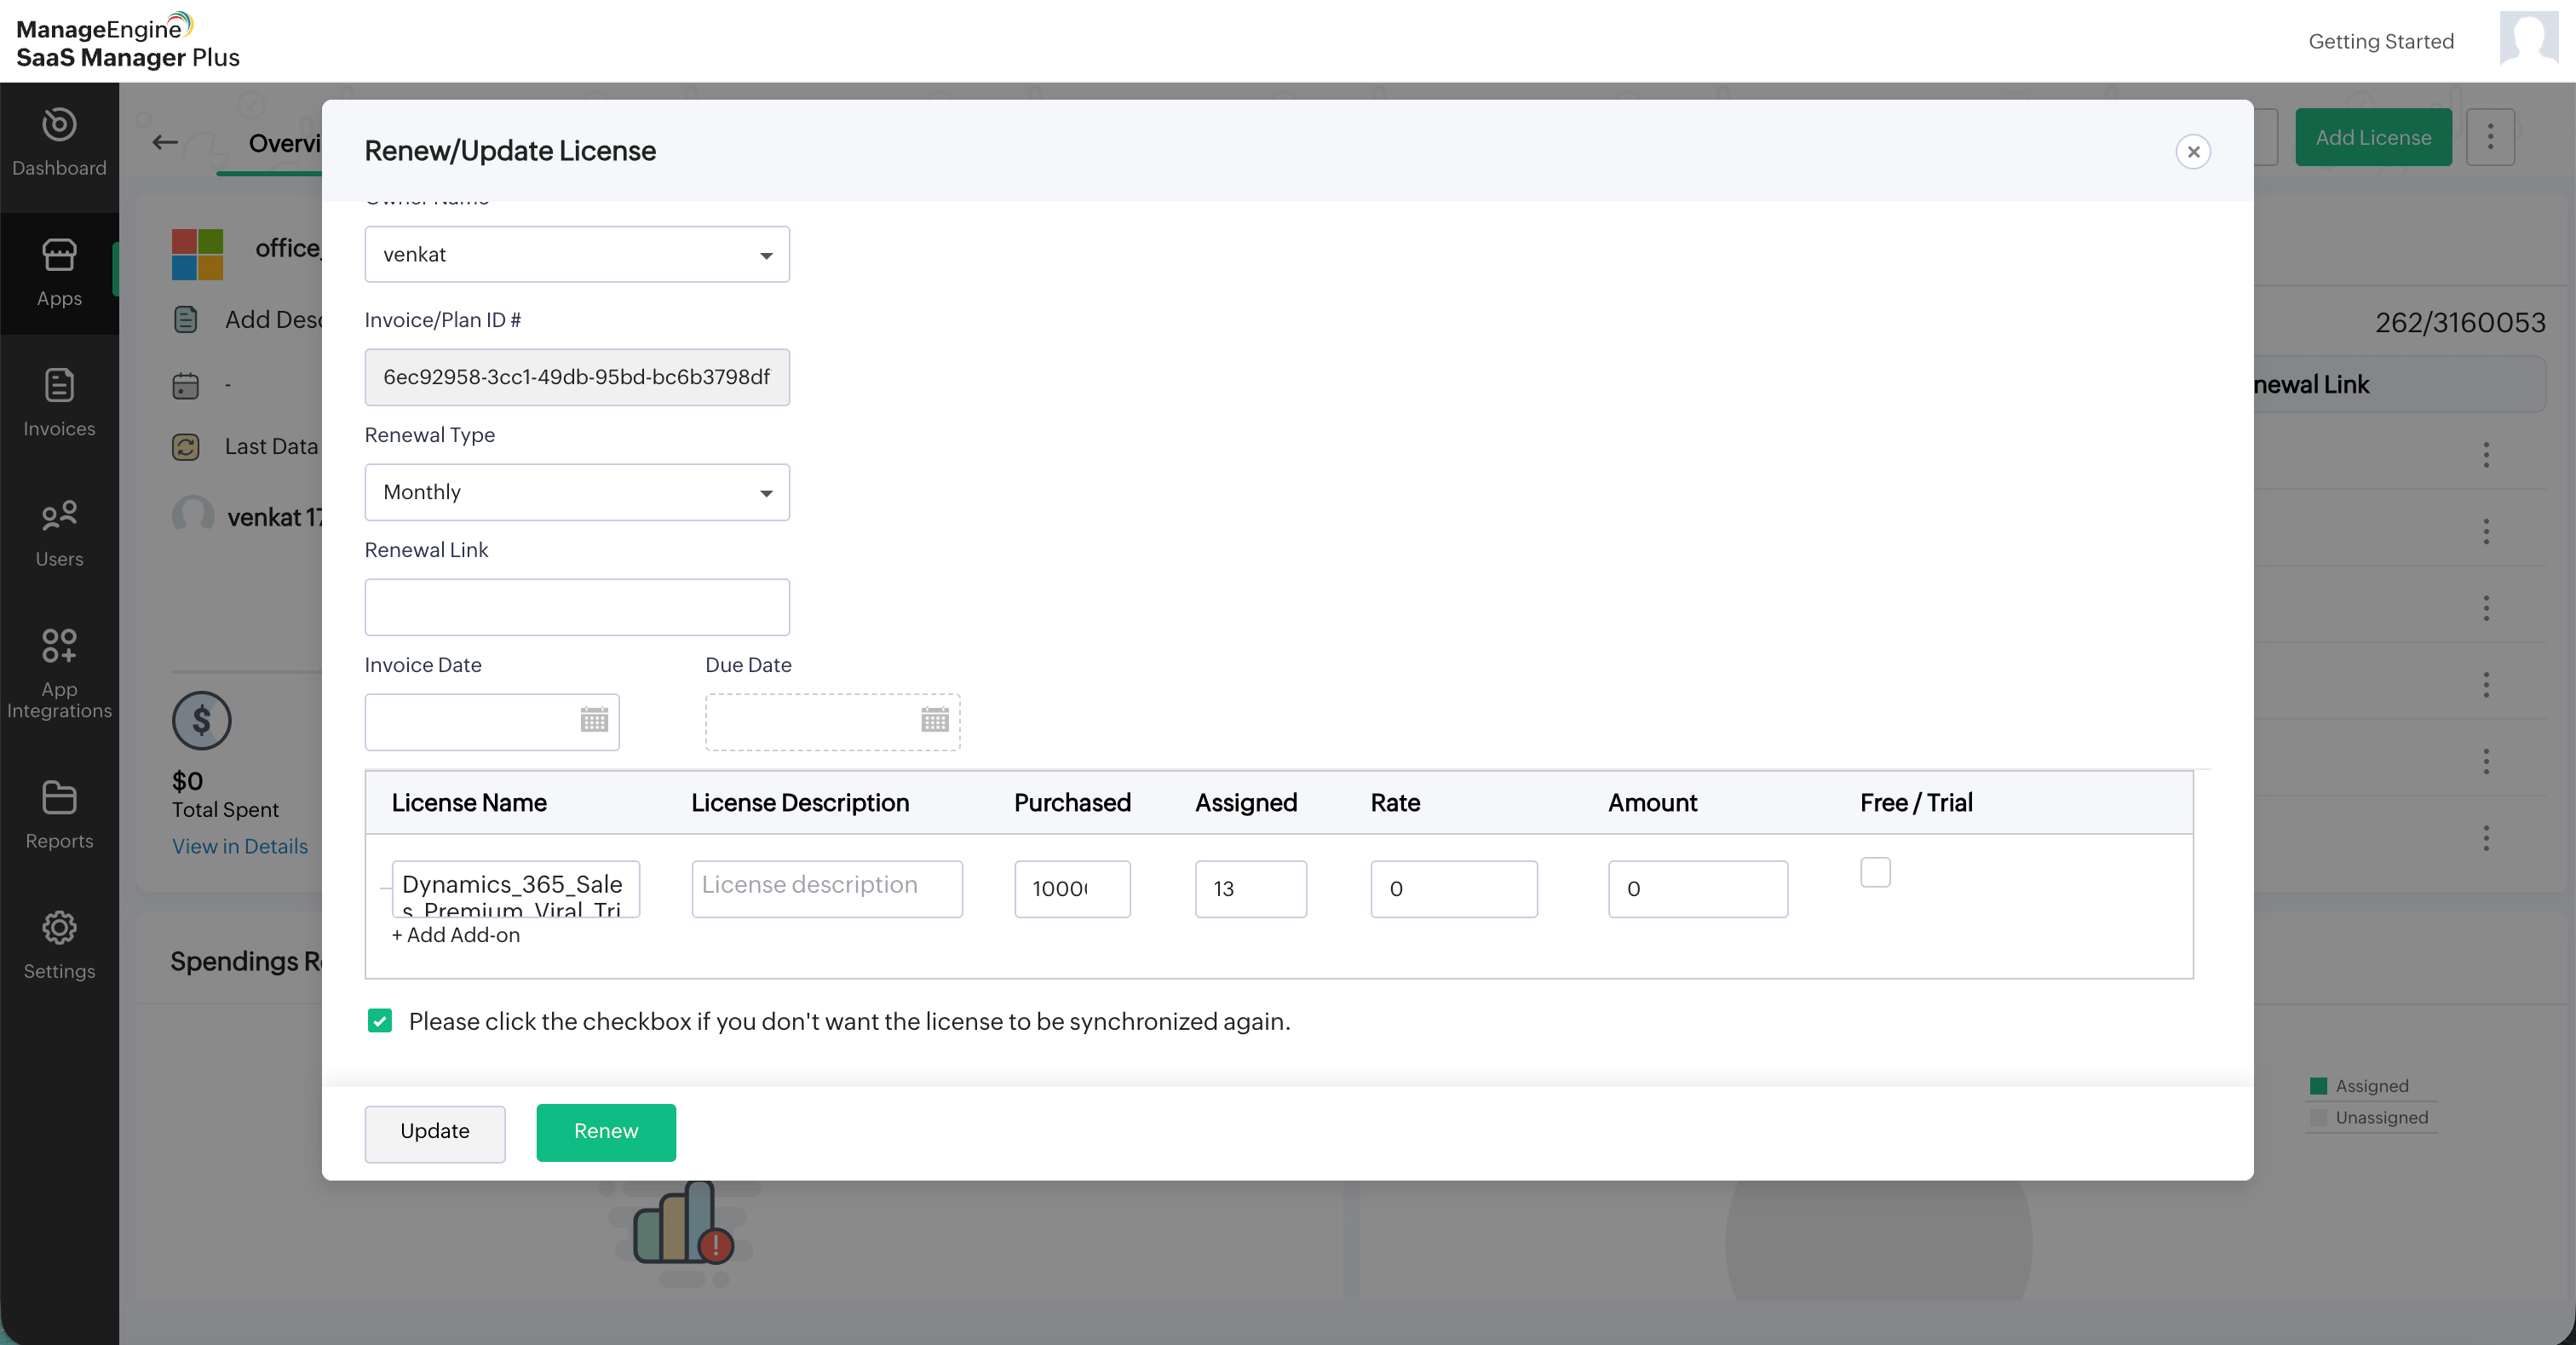
- Click Update and the license will be updated with the new details successfully.
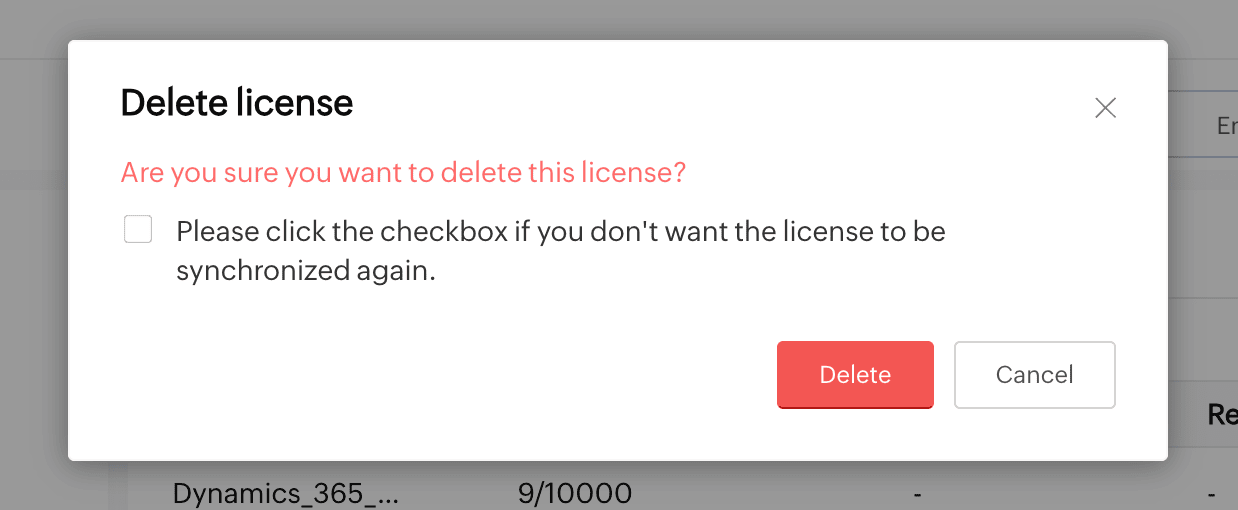
- If Delete is selected, a pop-up window appears. Select the checkbox at the bottom to disable license synchronization.
- Click Delete and the license will be deleted and will not be synced again.
To view AI usage
Viewing Claude usage
To view Claude usage
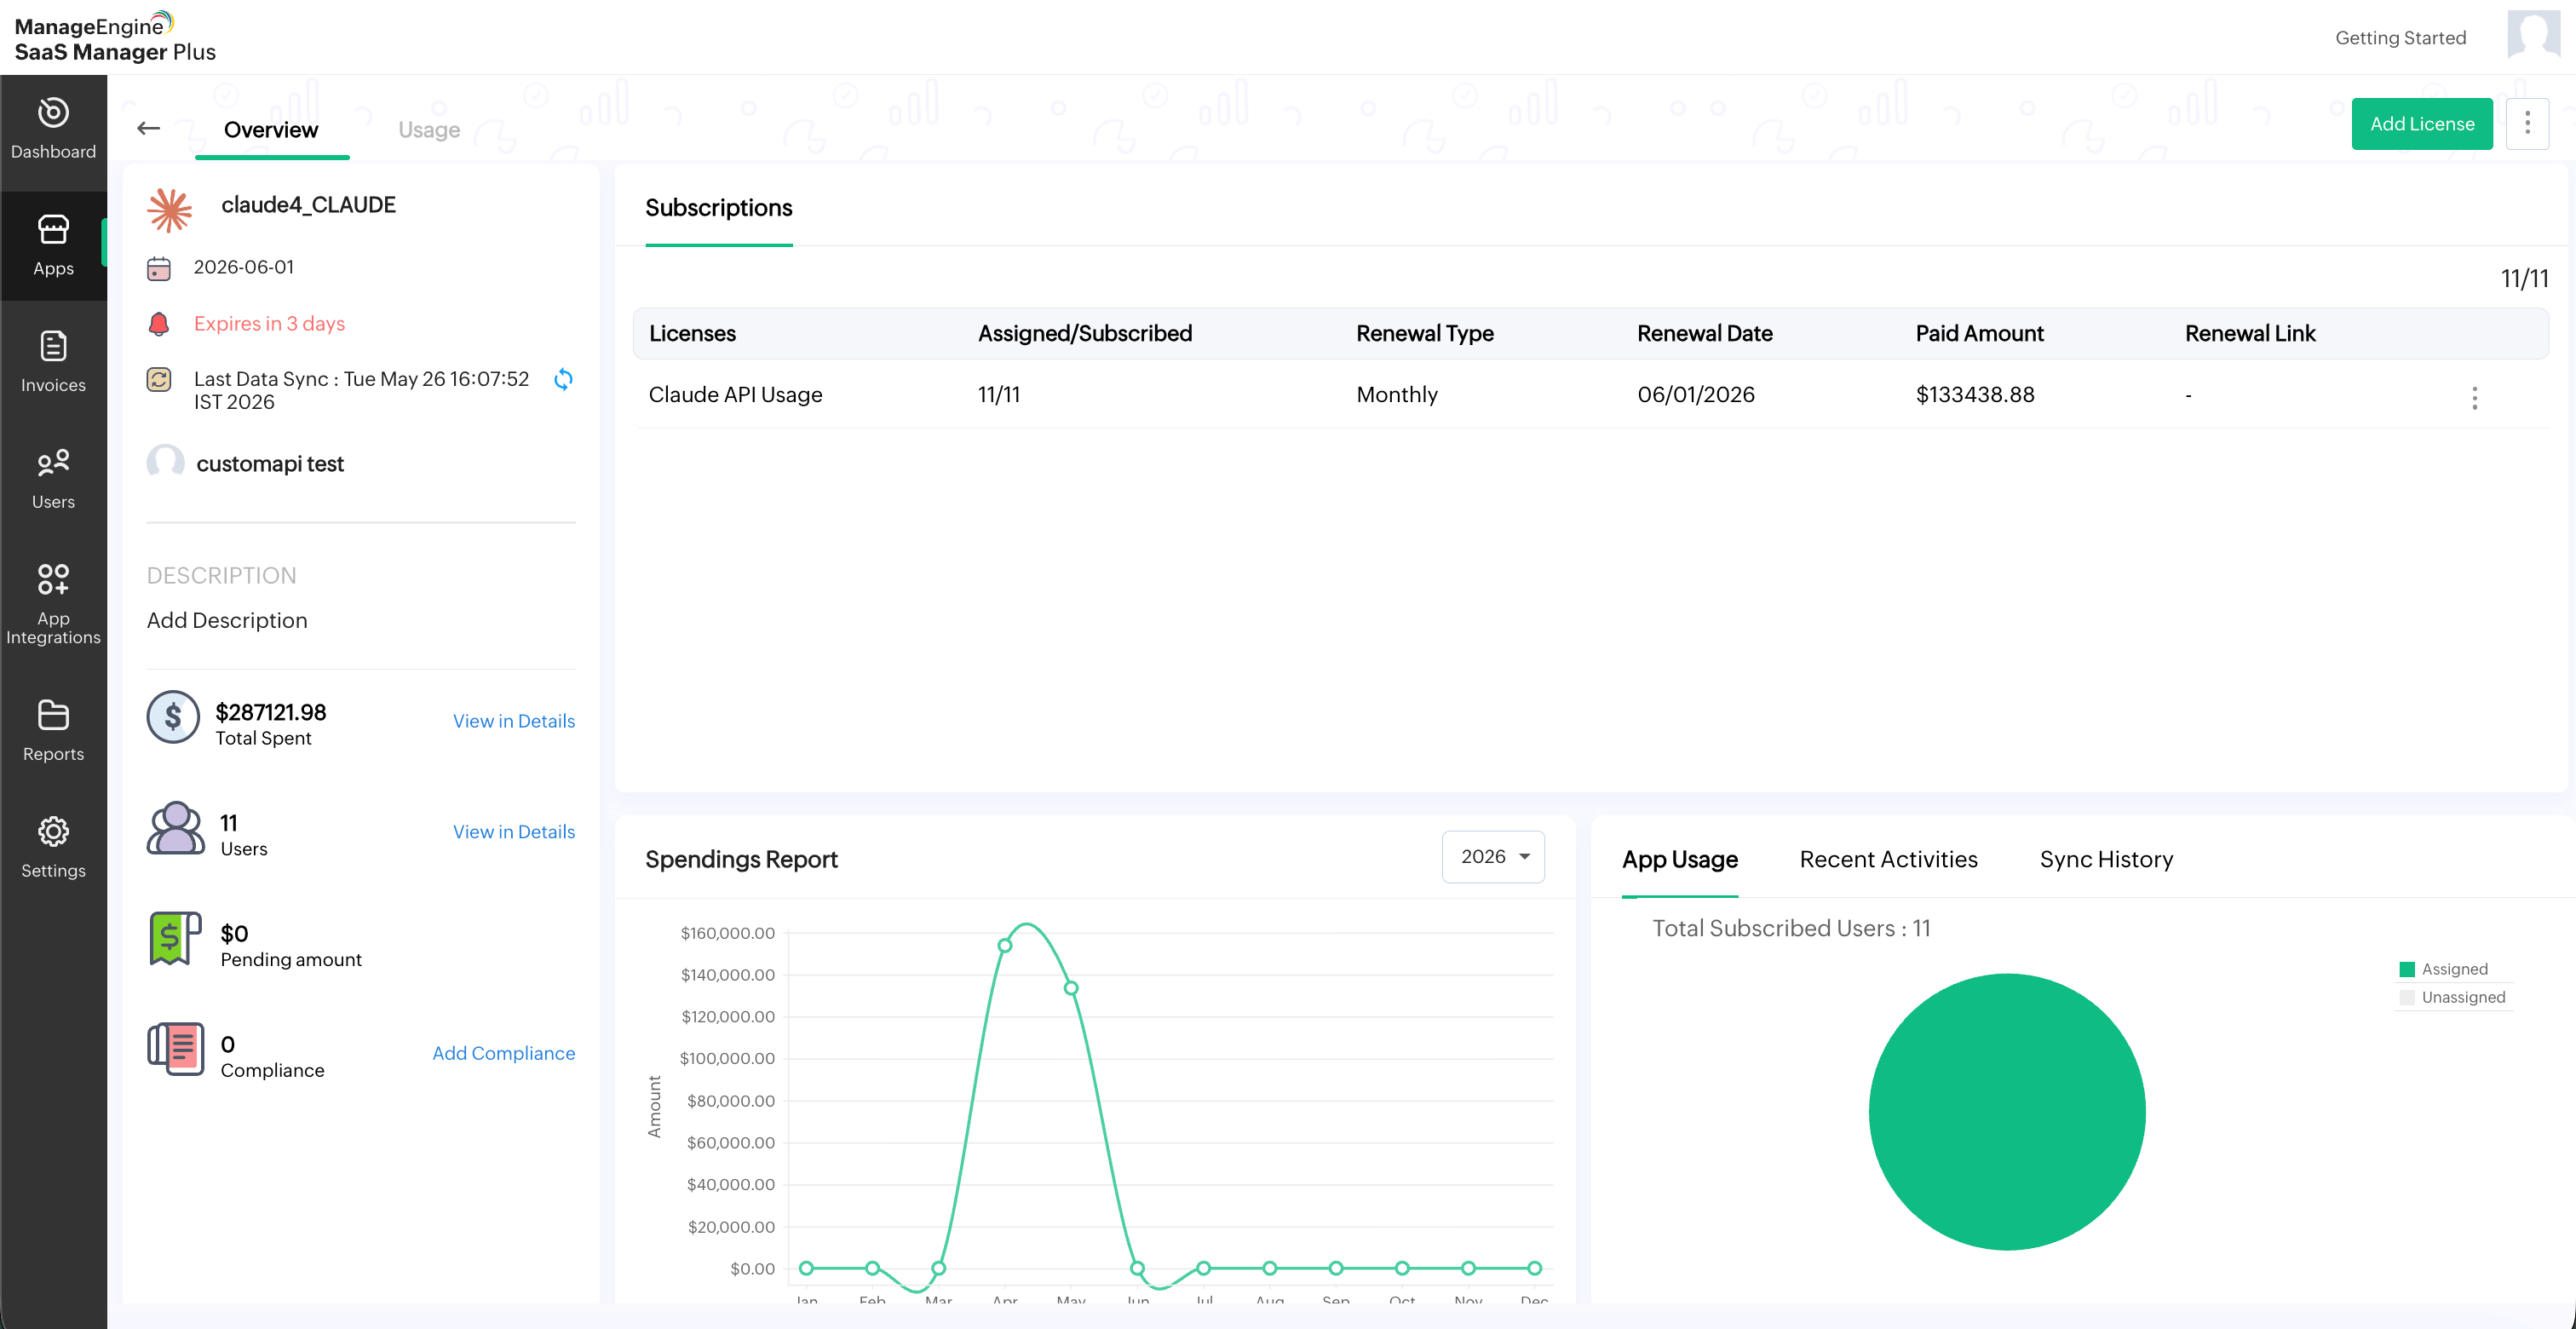
- Select the Claude app from the list.
- Click the Usage tab available next to Overview.
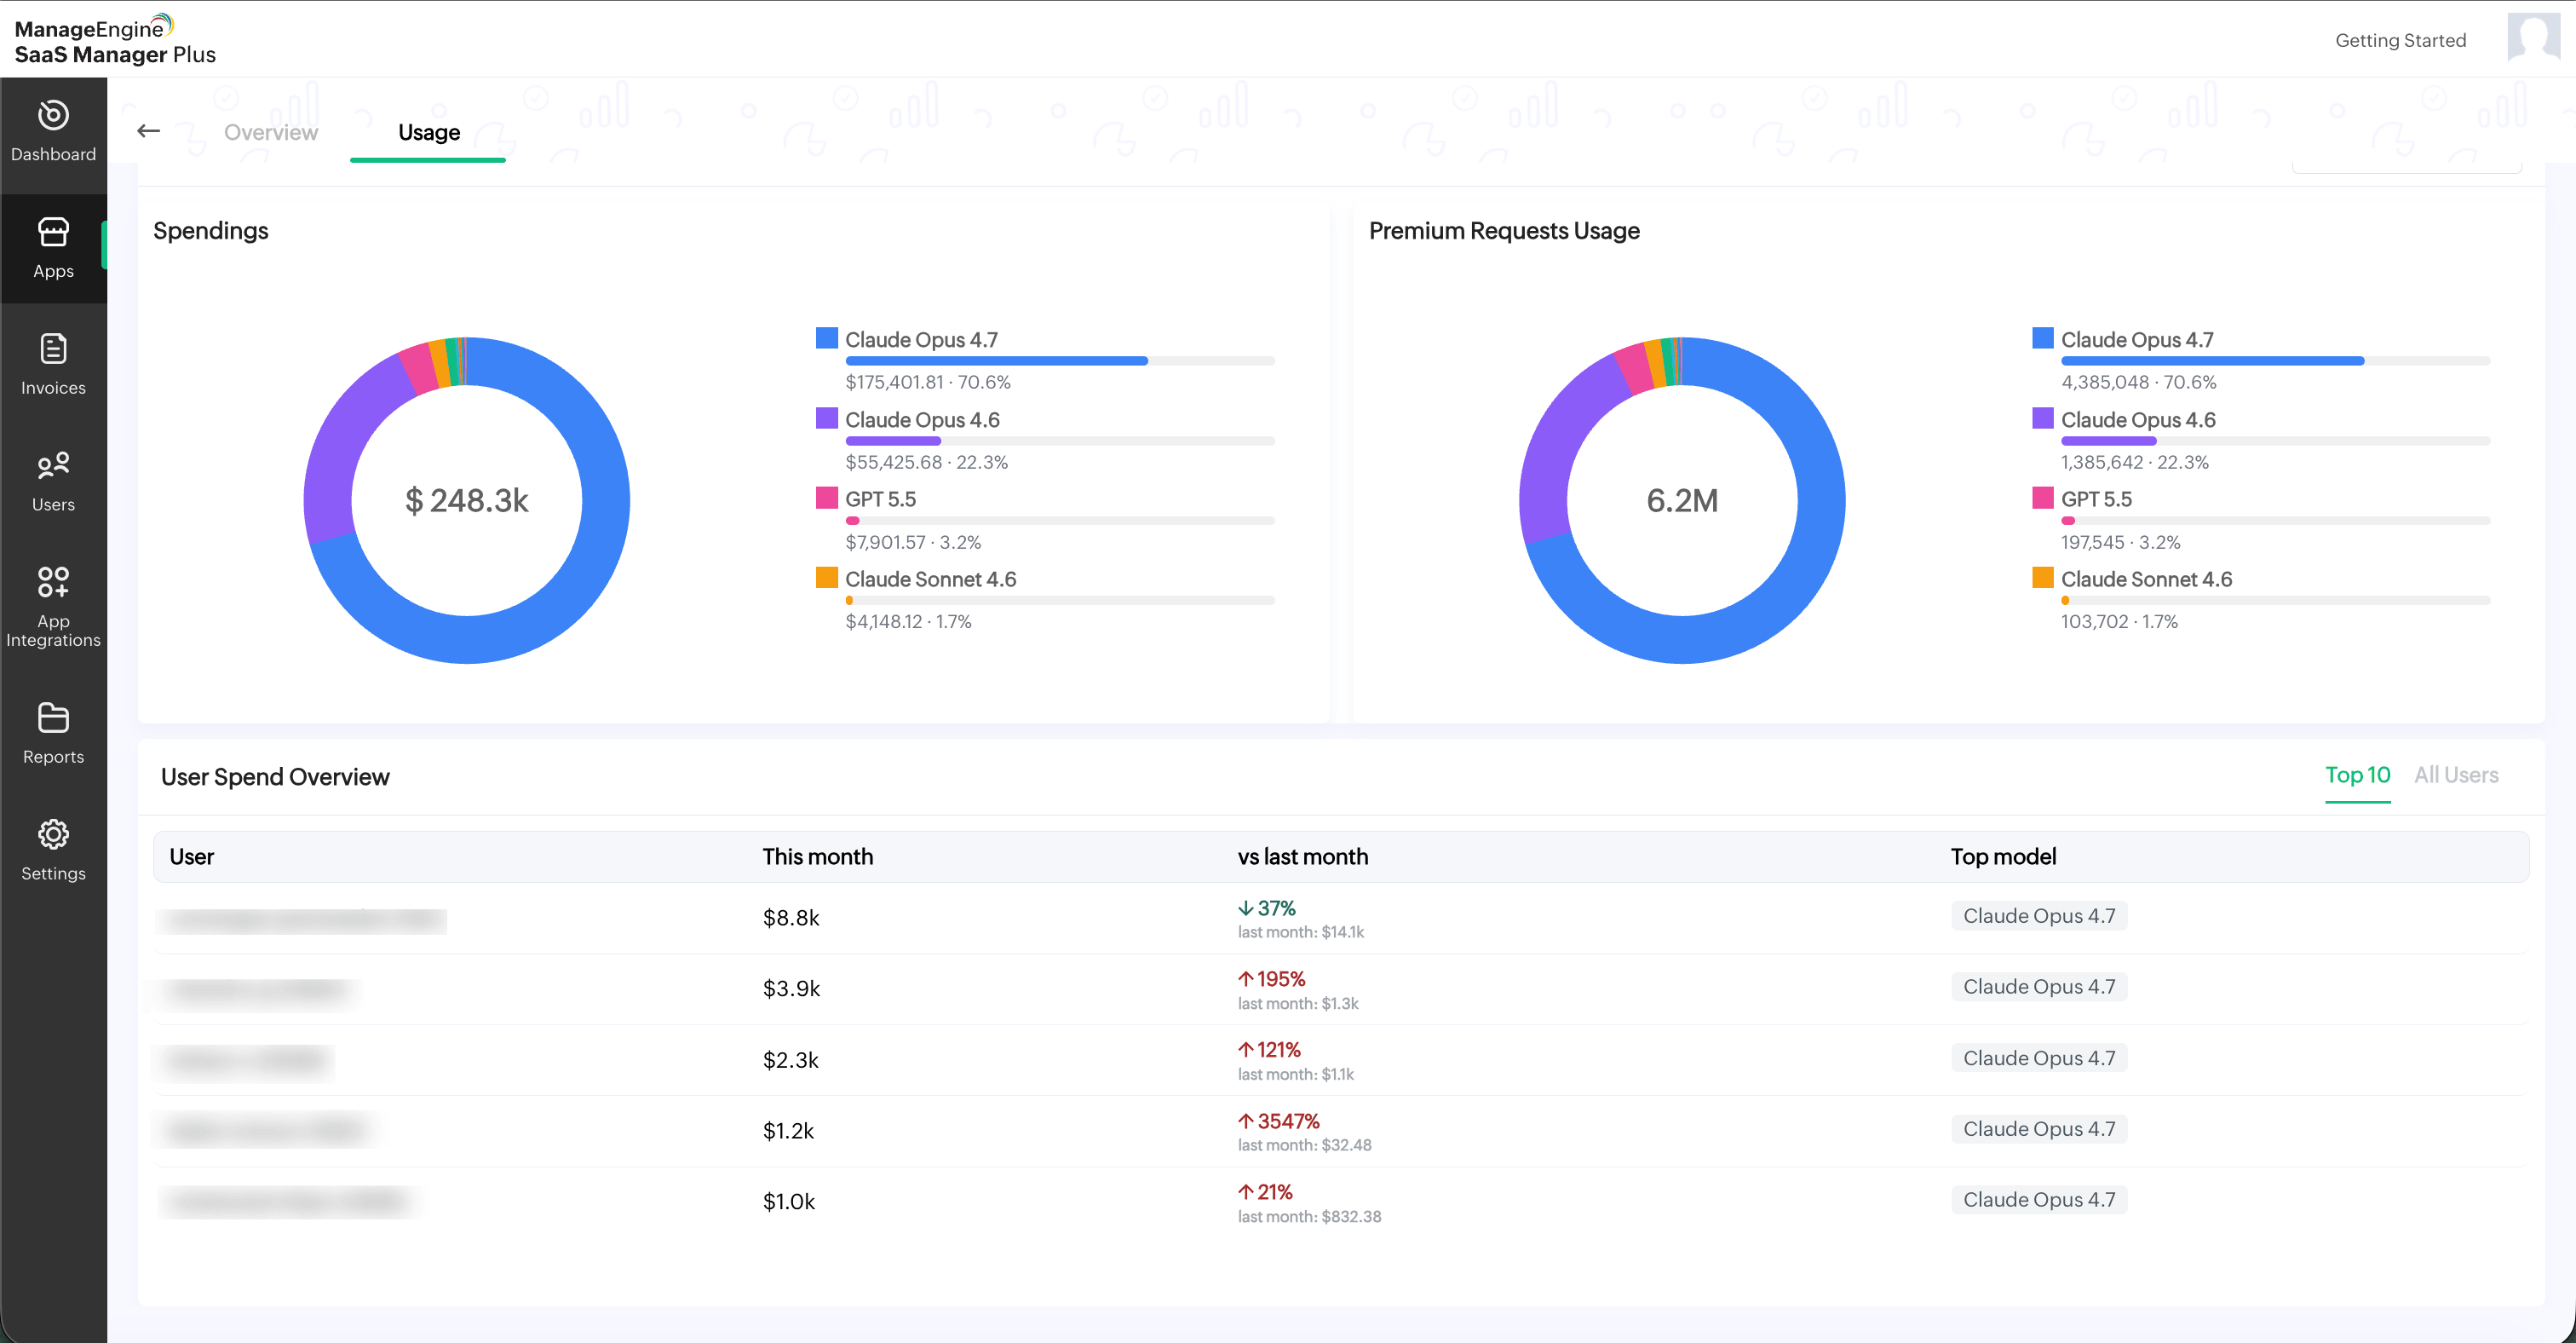
- The Usage tab provides a detailed view of Claude usage, spending, token consumption, and model-level activity for the selected period.
The top summary cards display the following details:
- Spend: Shows the total Claude spend for the current month.
- Avg Daily Spend: Shows the average daily spend for the current month.
- Tokens: Shows the total number of tokens used for the current month.
- Top Model: Displays the Claude model with the highest usage or spend for the current month.
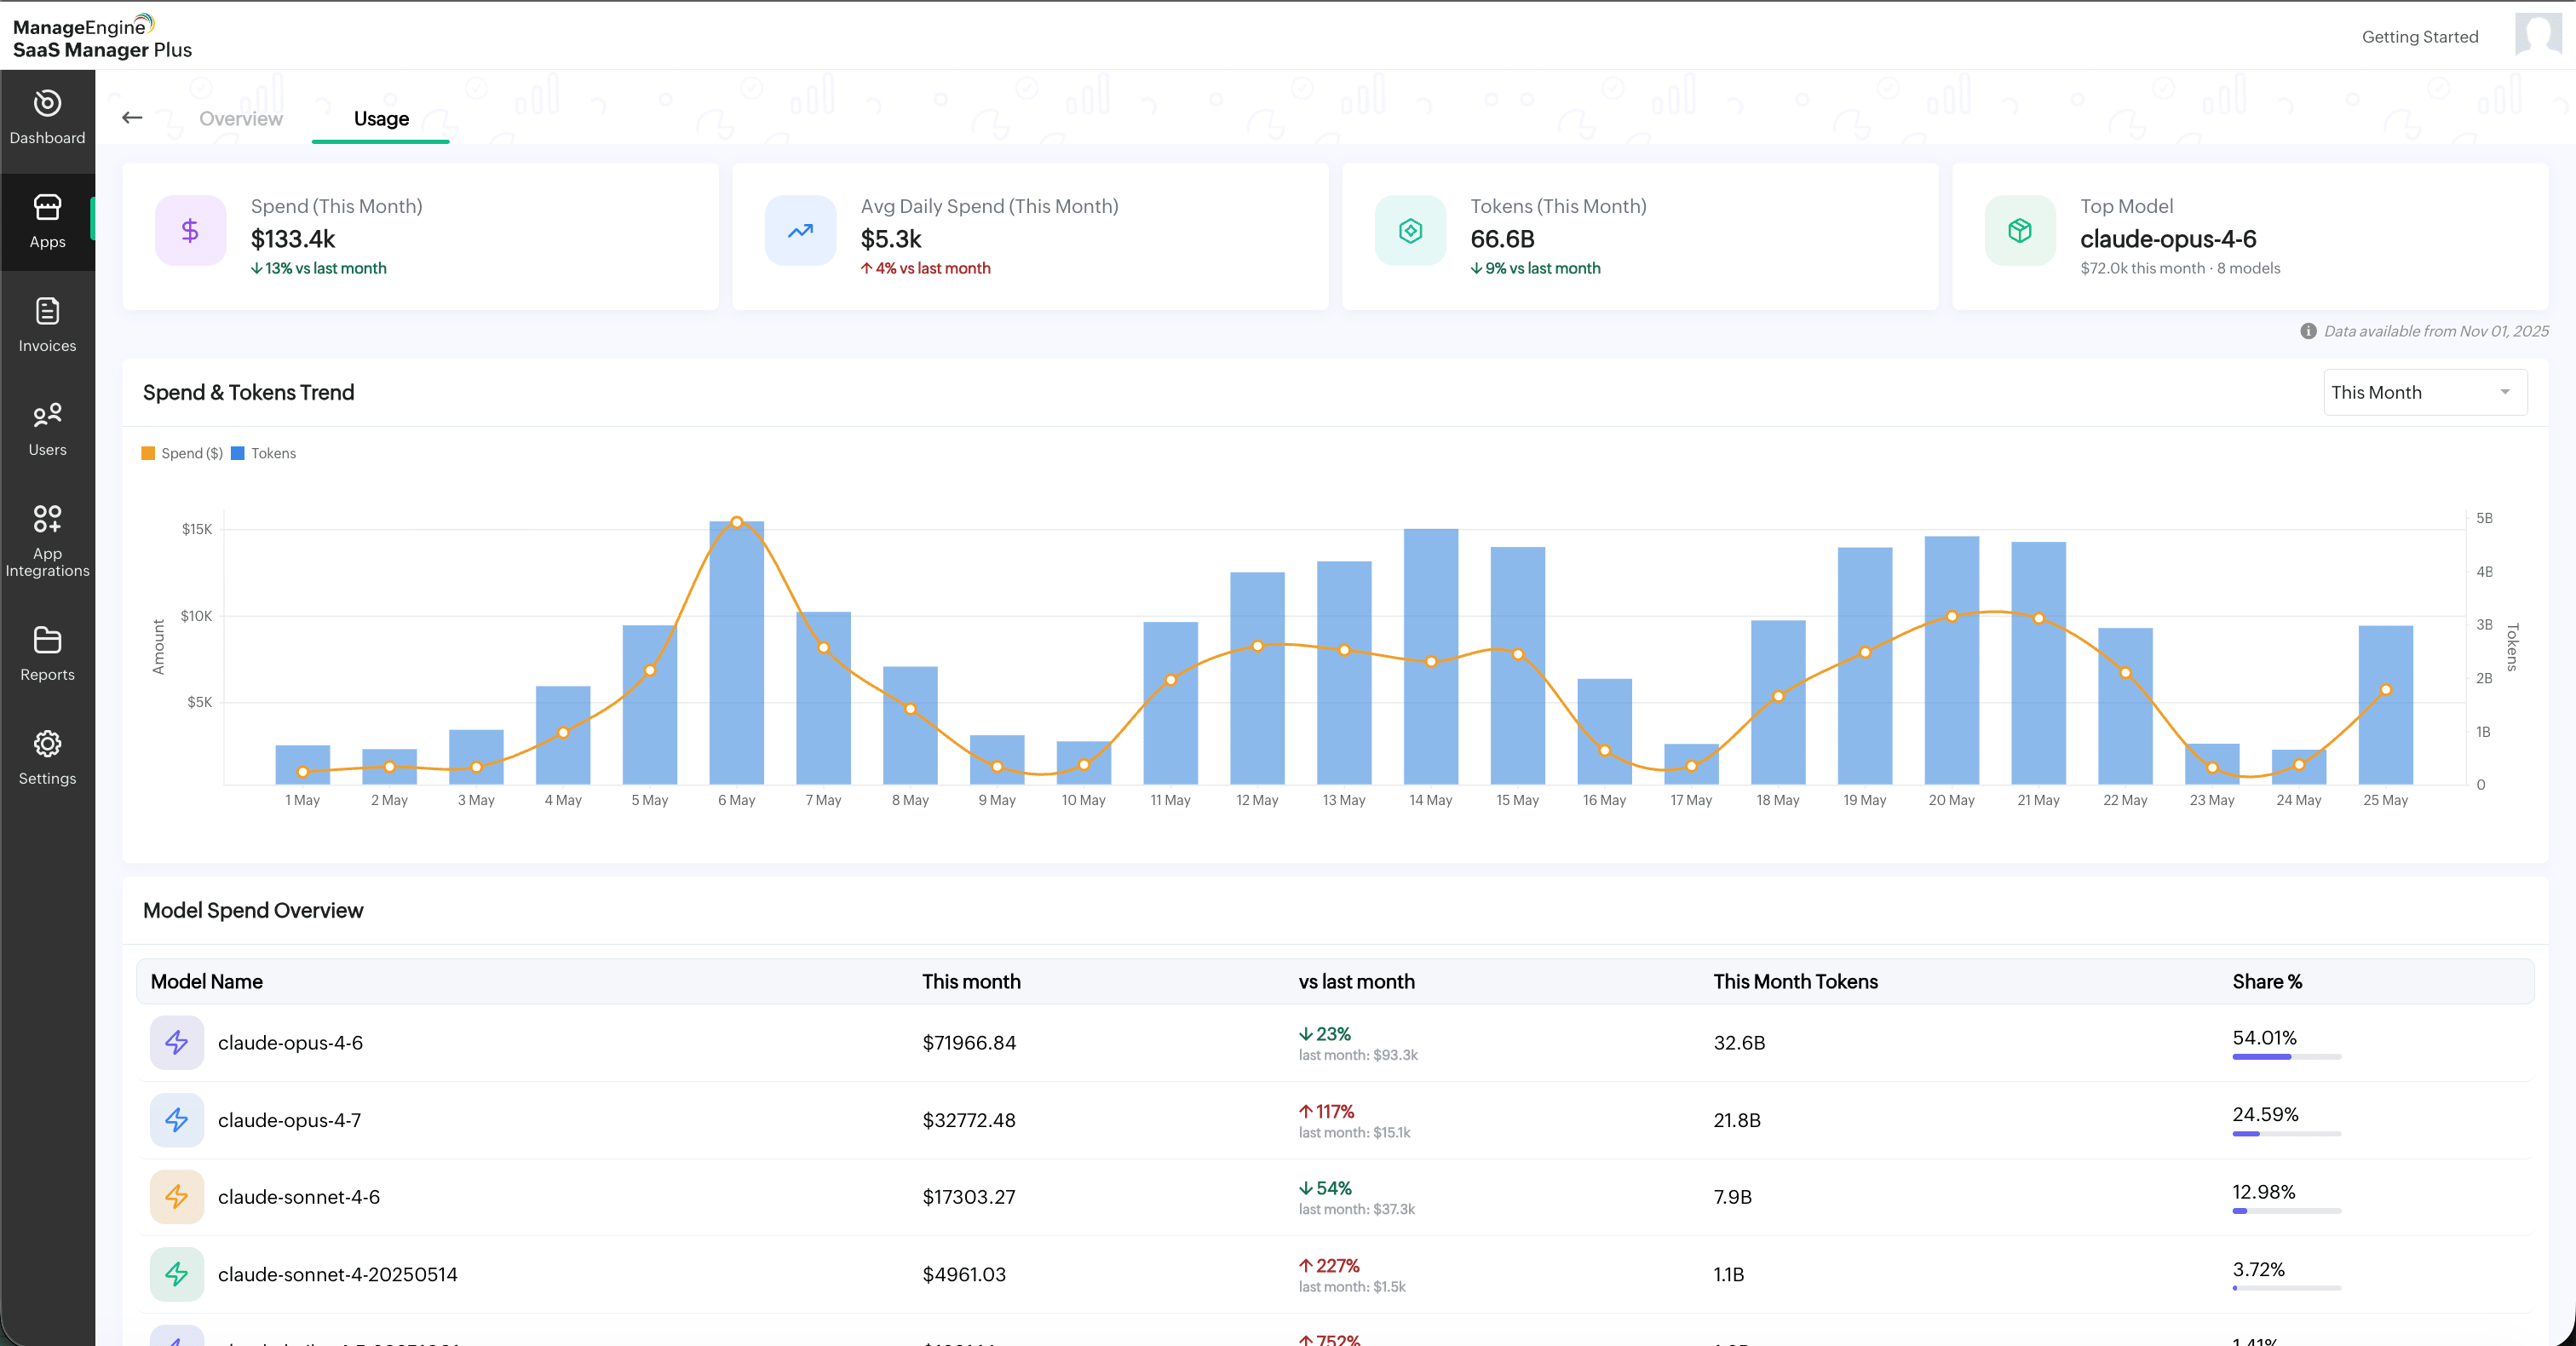
A Data available from date is displayed below the summary cards to indicate the starting date from which usage data is available.
The Spend & Tokens Trend chart displays the spend and token usage trend over time. Use the time filter available in the top-right corner of the chart to view usage for a specific period, such as This Month.
The Model Spend Overview section displays model-wise usage details, including: Model Name, This month, vs last month, This Month Tokens, Share %
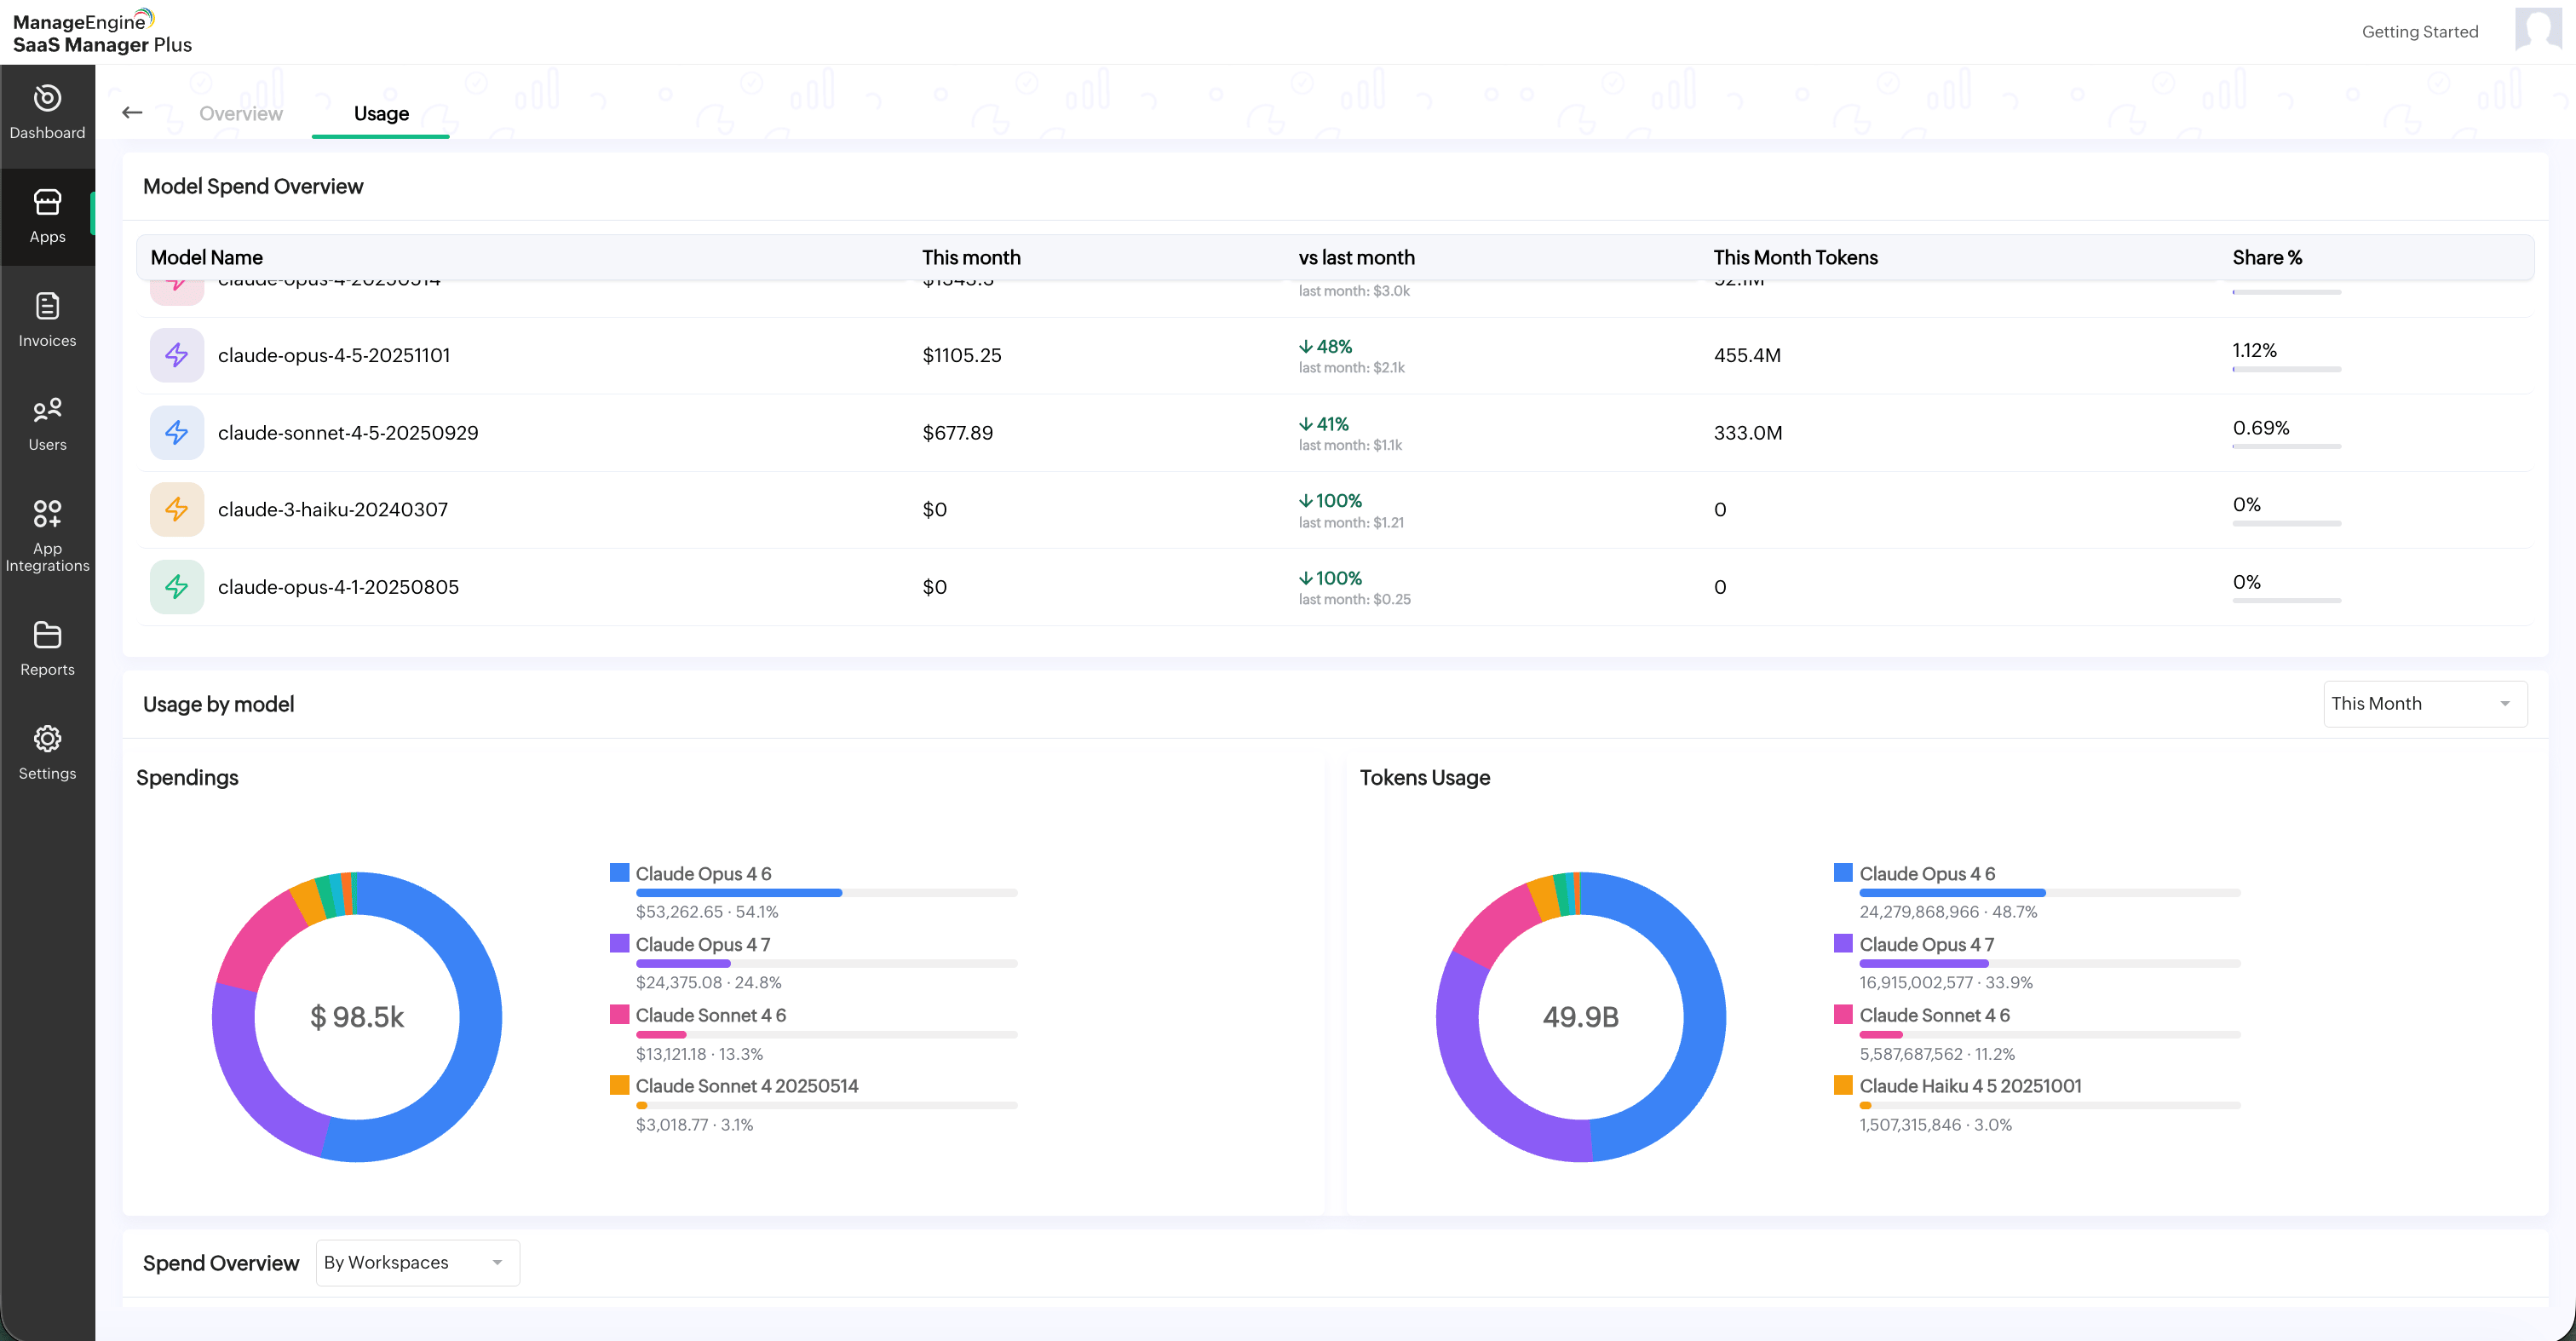
The Usage by model section provides a visual breakdown of Claude usage by model. It includes:
- Spendings: Displays the spend distribution across Claude models.
- Tokens Usage: Displays the token usage distribution across Claude models.
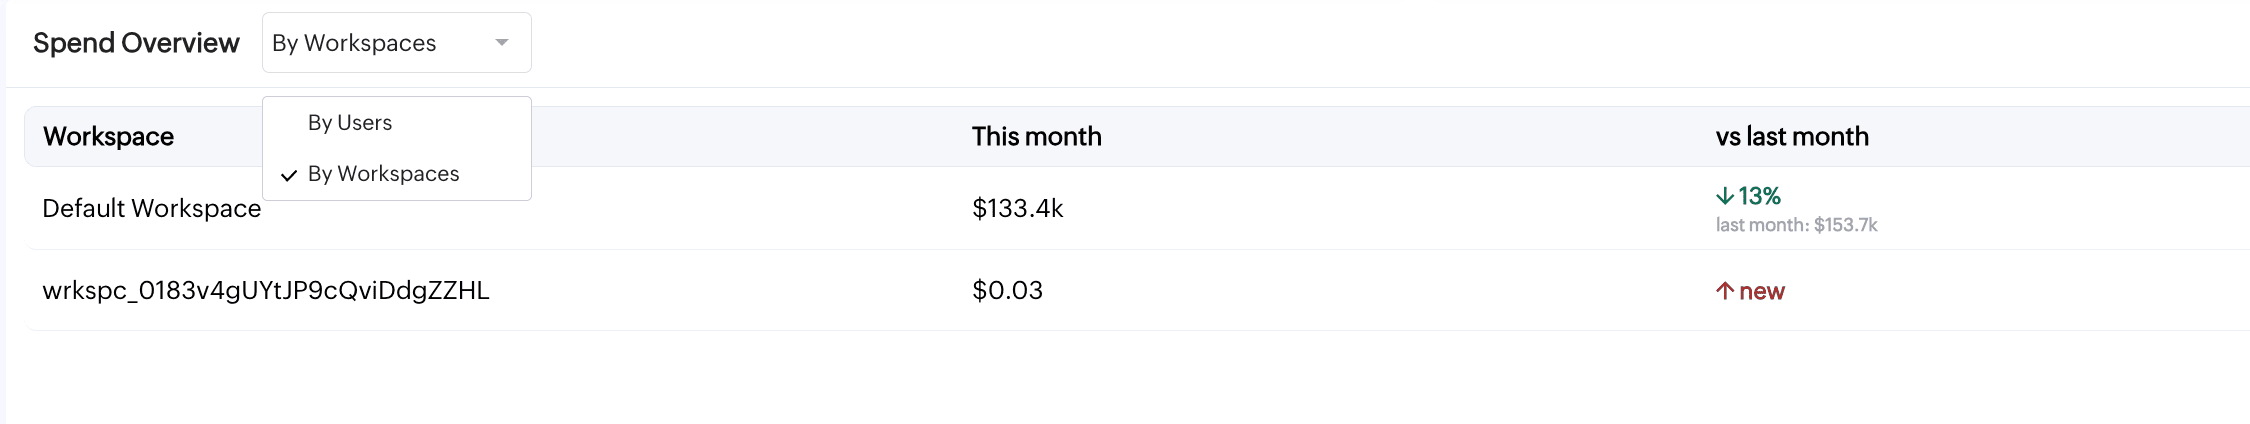
The Spend Overview section displays spend details by workspace or by user. Use the drop-down available next to Spend Overview to switch between:
- By Workspaces
- By Users
Note: The Usage tab is available when Claude usage data is synced through app integration.
Viewing GitHub Copilot usage
To view GitHub Copilot usage
- Select the GitHub app from the list.
- Click the Usage tab available next to Overview.
- The Usage tab provides detailed insights into GitHub Copilot spend, premium request usage, model-level usage, adoption, productivity, IDE and language distribution, and developer-level activity.
The Usage tab includes two sections:
- AI Usage
- Copilot Insights
AI Usage
The AI Usage tab provides spend and usage details for GitHub Copilot.
The top summary cards display the following details:
- Spend: Shows the total GitHub Copilot spend for the current month.
- Avg Daily Spend: Shows the average daily spend for the current month.
- Premium Requests: Shows the total number of premium requests used for the current month.
- Top Model: Displays the model with the highest usage or spend for the current month.
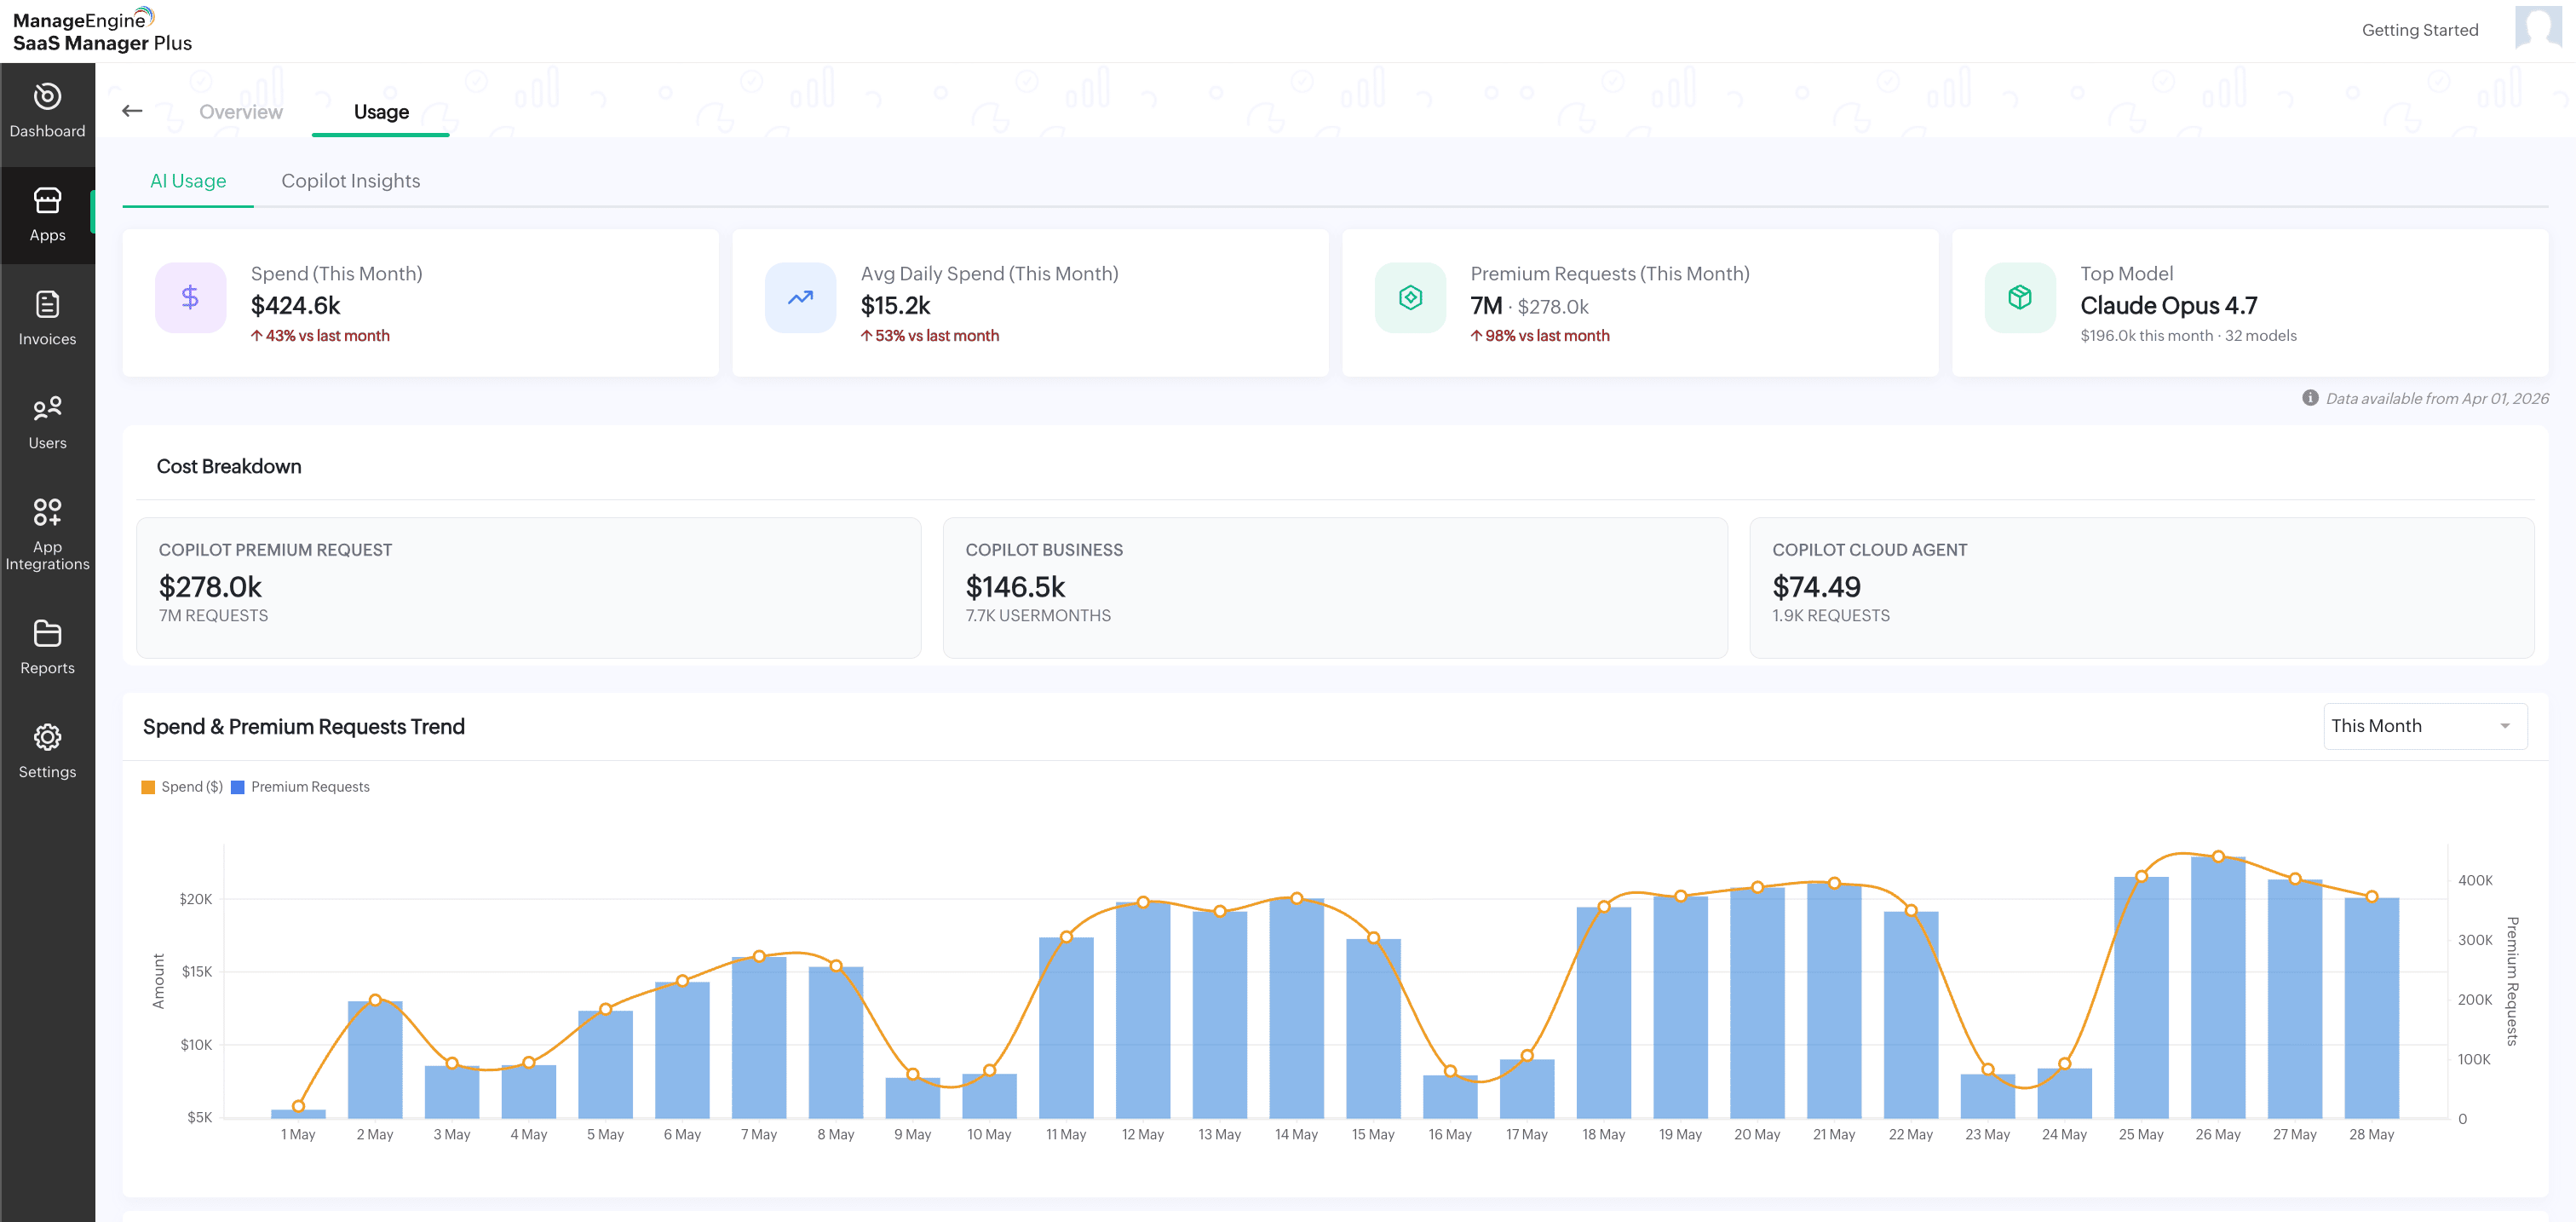
A Data available from date is displayed below the summary cards to indicate the starting date from which usage data is available.
The Cost Breakdown section displays the cost split across Copilot-related usage categories, such as Copilot Premium Request, Copilot Business, and Copilot Cloud Agent.
The Spend & Premium Requests Trend chart displays the spend and premium request trend over time. Use the time filter available in the top-right corner of the chart to view usage for a specific period.
The Model Spend Overview section displays model-wise usage details, including:
- Model Name
- This month
- vs last month
- This Month Tokens
- Share %
The Usage by model section provides a visual breakdown of GitHub Copilot usage by model. It includes:
- Spendings: Displays the spend distribution across models.
- Premium Requests Usage: Displays the premium request distribution across models.
The User Spend Overview section displays user-level spend details. You can switch between Top 10 and All Users to view the required user list.
The User Spend Overview table includes:
- User
- This month
- vs last month
- Top model
- Copilot Insights

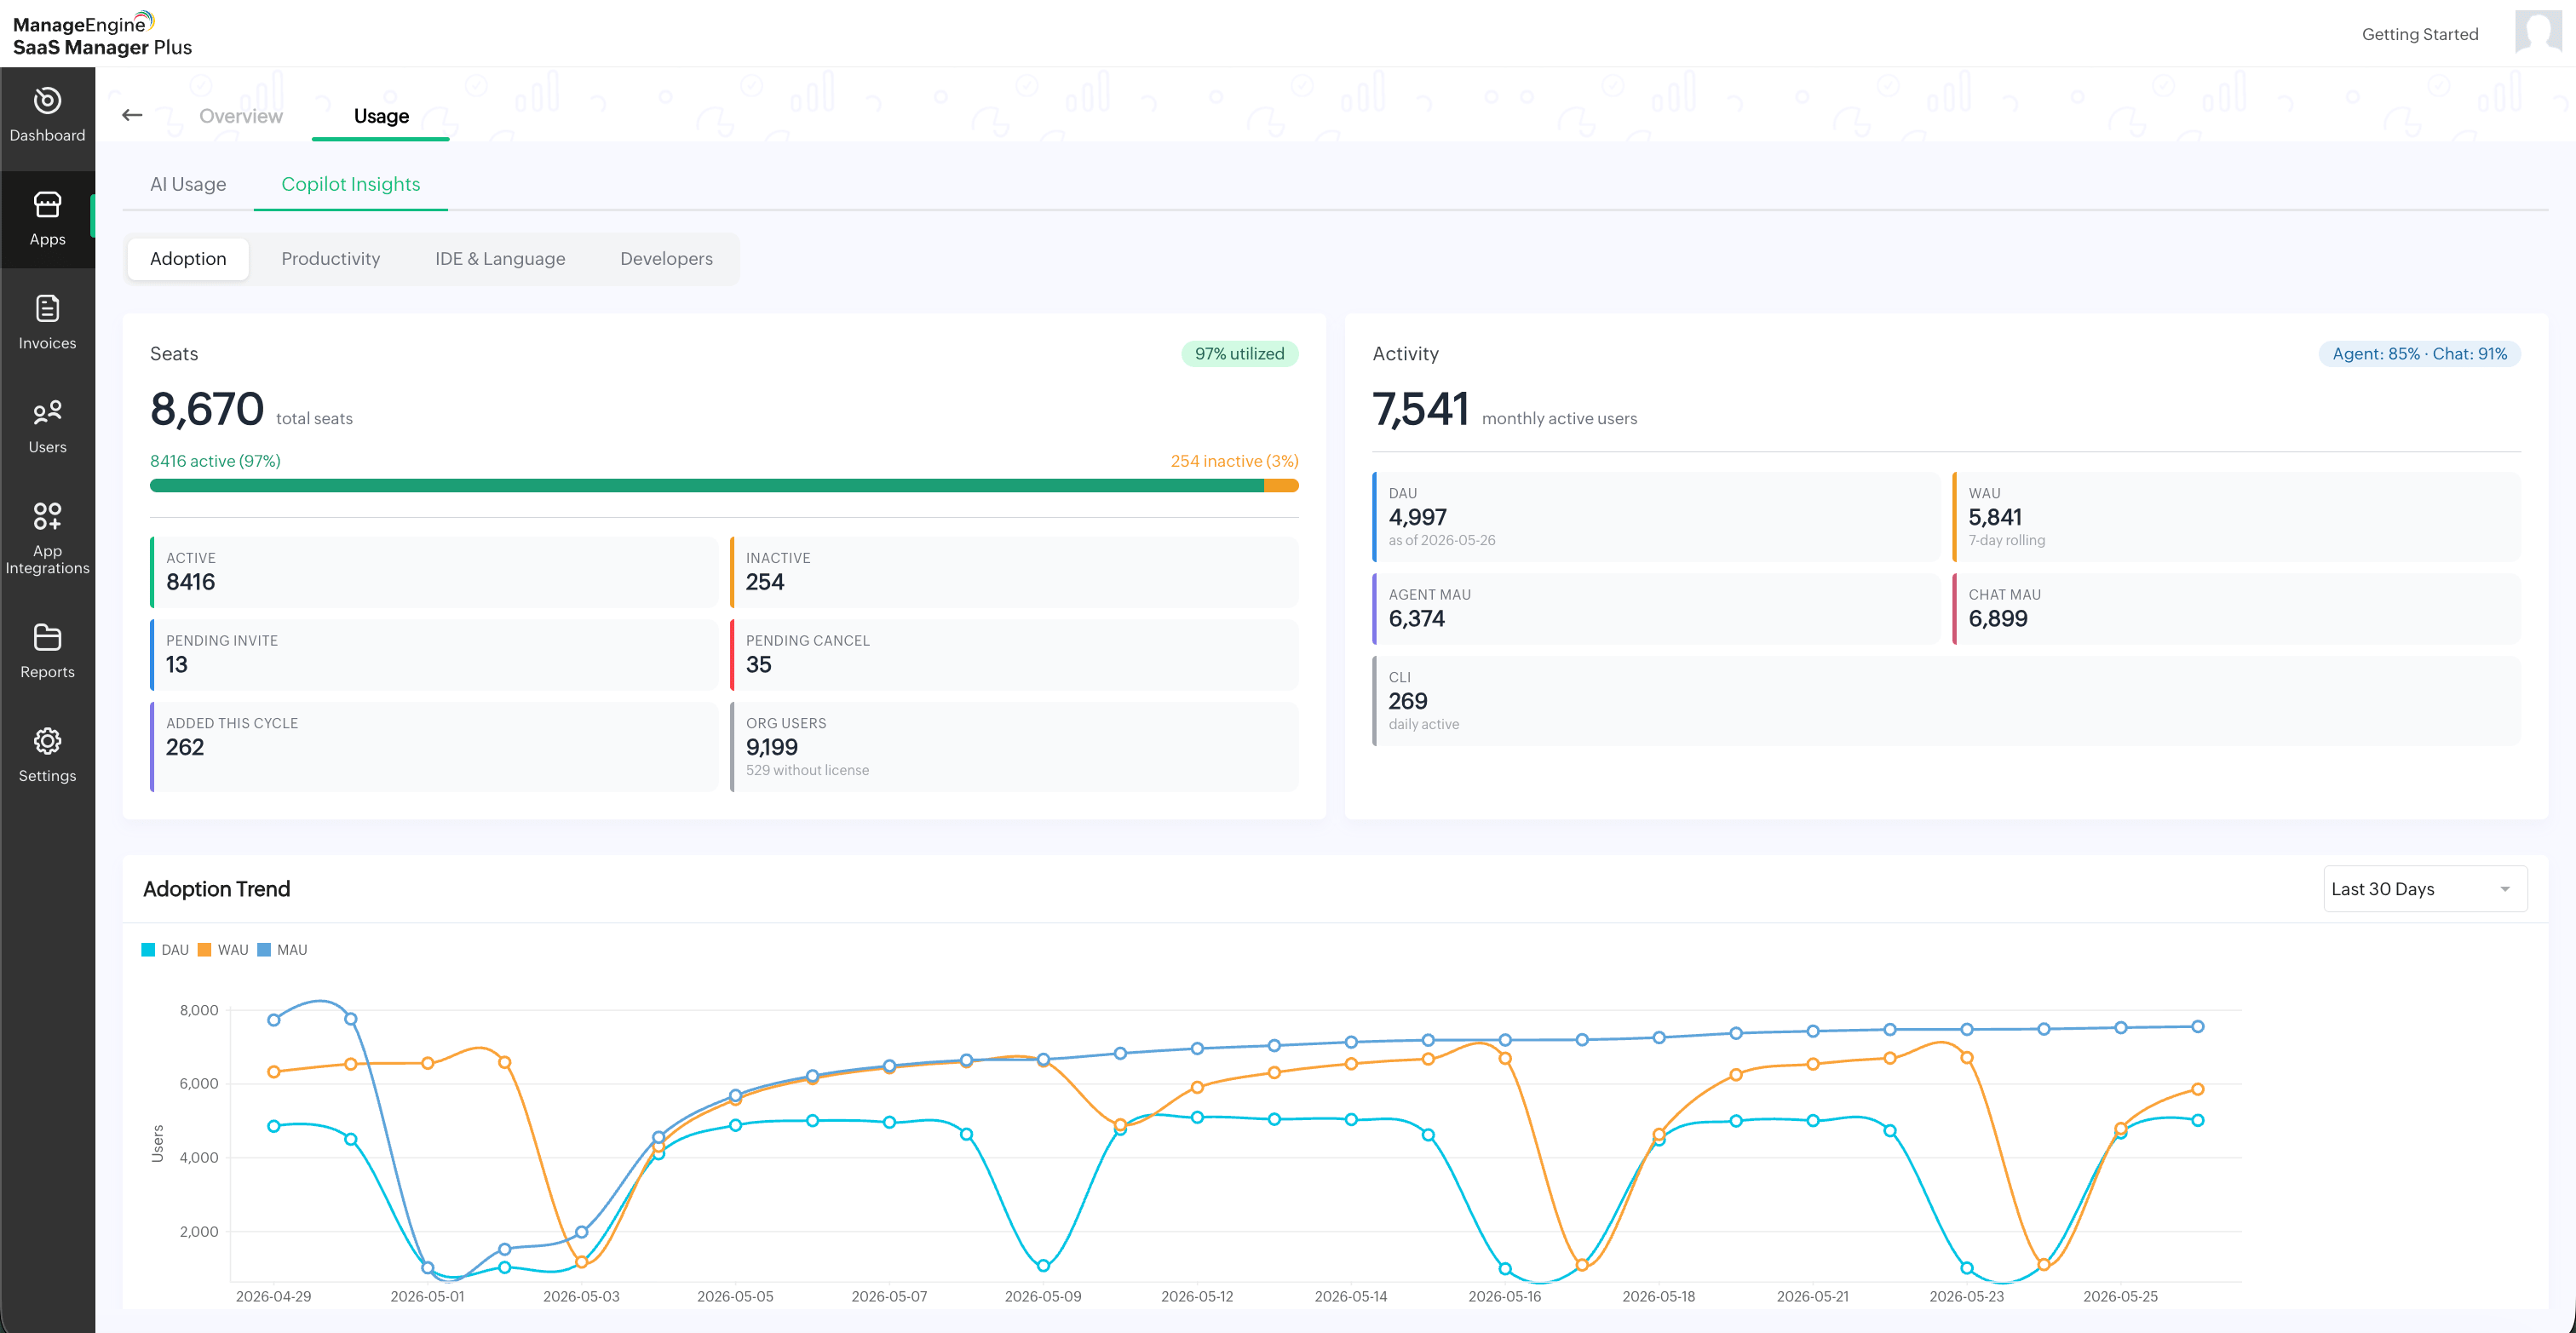
The Copilot Insights tab provides adoption, productivity, IDE and language, and developer-level insights for GitHub Copilot.
The Copilot Insights tab includes the following sections:
- Adoption
- Productivity
- IDE and Language
- Developers
Adoption
The Adoption section displays seat utilization and user activity details. The Seats card displays the total number of seats and the utilization percentage. It also shows seat-related details such as:
- Active
- Inactive
- Pending Invite
- Pending Cancel
- Added This Cycle
- Org Users
The Activity card displays monthly active user details and other activity metrics such as DAU, WAU, Agent MAU, Chat MAU, and CLI activity.
The Adoption Trend chart displays the user adoption trend over time. Use the time filter available in the top-right corner of the chart to view adoption data for a specific period.
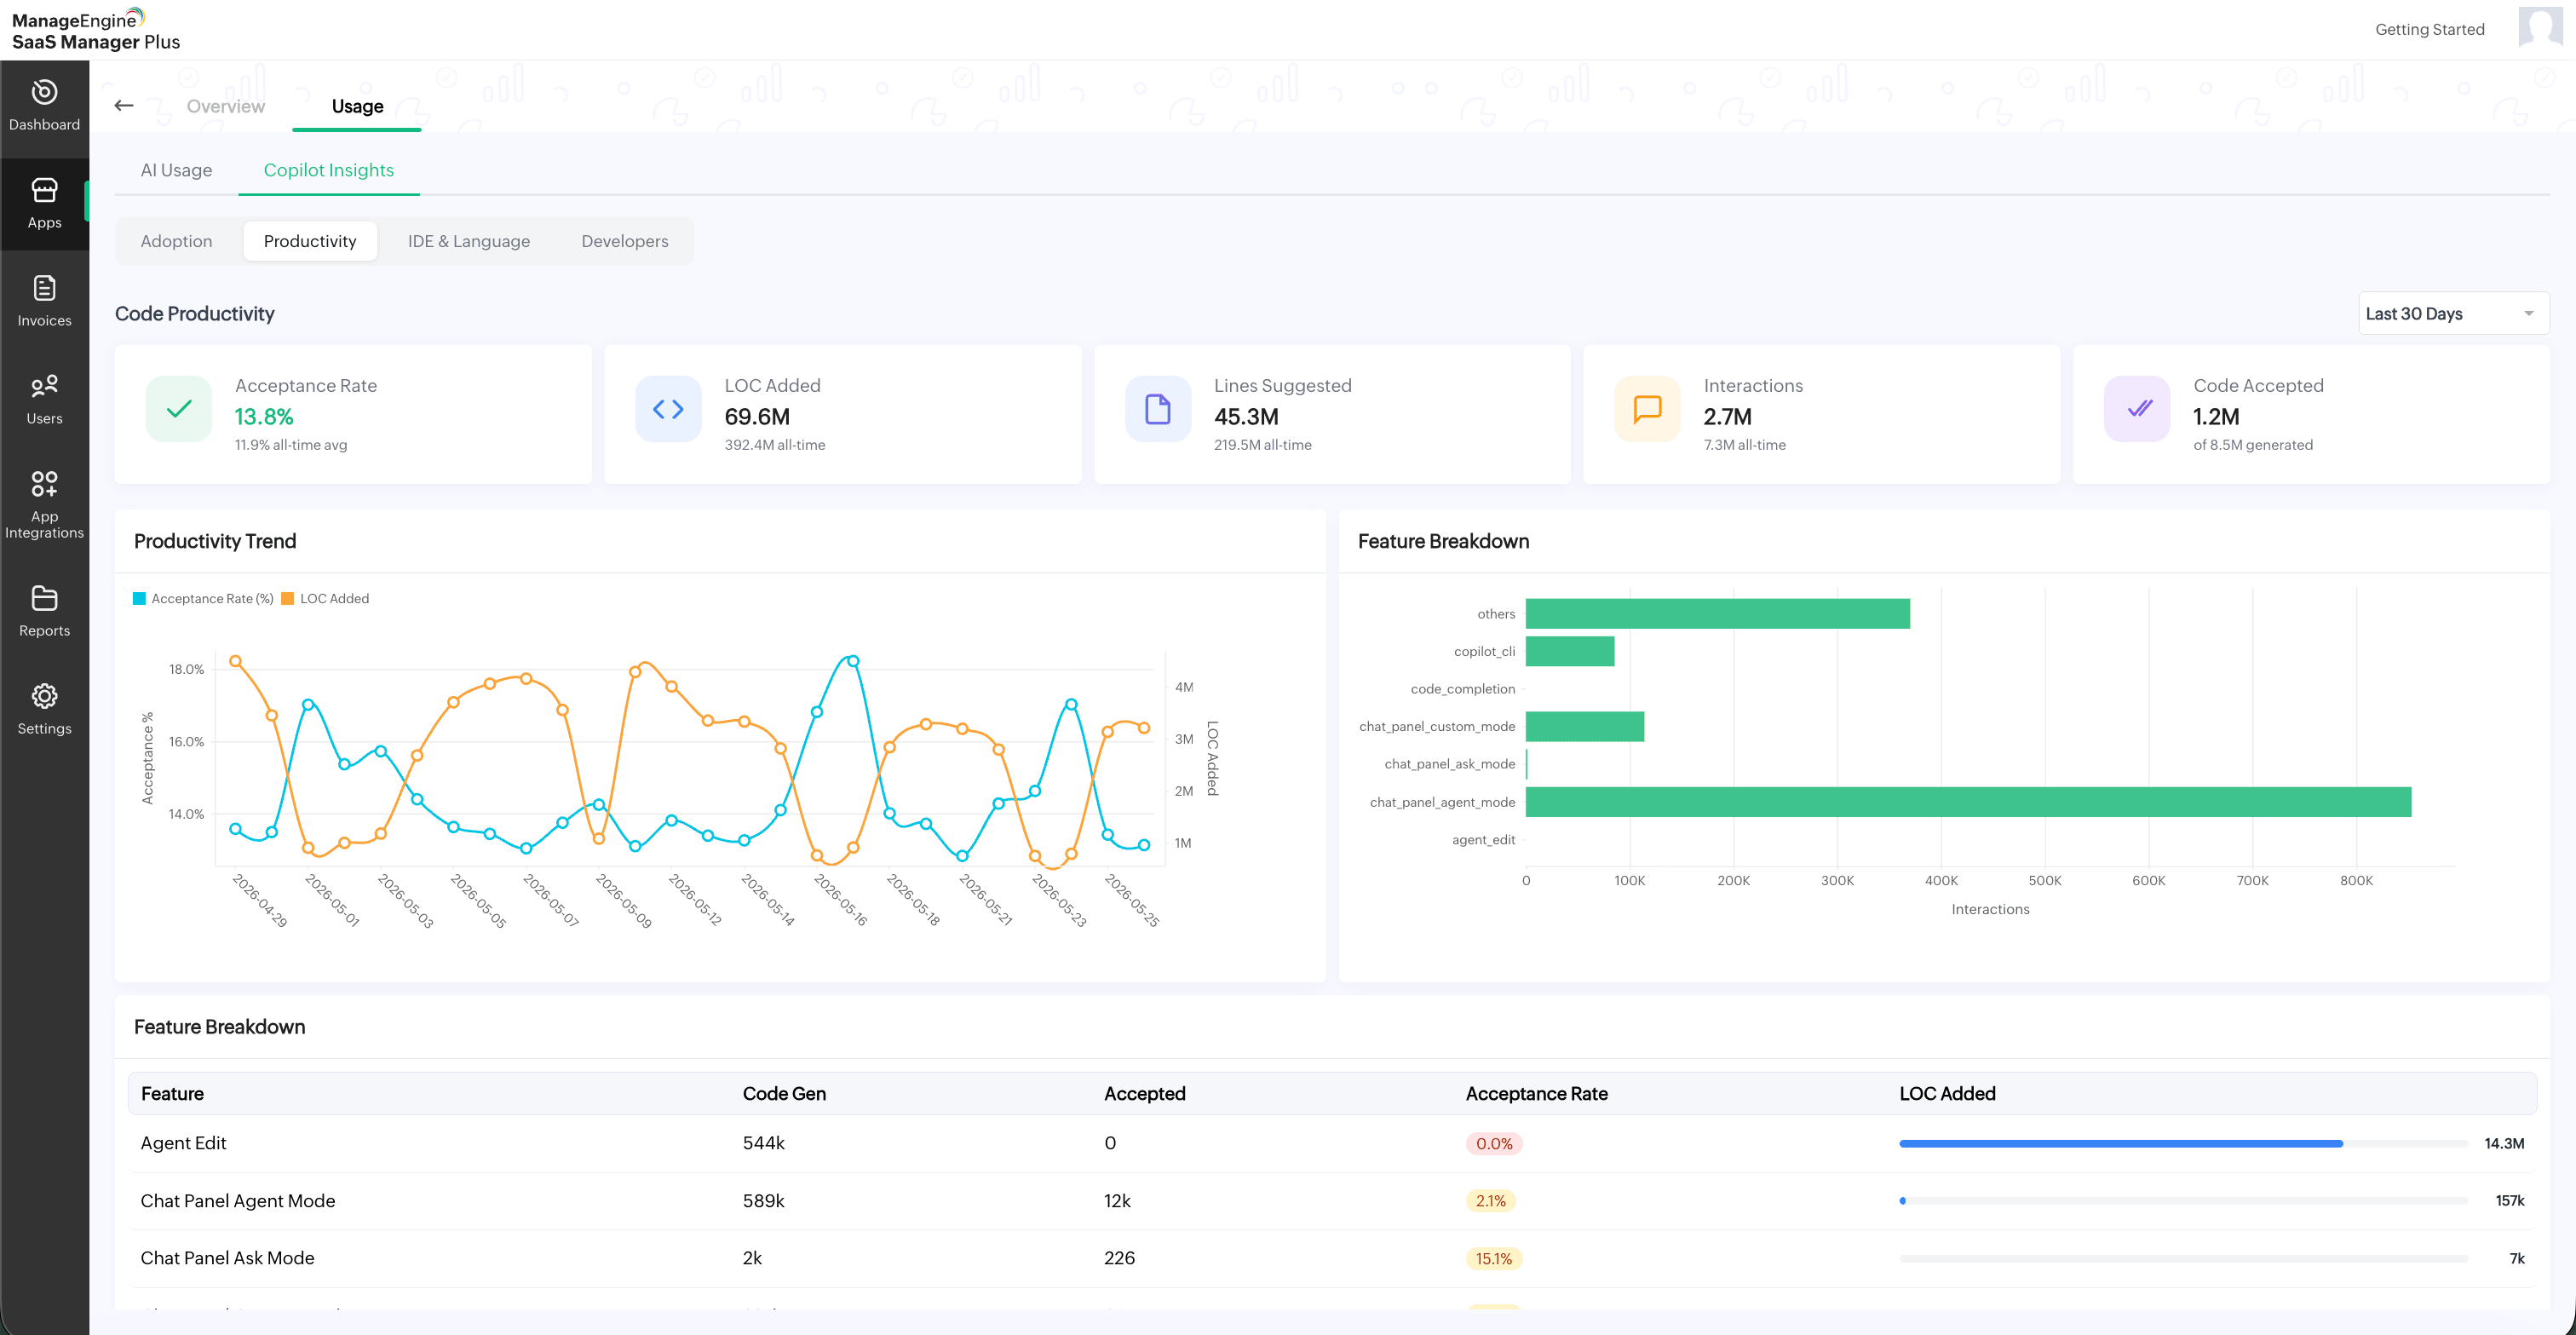
Productivity
The Productivity section displays code productivity metrics for GitHub Copilot. The top summary cards display the following details:
- Acceptance Rate
- LOC Added
- Lines Suggested
- Interactions
- Code Accepted
The Productivity Trend chart displays the acceptance rate and lines of code added over time.
The Feature Breakdown chart displays interactions across different Copilot features.
The Feature Breakdown table includes:
- Feature
- Code Gen
- Accepted
- Acceptance Rate
- LOC Added
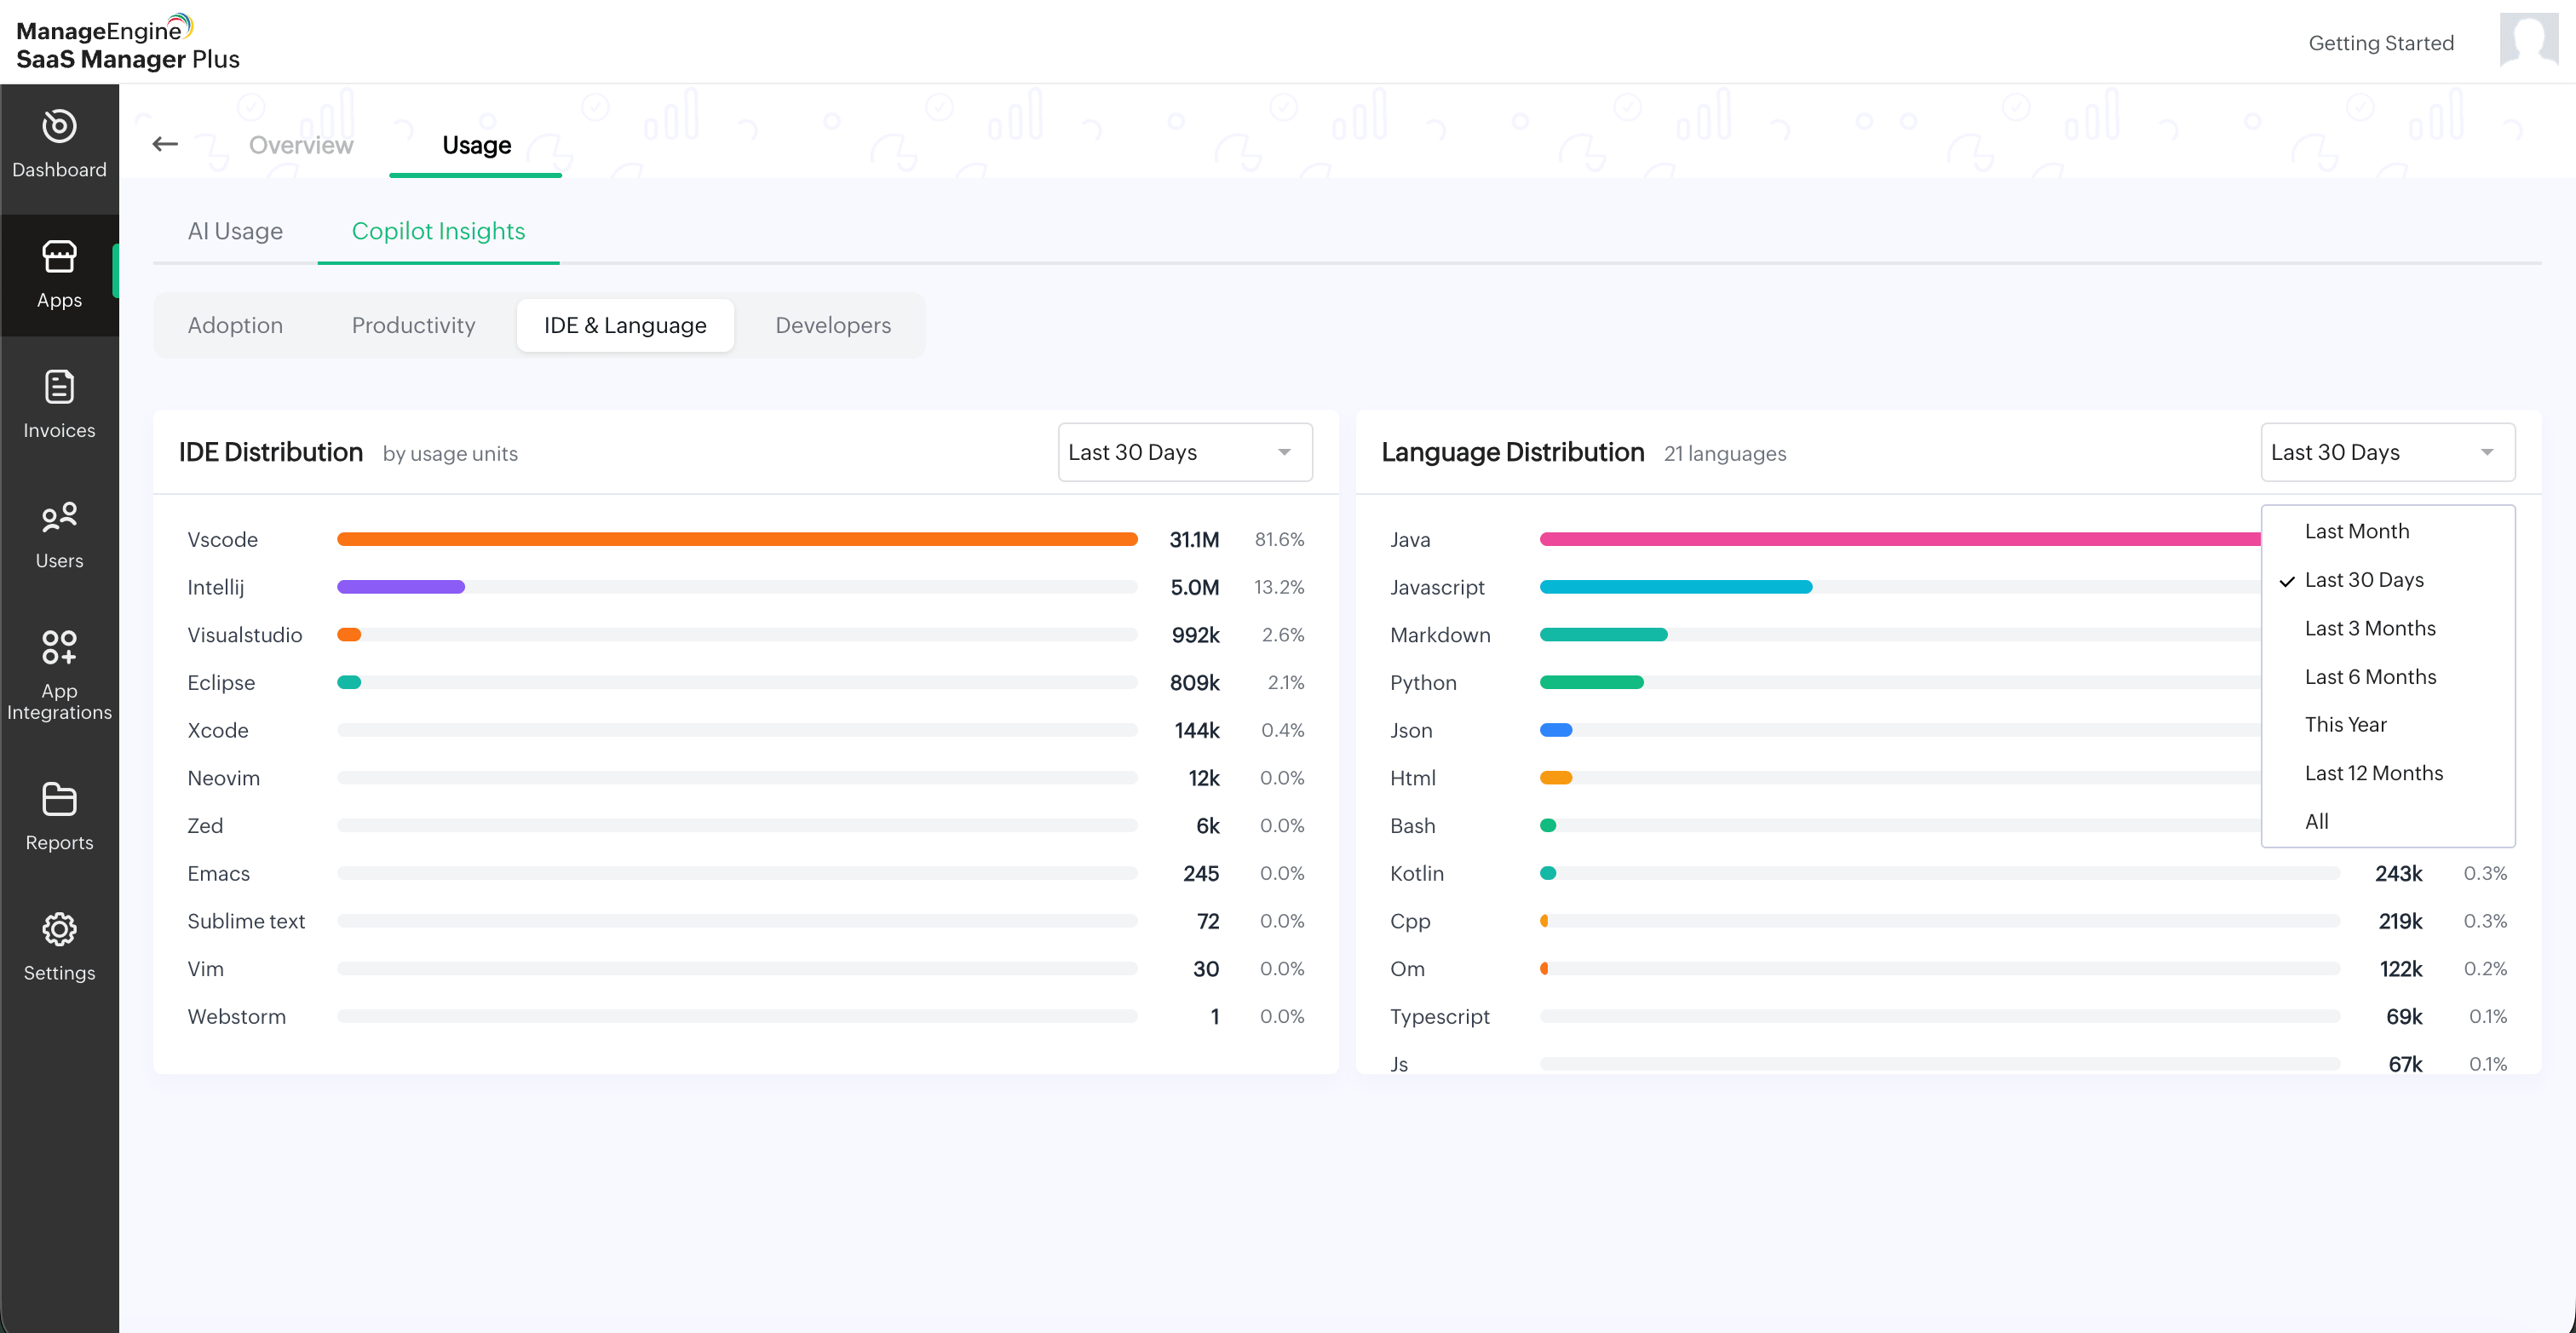
IDE and Language
The IDE & Language section displays usage distribution by IDE and programming language.
The IDE Distribution section shows usage across IDEs such as VS Code, IntelliJ, Visual Studio, Eclipse, Xcode, Neovim, and other supported editors.
The Language Distribution section shows usage across programming languages such as Java, JavaScript, Markdown, Python, JSON, HTML, Bash, Kotlin, C++, TypeScript, and other detected languages.
Use the time filter available in the top-right corner to view IDE and language distribution for a specific period.
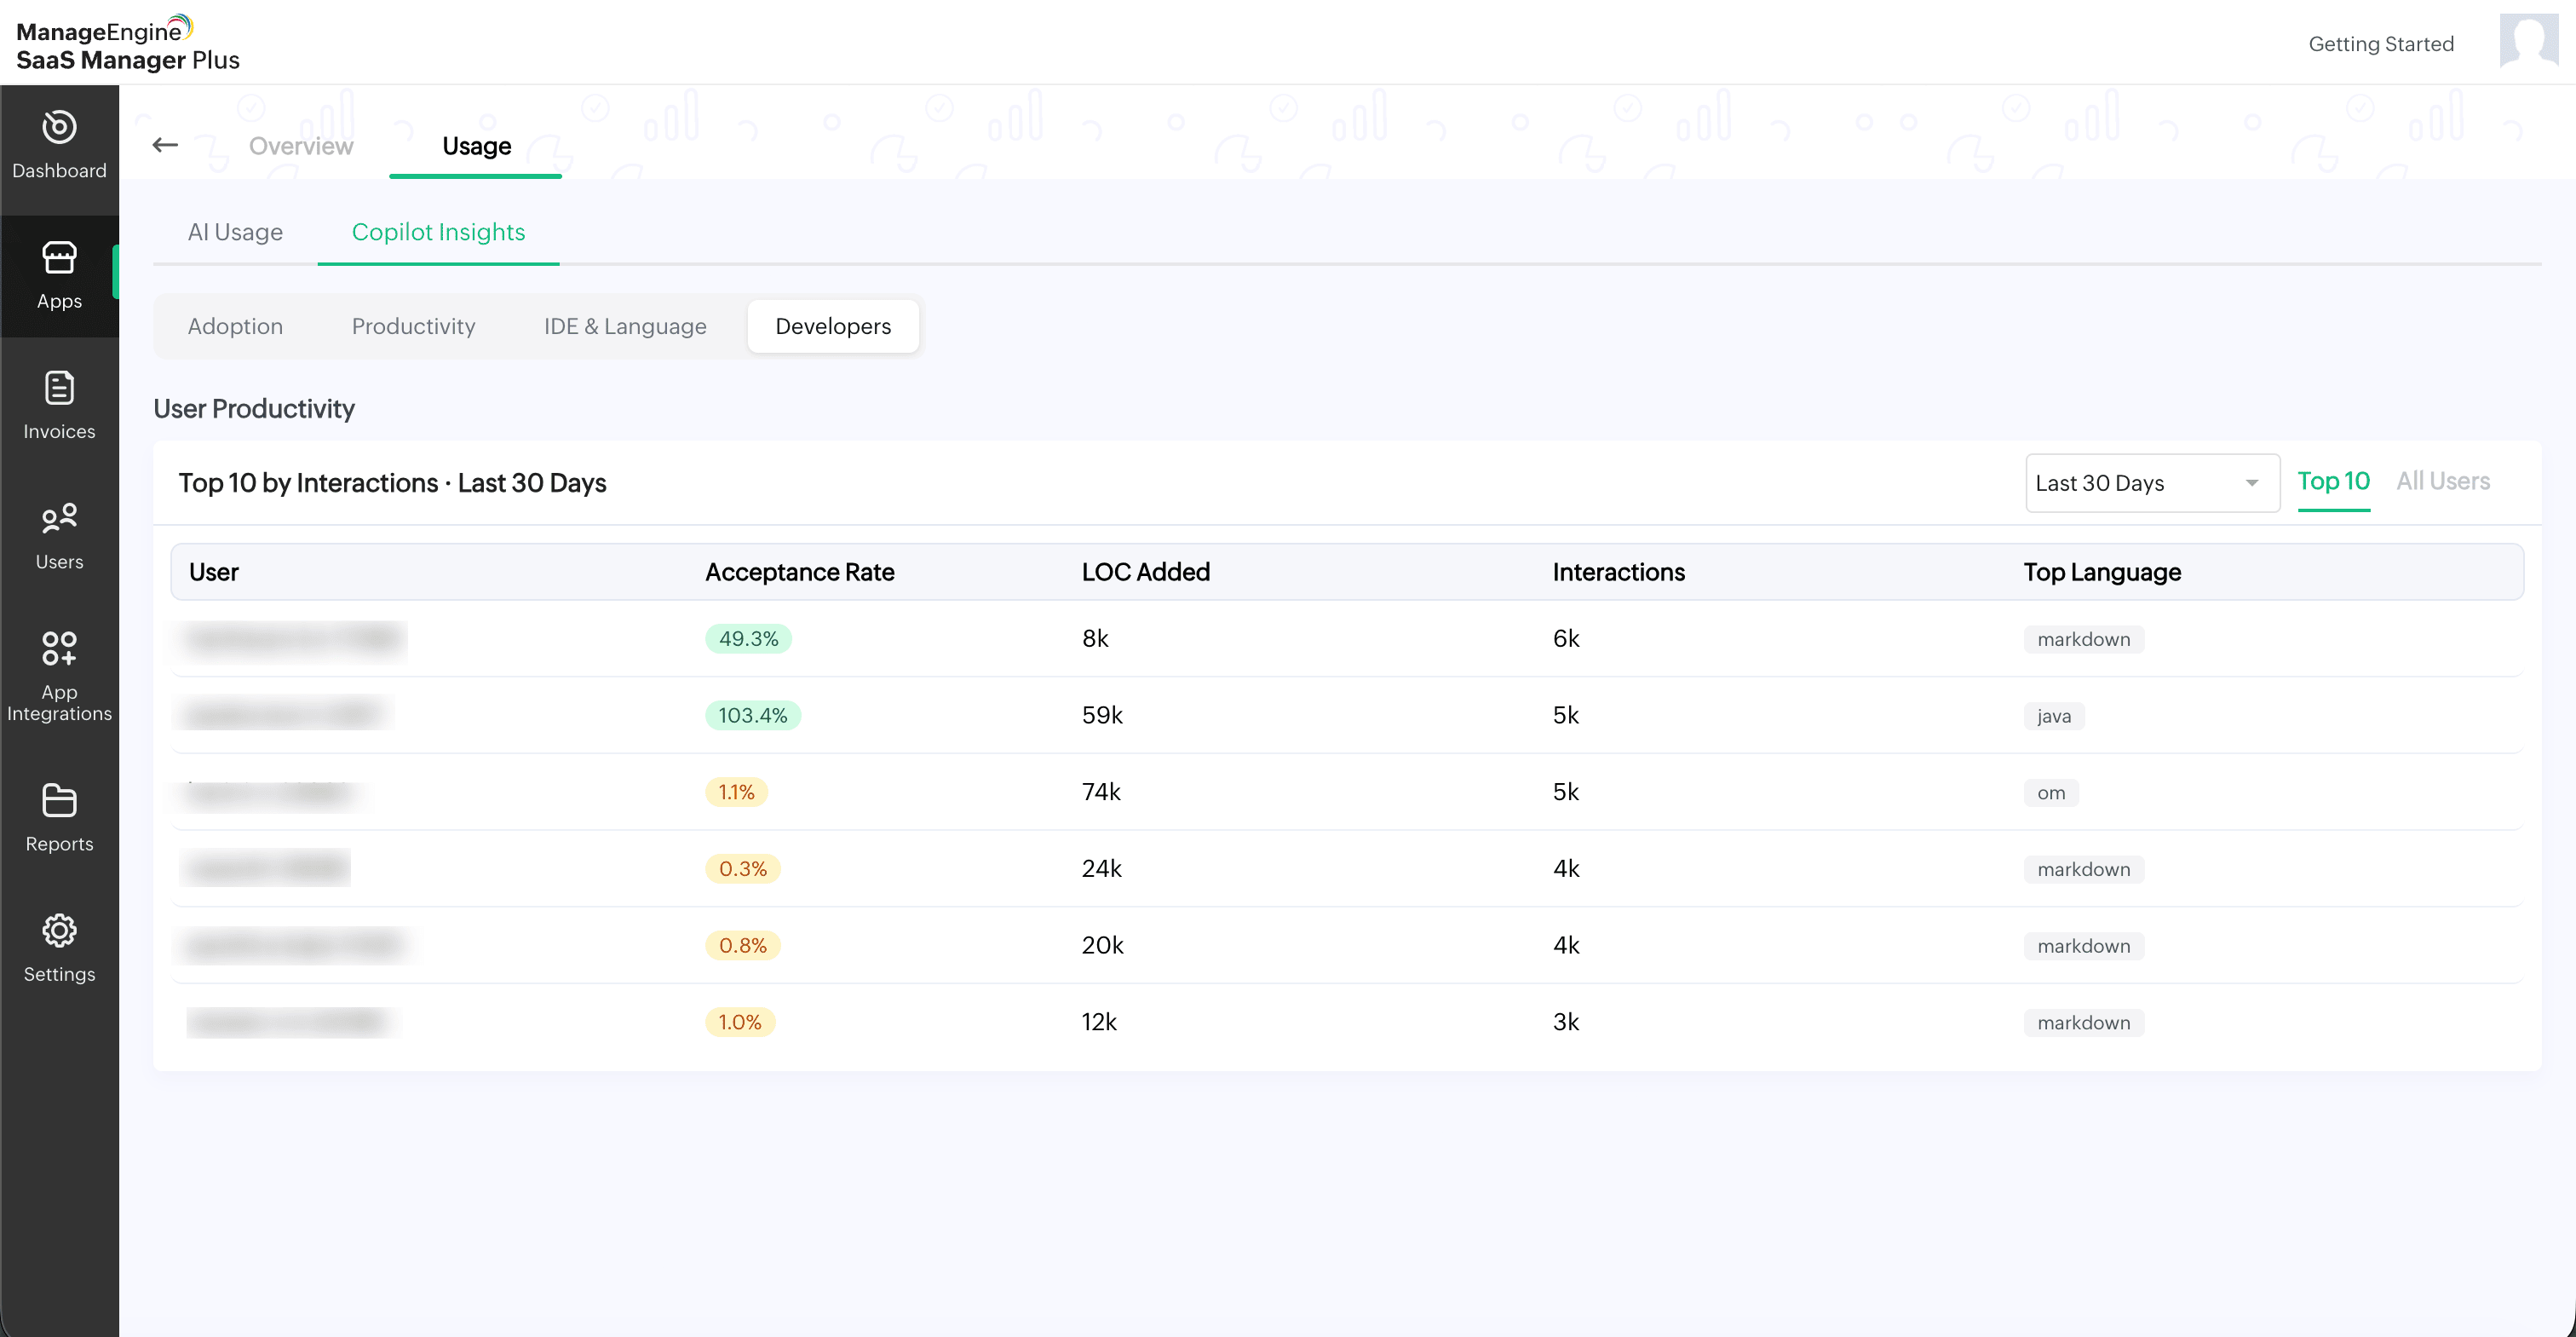
Developers
The Developers section displays developer-level productivity details.
The User Productivity table displays the top users by interactions for the selected period. You can switch between Top 10 and All Users to view the required user list.
The User Productivity table includes:
- User
- Acceptance Rate
- LOC Added
- Interactions
- Top Language
Use the time filter available in the top-right corner to view developer productivity data for a specific period.
Viewing OpenAI API usage
To view OpenAI API usage
- Select the OpenAI API app from the list.
- Click the Usage tab available next to Overview.
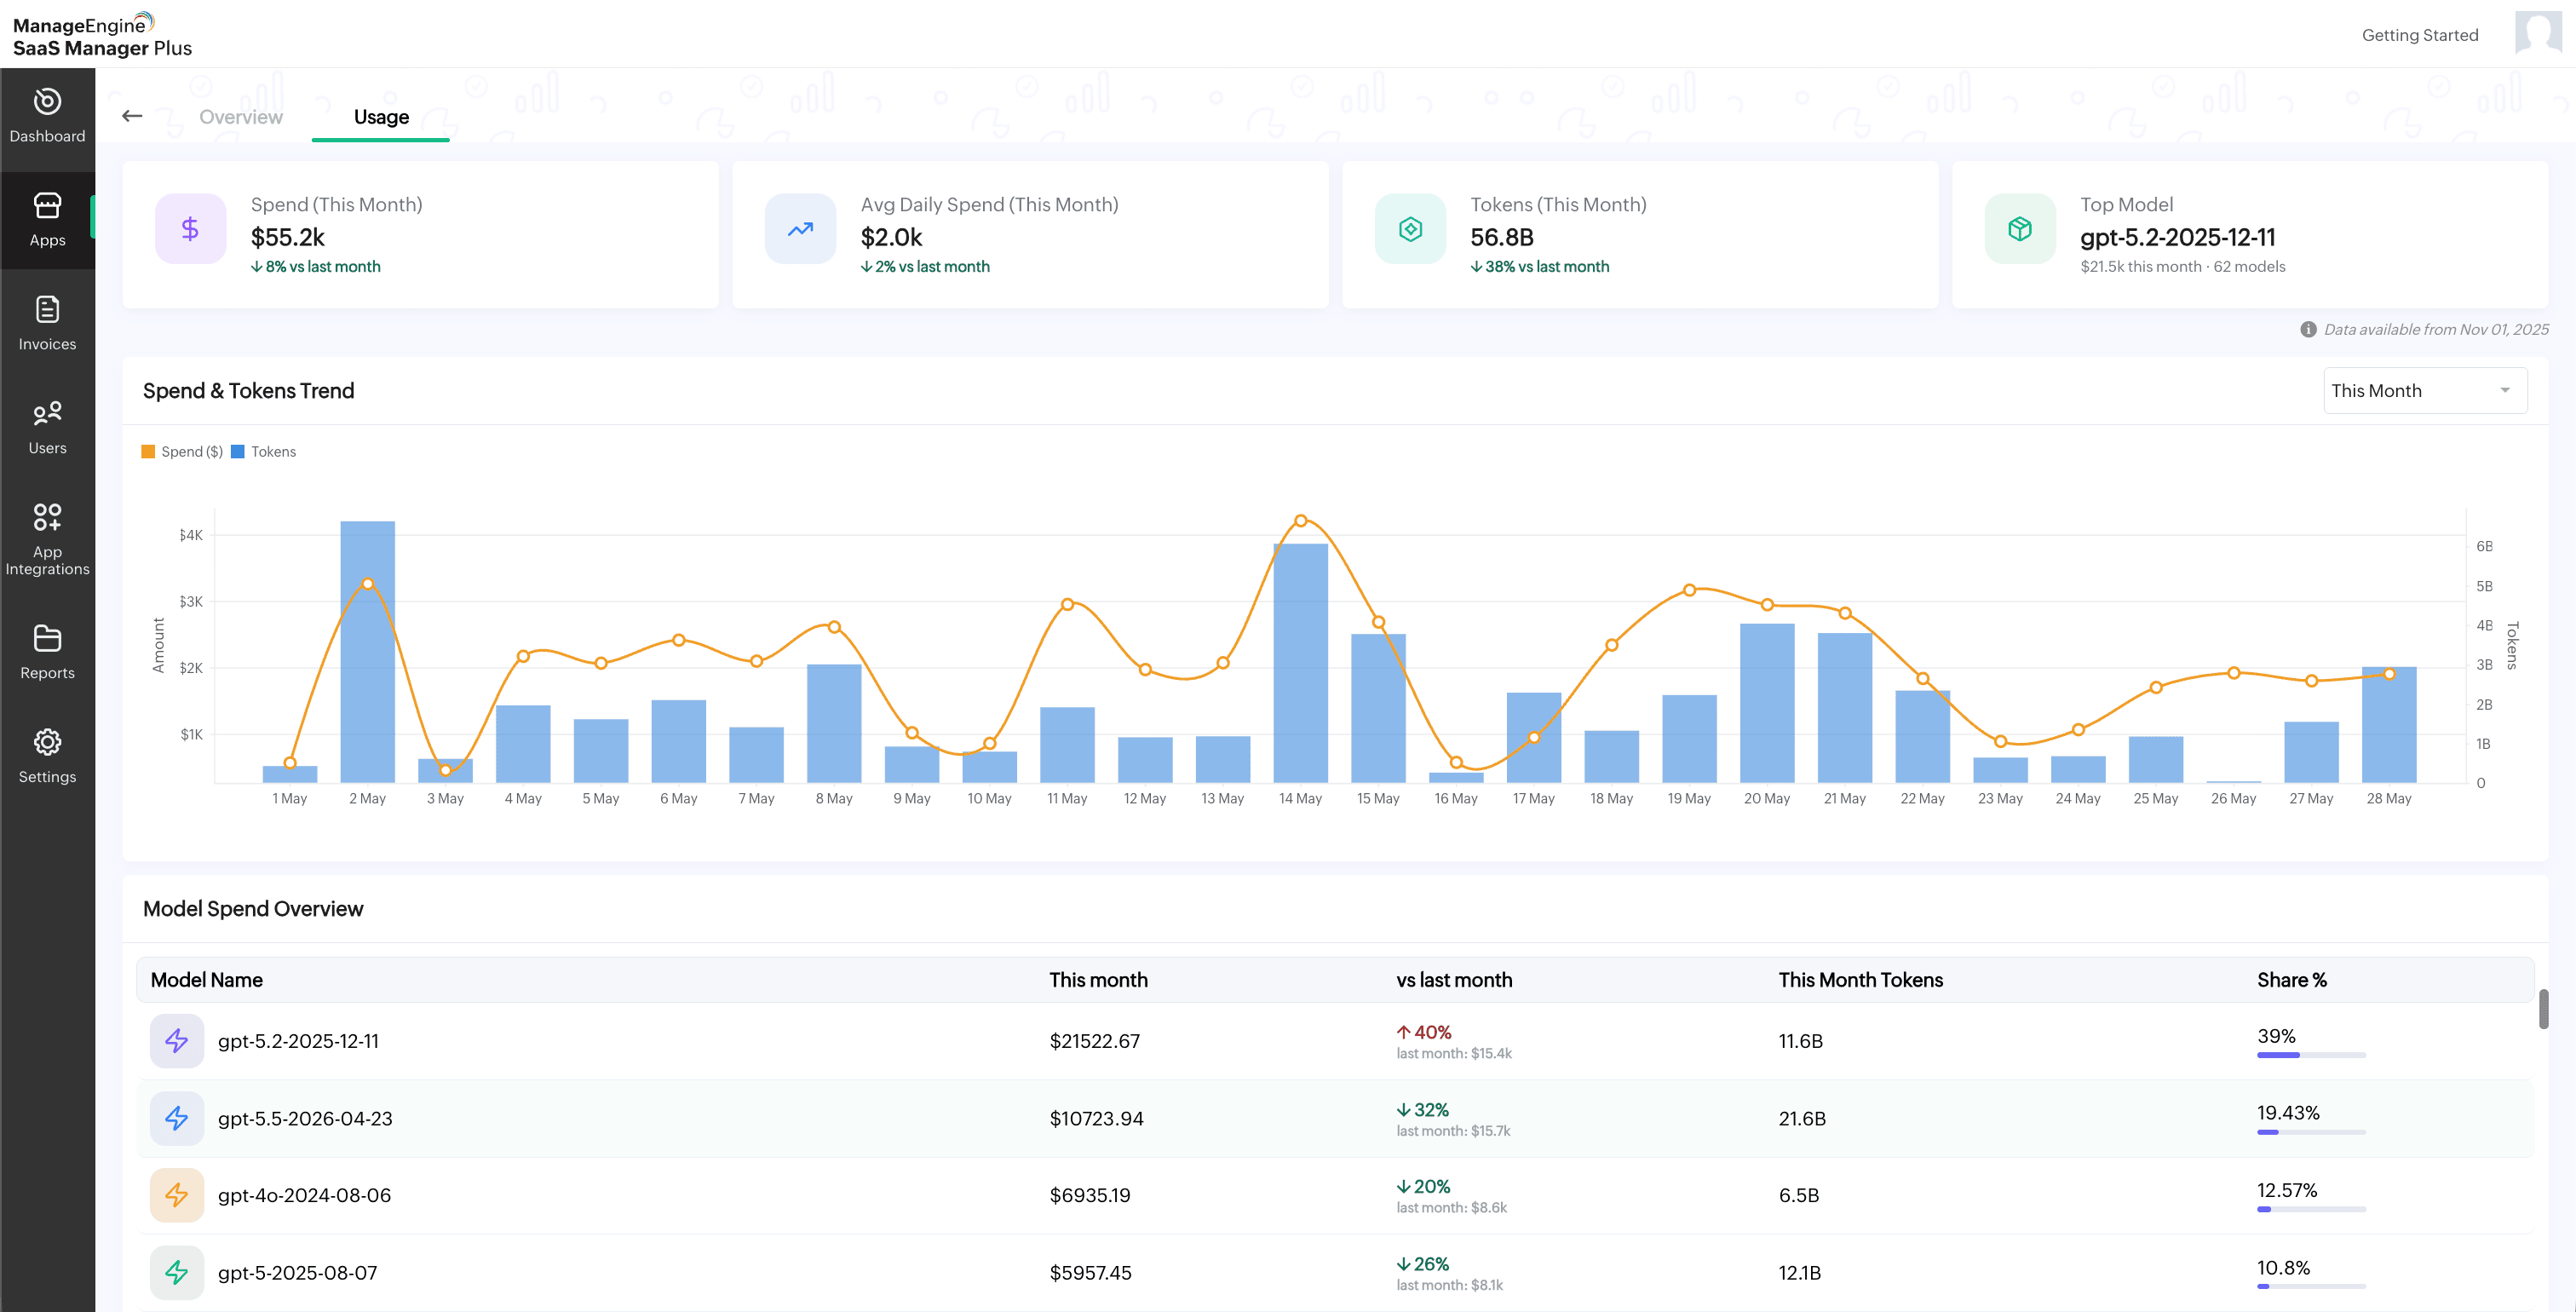
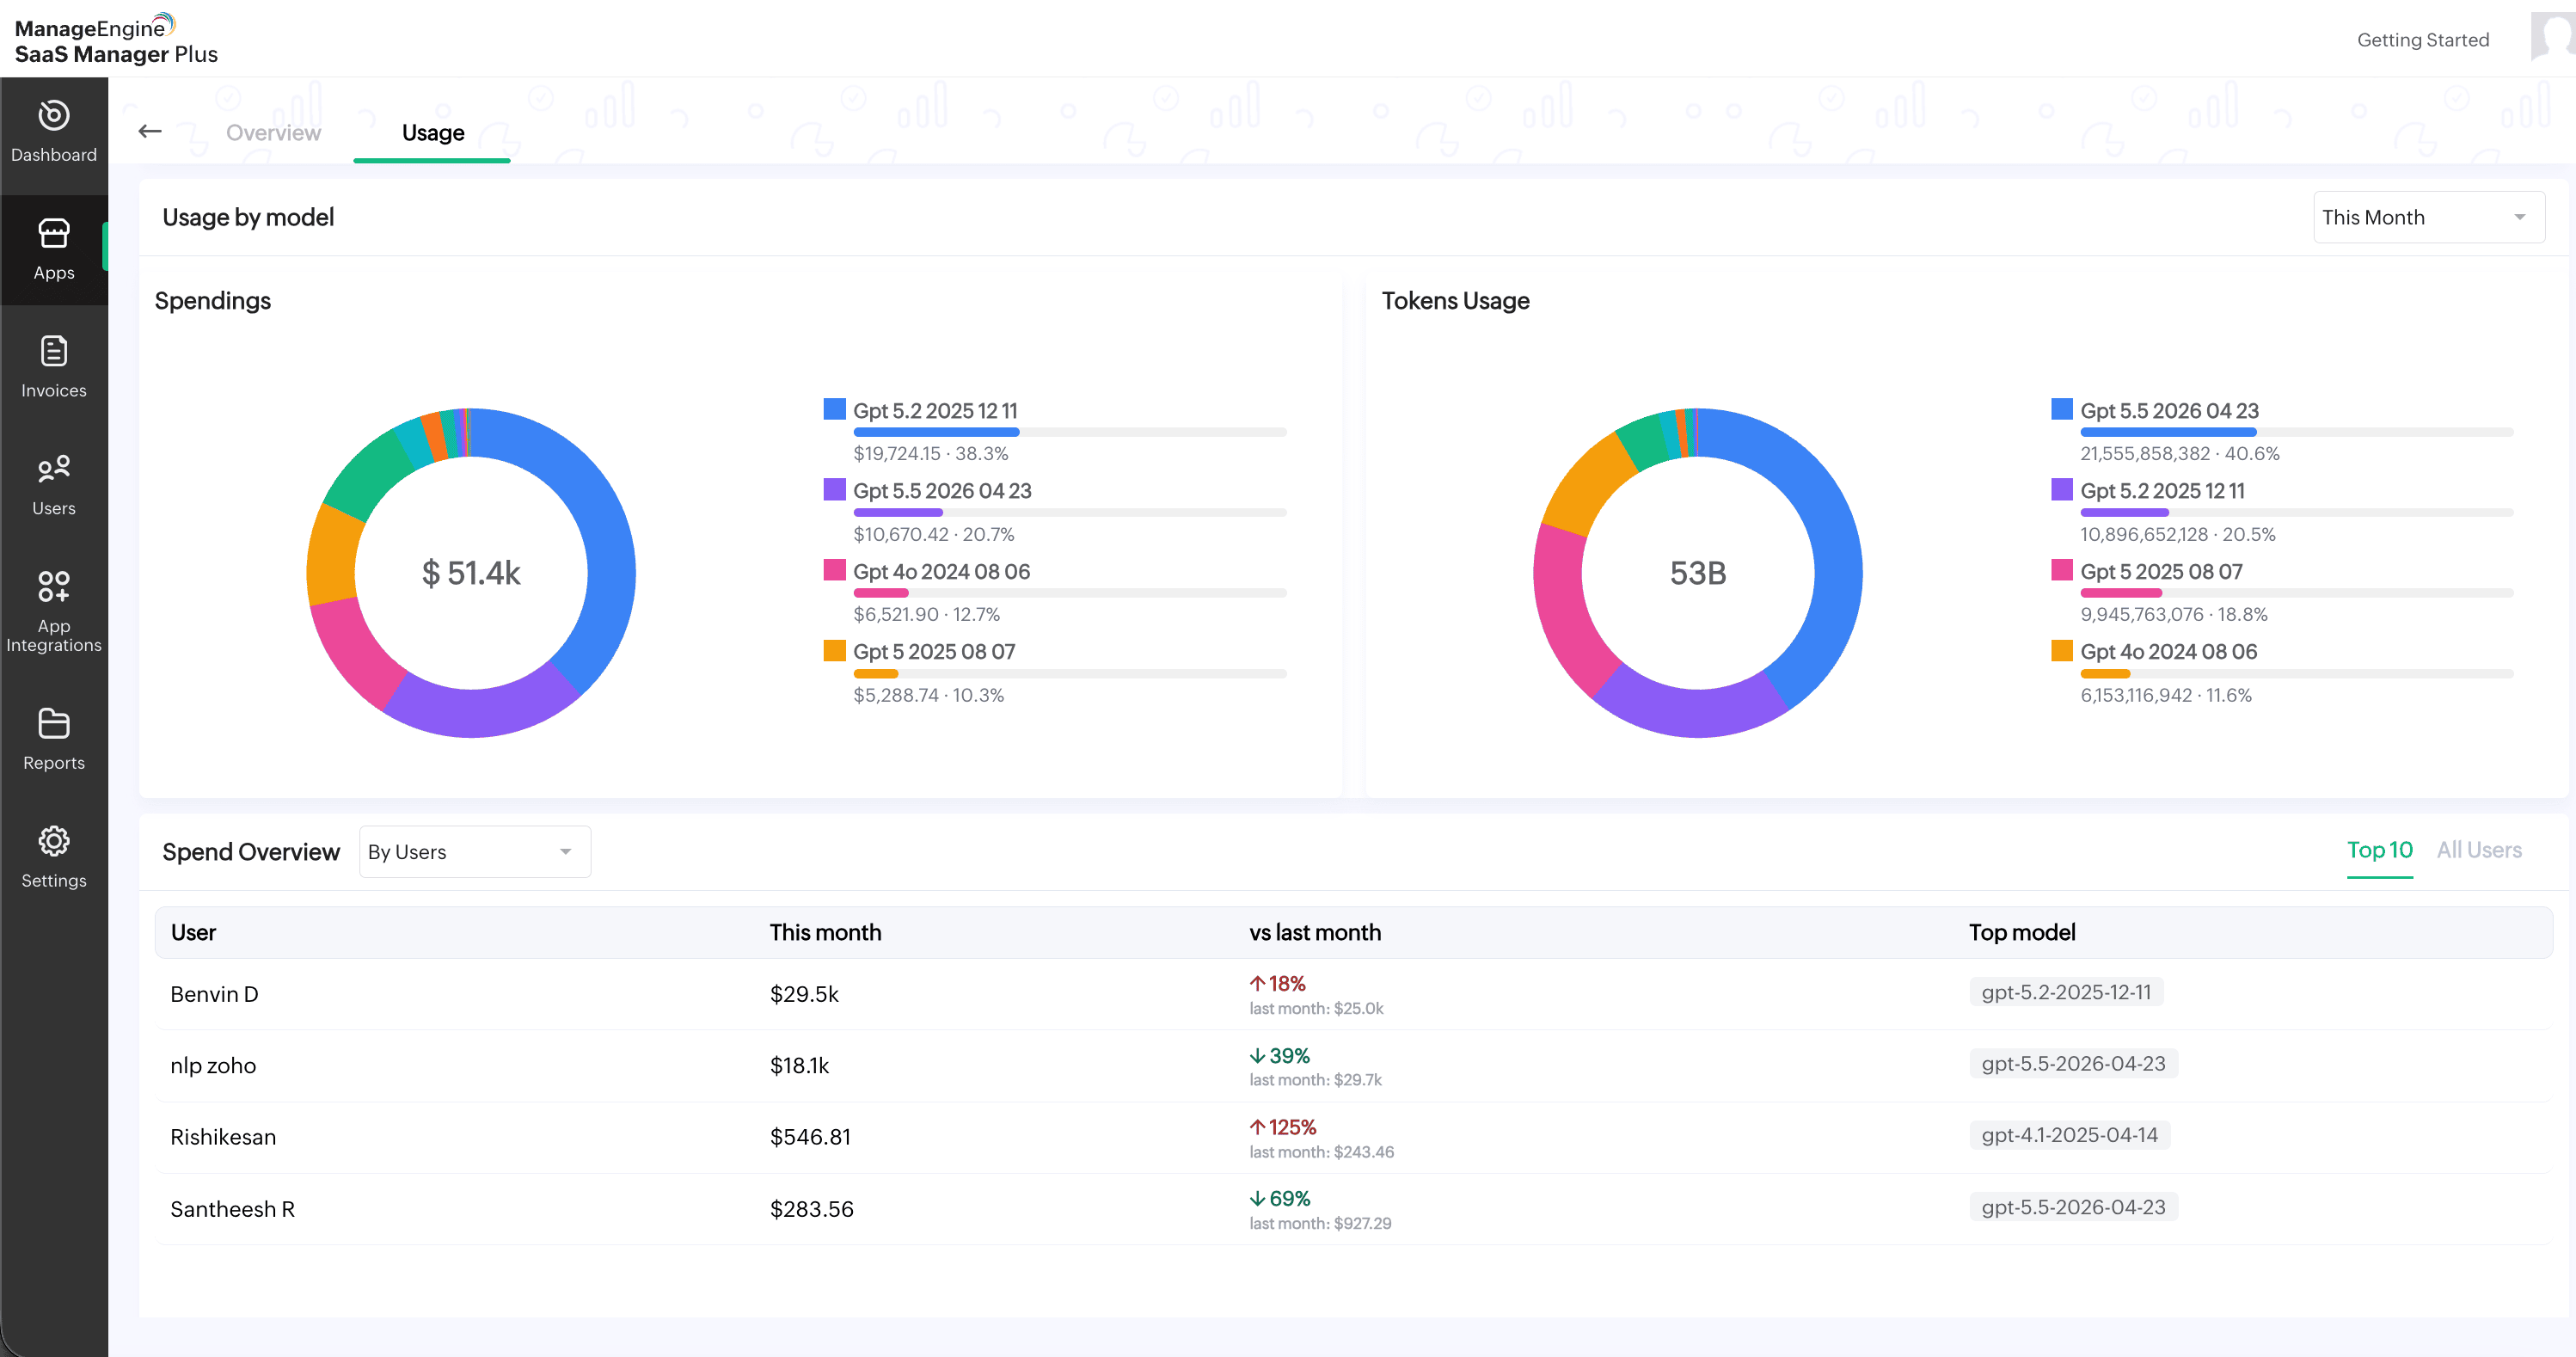
- The Usage tab provides detailed insights into OpenAI API spend, token usage, model-level usage, and spend distribution.
The top summary cards display the following details:
- Spend: Shows the total OpenAI API spend for the current month.
- Avg Daily Spend: Shows the average daily spend for the current month.
- Tokens: Shows the total number of tokens used for the current month.
- Top Model: Displays the model with the highest usage or spend for the current month.
A Data available from date is displayed below the summary cards to indicate the starting date from which usage data is available.
The Spend & Tokens Trend chart displays the spend and token usage trend over time. Use the time filter available in the top-right corner of the chart to view usage for a specific period.
The Model Spend Overview section displays model-wise usage details, including:
- Model Name
- This month
- vs last month
- This Month Tokens
- Share %
The Usage by model section provides a visual breakdown of OpenAI API usage by model. It includes:
- Spendings: Displays the spend distribution across models.
- Tokens Usage: Displays the token usage distribution across models.
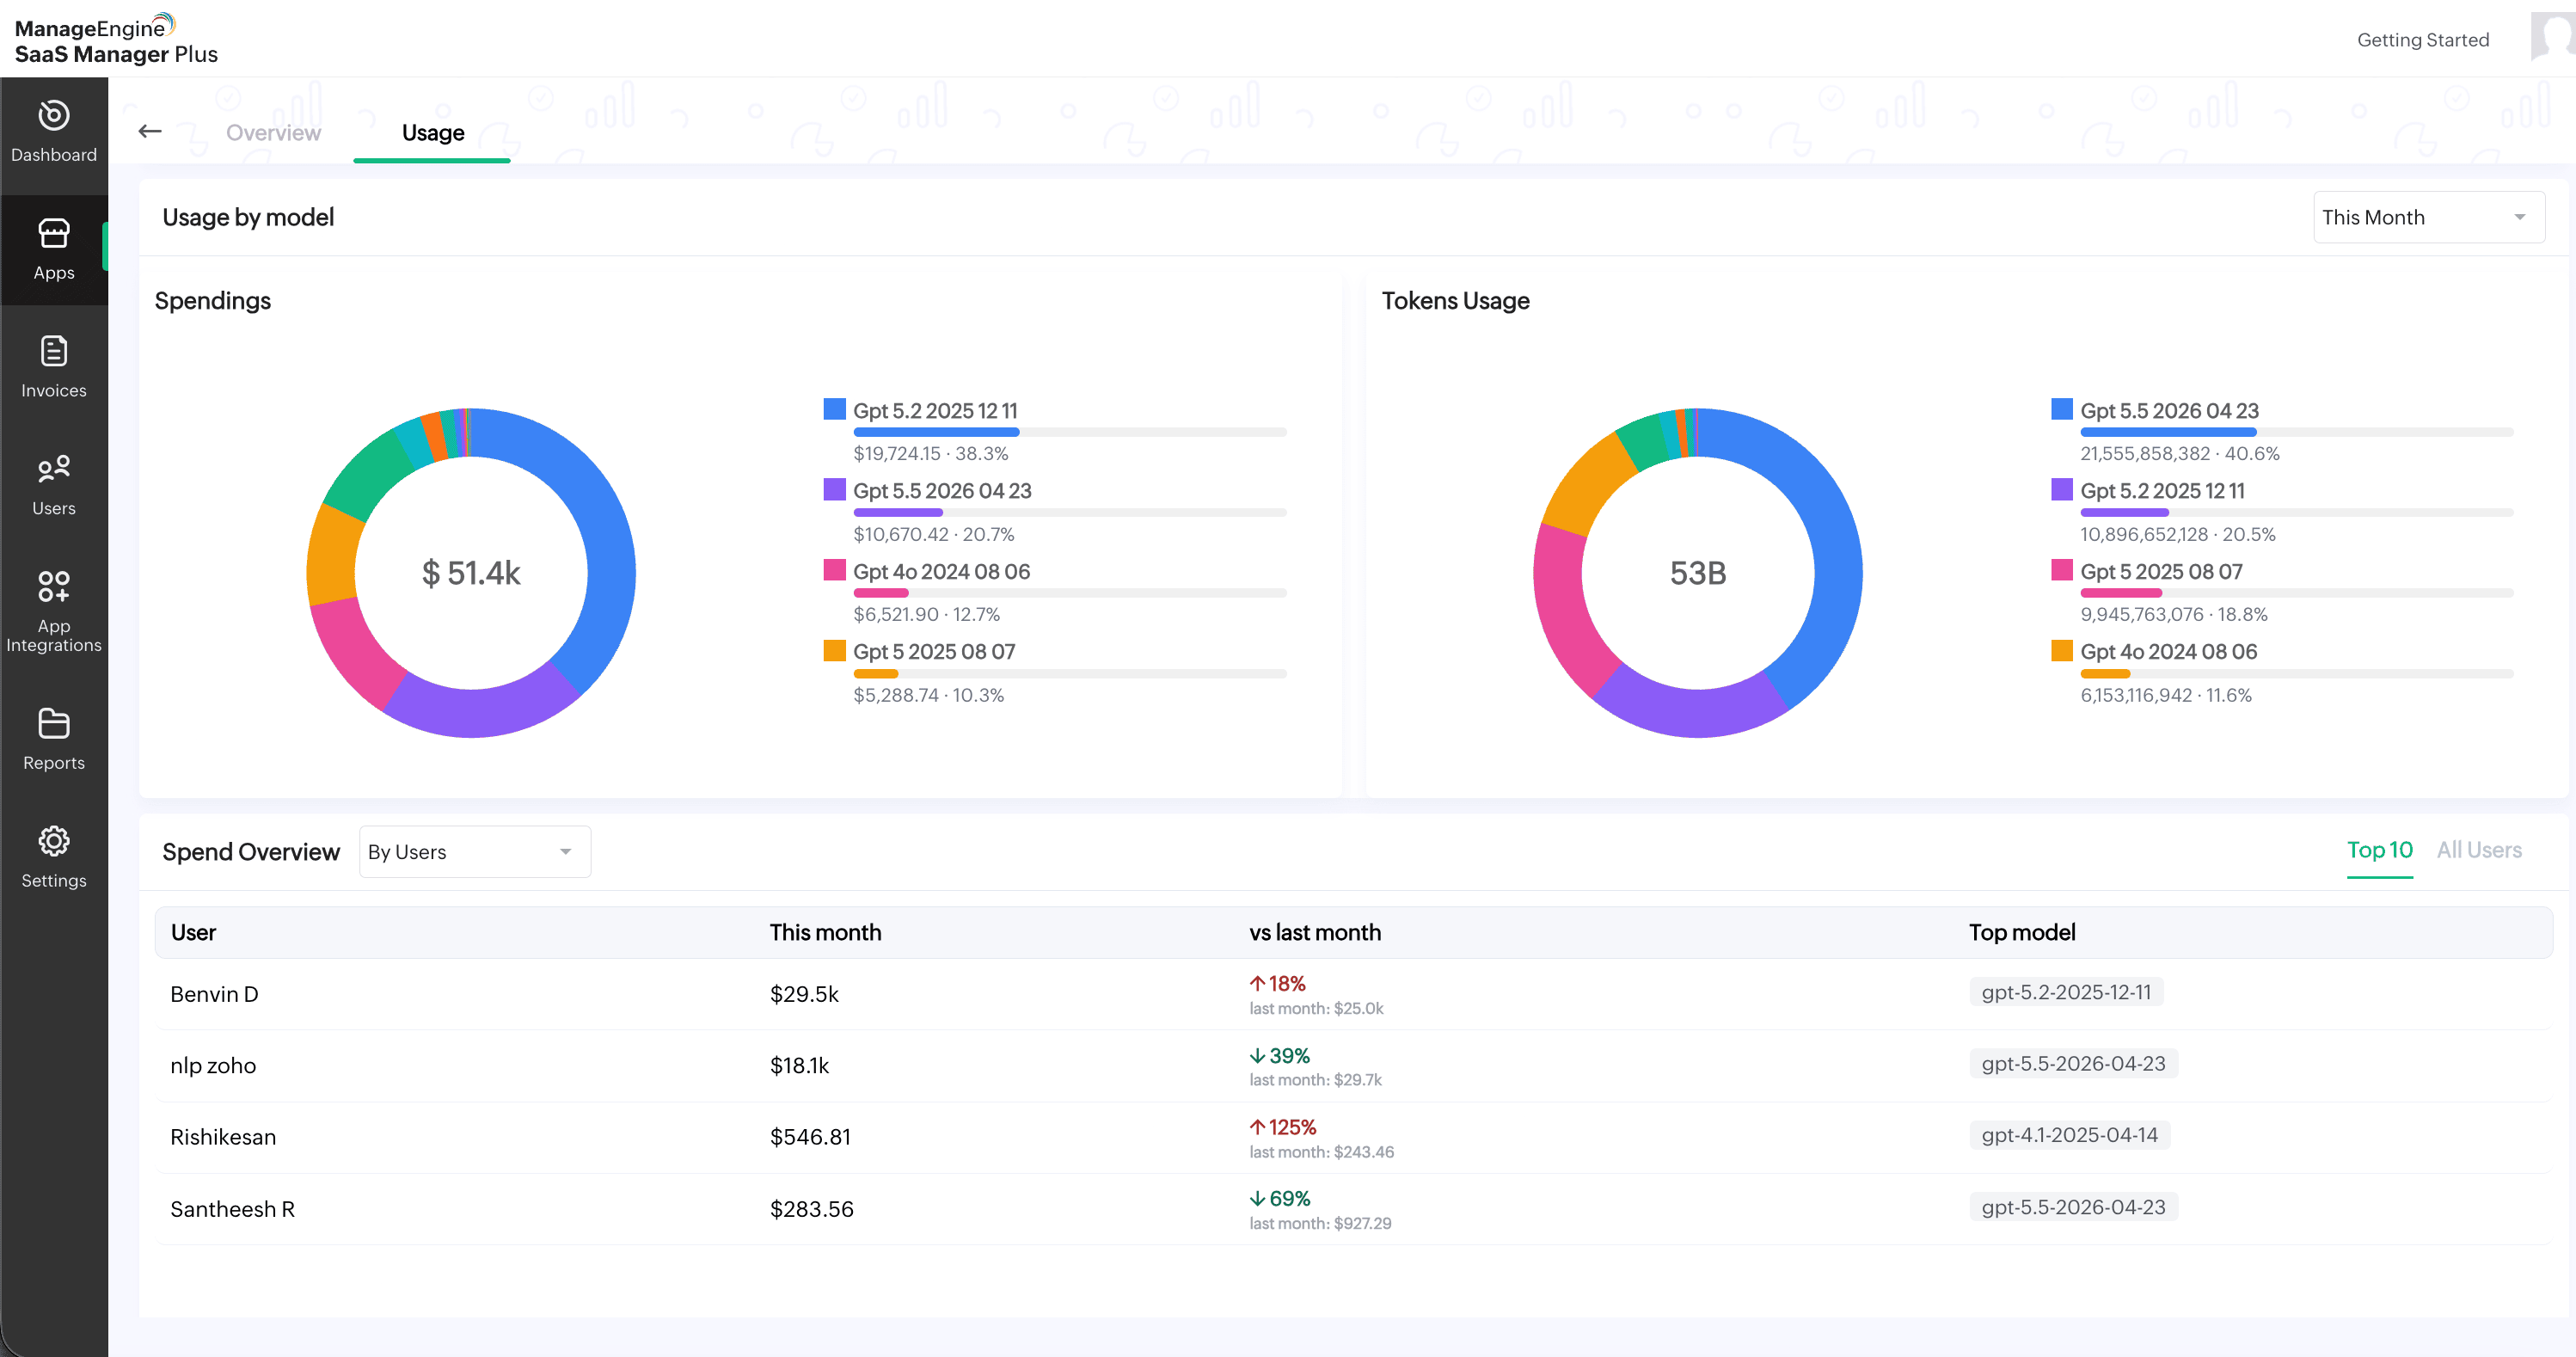
The Spend Overview section displays spend details by user, API key, or project. Use the drop-down available next to Spend Overview to switch between:
- By Users
- By API Keys
- By Projects
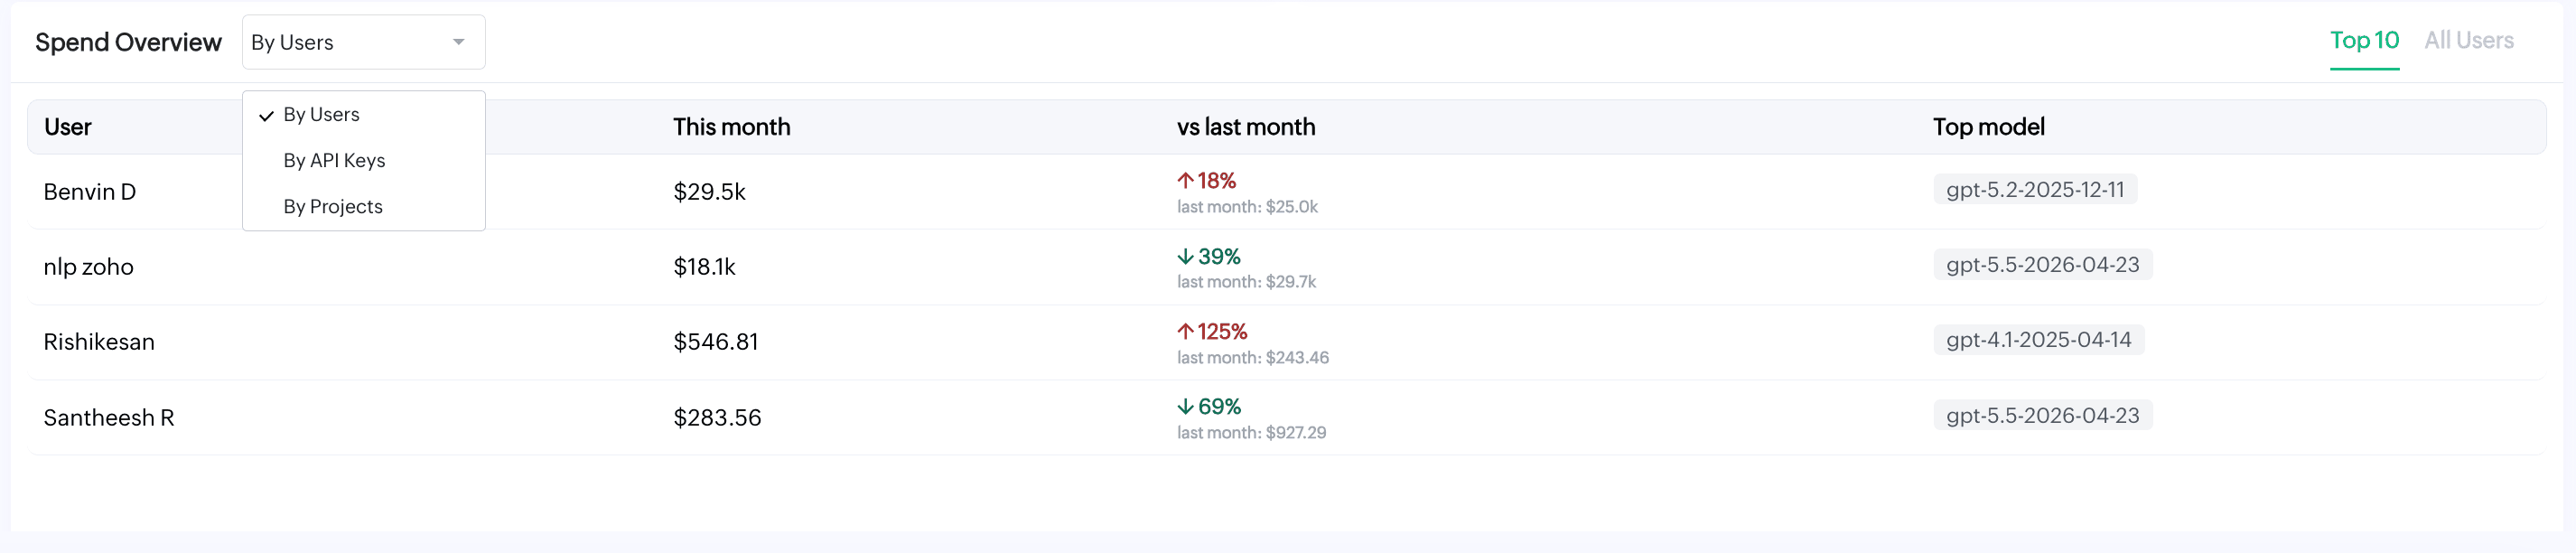
You can switch between Top 10 and All Users to view the required list.
The Spend Overview table displays spend details for the selected grouping, including this month's spend, comparison with last month, and top model.
Viewing Cursor usage
To view Cursor usage
- Select the Cursor app from the list.
- Click the Usage tab available next to Overview.
- The Usage tab provides detailed insights into Cursor spend, token usage, model-level usage, and user-level spend distribution.
The top summary cards display the following details:
- Spend: Shows the total Cursor spend for the current month.
- Avg Daily Spend: Shows the average daily spend for the current month.
- Tokens: Shows the total number of tokens used for the current month.
- Top Model: Displays the model with the highest usage or spend for the current month.

A Data available from date is displayed below the summary cards to indicate the starting date from which usage data is available.
The Spend & Tokens Trend chart displays the spend and token usage trend over time. Use the time filter available in the top-right corner of the chart to view usage for a specific period.
The Model Spend Overview section displays model-wise usage details, including:
- Model Name
- This month
- vs last month
- This Month Tokens
- Share %
The Usage by model section provides a visual breakdown of Cursor usage by model. It includes:
- Spendings: Displays the spend distribution across models.
- Tokens Usage: Displays the token usage distribution across models.
The User Spend Overview section displays user-level spend details. You can switch between Top 10 and All Users to view the required user list. The User Spend Overview table includes:
- User
- This month
- vs last month
- Top model