The platform supports Java, Microsoft .NET, PHP, Node.js, Ruby, Python, AWS, and Azure, covering the full range of application stacks that your clients run.
Application performance monitoring for MSPs
Get code-level visibility into client applications and deliver top-tier digital experiences across every account from a unified application performance monitoring (APM) solution built for MSPs.
Works with the stack you already have
ManageEngine supports every major language, framework, and infrastructure layer — out of the box, with no custom parsers or proprietary agents required.
Languages:
- Java
- Python
- NodeJS
- Go
- .NET
- Ruby
- PHP
- Rust
Frameworks:
- Spring Boot
- Django
- FastAPI
- Express
- Rails
- Laravel
- Gin
- NestJS
Infrastructure:
- Kubernetes
- Docker
- AWS
- Azure
- GCP
- AWS Lambda
- Cloud Run
- Bare Metal
Databases & Messaging:
- PostgreSQL
- MySQL
- MongoDB
- Redis
- Elasticsearch
- Kafka
- RabbitMQ
- SQS / SNS
Alerting & Incident Response:
- Zoho Cliq
- Slack
- Teams
- Jira
- GitHub
- ServiceNow
- Webhooks
APM capabilities
AI-driven APM capabilities built for multi-client service delivery
Monitor for and troubleshoot front-end and back-end performance issues across your clients' distributed environments. A unified APM solution gives your team code-level visibility, AI-powered alerts, and distributed tracing across every client application stack.
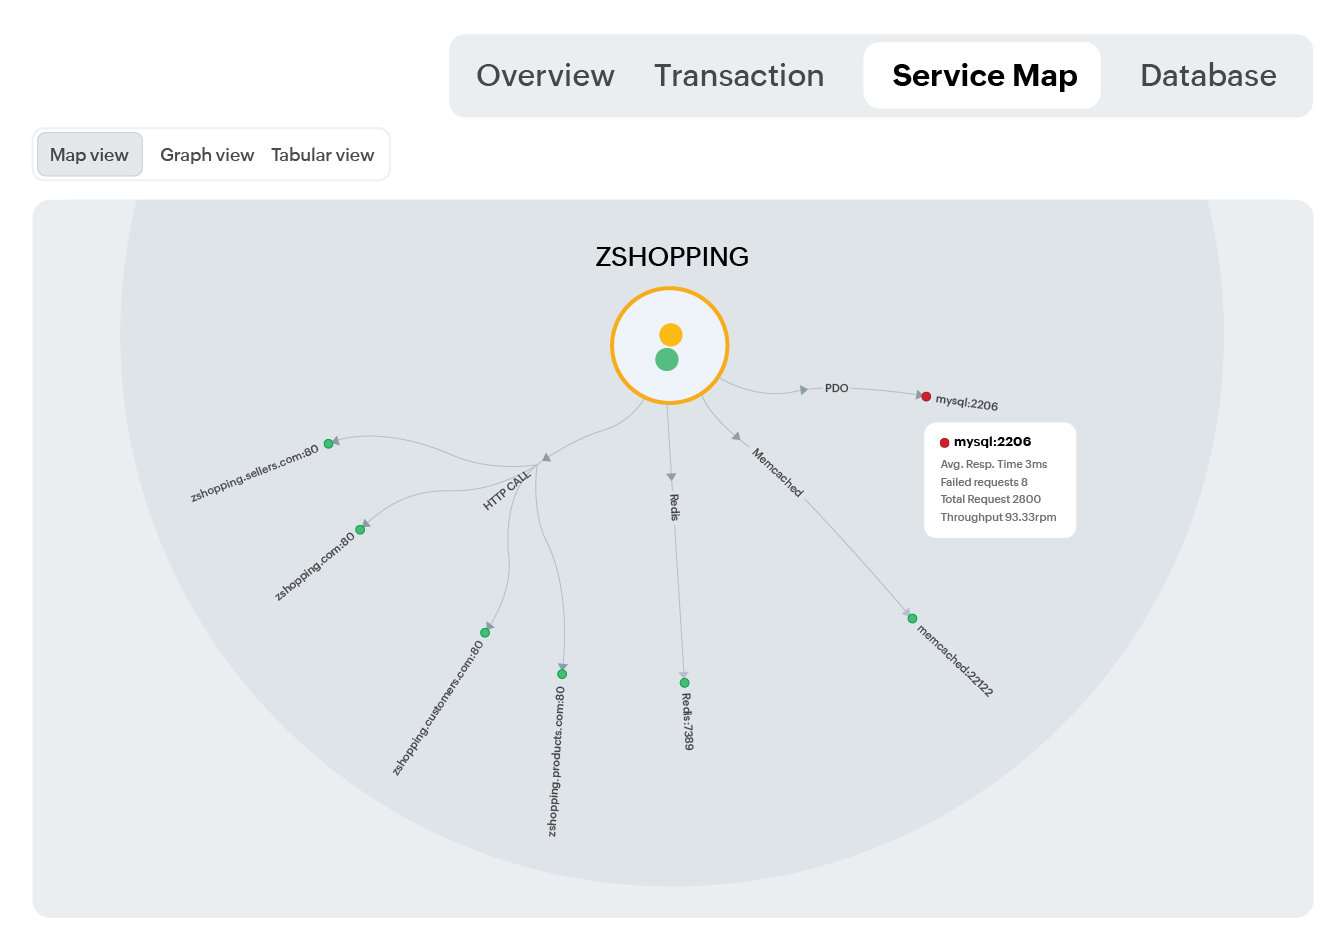
End-to-end application dependency mapping for client environments
Map every service, resource, and dependency within your clients' application architectures from a single view.
- Reduce client application downtime with complete dependency visibility
- Map service and resource interdependencies across every client application
- Spot transaction failures and isolate issues using dependency maps
- Fix bottlenecks faster with a full view of each client's application architecture
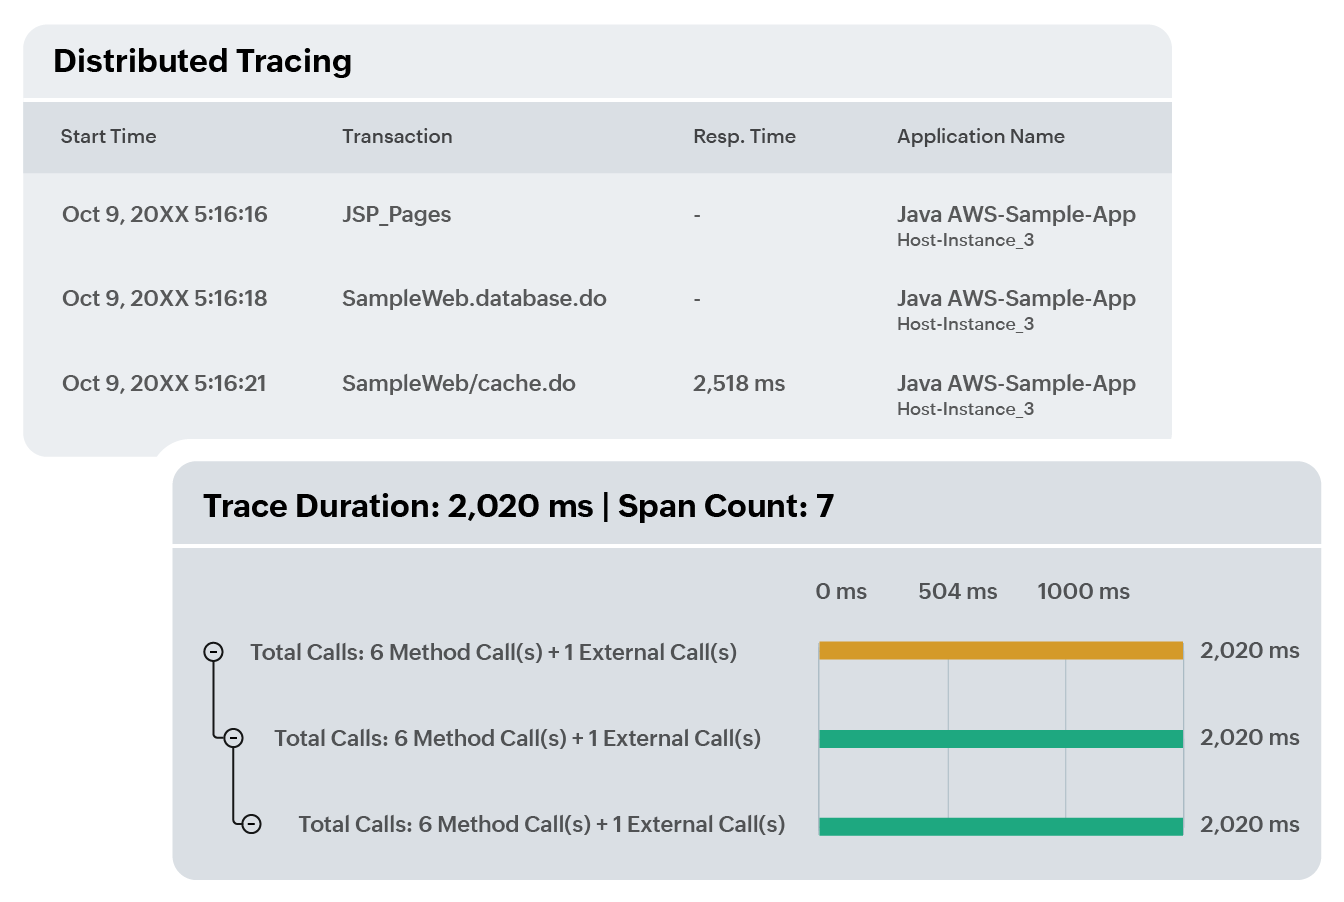
Distributed tracing that speeds up RCA for clients
Trace application transactions from start to finish across your clients' distributed cloud environments.
- Cut resolution times with end-to-end tracing across distributed client applications
- Visualize transaction flows to detect slow or failed components per client
- Pinpoint bottlenecks in code, database queries, and methods in real time
- View related logs, metrics, and system data together in one place
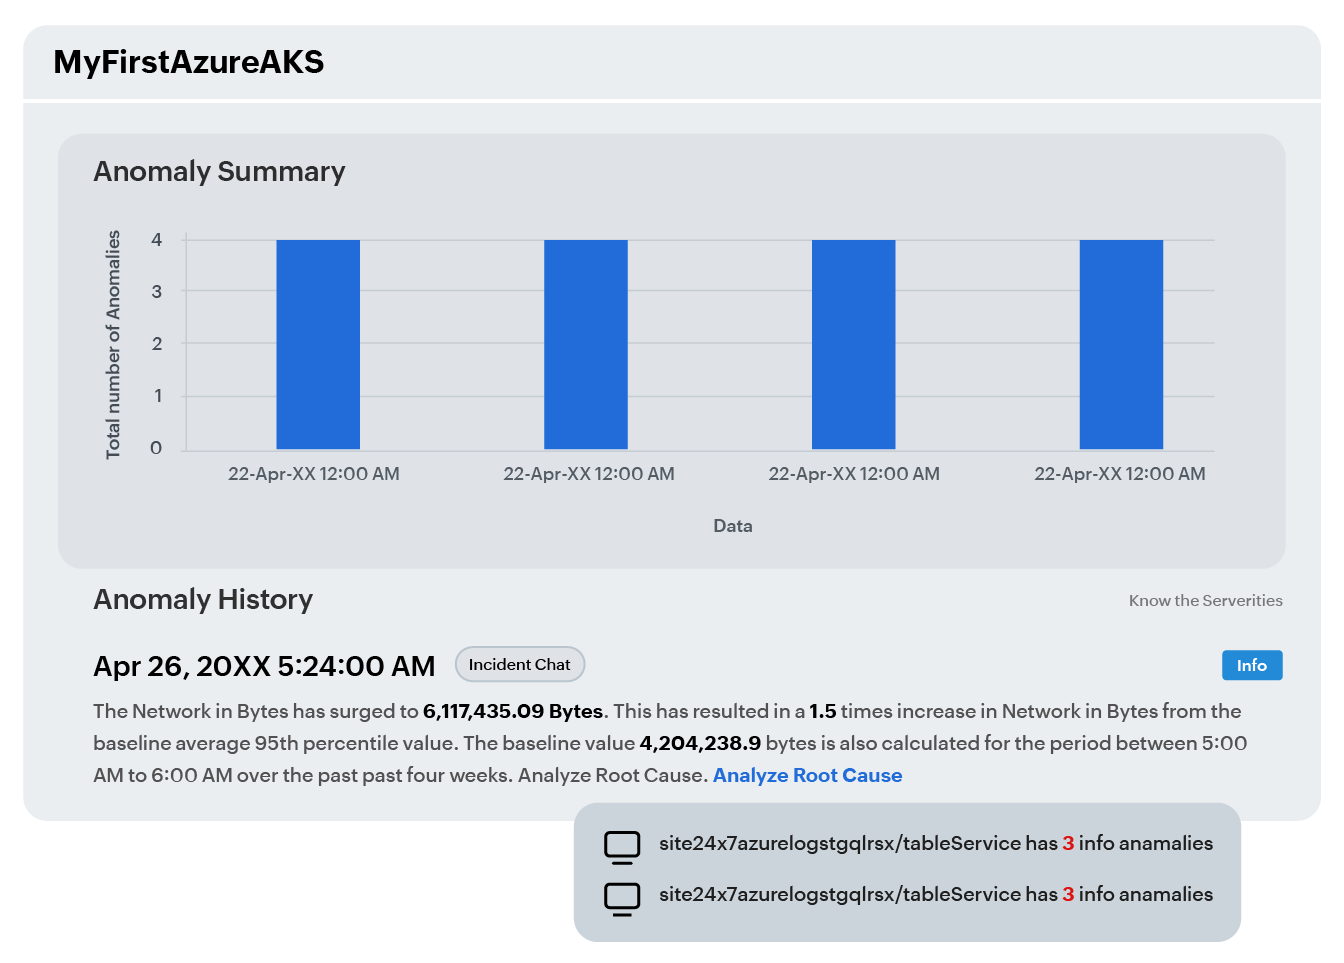
AI-powered alerts that reduce fatigue across your MSP team
Detect aberrations and performance deviations across your clients' applications before they affect end users.
- Forecast application resource trends to help clients plan capacity ahead of demand
- Generate AI-powered RCA reports that trace every performance issue to its root cause
- Correlate application events across client accounts to surface the most critical issues first
- Use ADDM to auto-discover and map application dependencies across client environments
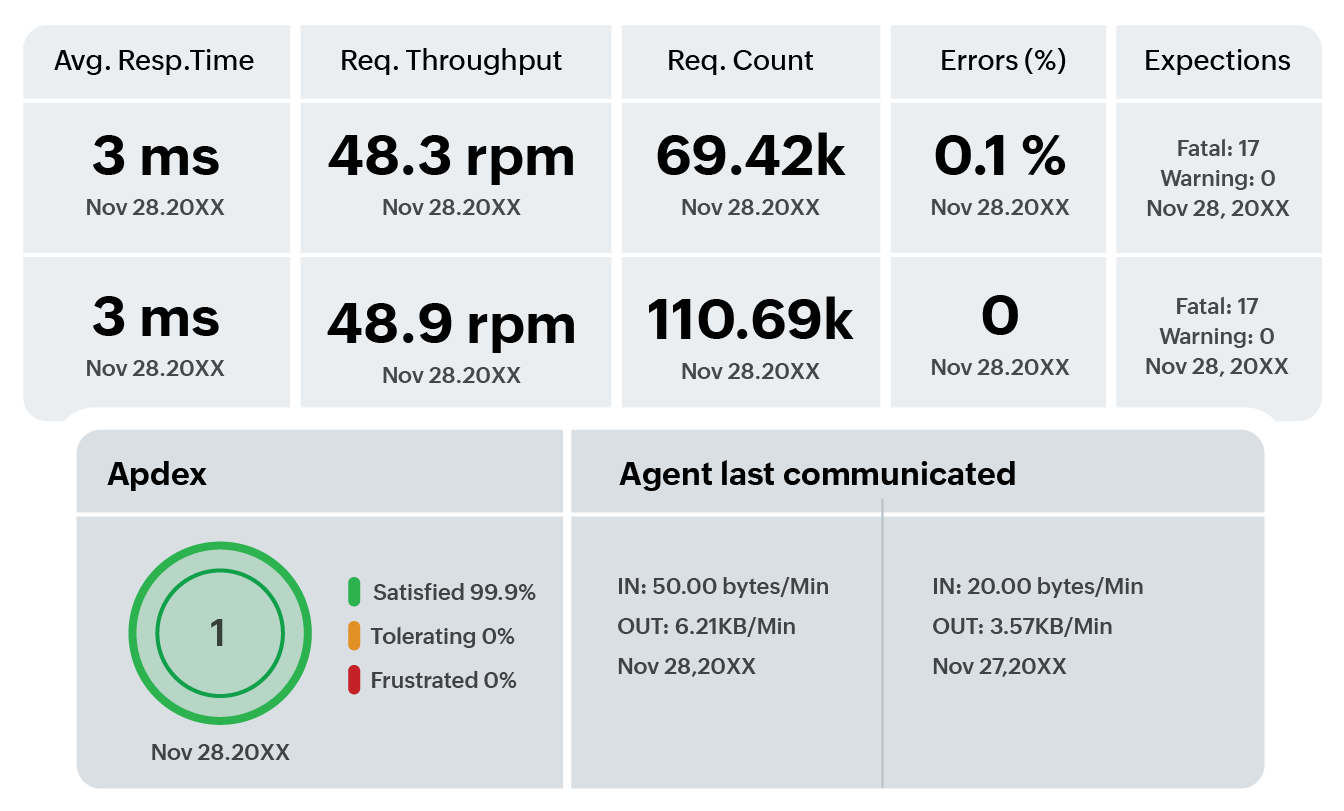
Post-deployment tracking that protects clients' user experiences
Track real-time user interactions after every deployment across your clients' applications.
- Protect clients' user experiences by catching post-deployment issues in real time
- Track user interactions after every deployment across all client applications
- Use end-to-end tracing and journey insights to improve client satisfaction scores
- Correlate application slowdowns with infrastructure issues for full deployment visibility
Why MSPs choose OpManager Nexus for application performance monitoring
Purpose-built for MSPs delivering uninterrupted services to multiple clients, this platform gives your team the tools to manage, report on, and scale APM across every client application account.

Multi-tenancy
Manage multiple client accounts from a single console with full account isolation. Scale to any number of customers without adding complexity to your operations.

White labeling
Rebrand the monitoring platform and all client-facing reports with your company name, logo, and URL. Your clients see your brand throughout every interaction.

Role and permission management
Use operational roles to manage client accounts with precision. Unified licensing gives administrators full control over subscriptions, billing, upgrades, add-ons, and alert credits across all client accounts.

Automated incident remediation
Resolve event alerts automatically with IT automation workflows. Map multiple automation templates to your remediation process to keep client environments running without manual escalation.

Customizable dashboards
Build customized dashboards, NOC views, and business views that surface the metrics your clients care about most. Give each client account a tailored monitoring view.

SLA reporting
Generate SLA performance charts and graphs for each client account. Schedule and send SLA reports that demonstrate your service consistency over time.

Single-console monitoring
Detect performance issues across servers, applications, network devices, and cloud resources across all client accounts in real time from one centralized dashboard.

AI-powered capacity forecasting
Analyze historical performance patterns and resource usage trends across client environments to anticipate capacity demands and plan proactively.

Alerting and integrations
Receive alert notifications via SMS, email, voice calls, and more. Integrate with Slack, Microsoft Teams, Jira, and other tools your team already uses.
Frequently asked questions
Which application platforms does this support?
How does the APM solution help MSPs manage multiple client accounts?
Multi-tenancy gives MSPs complete account isolation and a centralized view of every client application from a single console, with role-based access controls and unified licensing across all accounts.
Does the platform support post-deployment monitoring?
Yes. Real-time user interaction tracking and end-to-end tracing give your team full visibility into application behavior after every deployment, helping you catch issues before they affect clients' end users.
Don't let slow applications become
lost clients.
Start monitoring performance today with a 30-day free trial of OpManager Nexus.
Start your free trial