Yes. OpManager Nexus is built with multi-tenancy at its core, allowing MSPs to monitor and manage server environments across multiple client accounts from a single console with full account isolation.
Server monitoring for MSPs that scales with your clients
OpManager Nexus gives MSPs full visibility into client server health across application, mail, web, virtual, and database servers from one console.
What OpManager Nexus monitors across your client server stack
OpManager Nexus covers the full breadth of your clients' server environments. Whether your clients run Windows workloads, Linux systems, virtualized infrastructure, or containerized applications, OpManager Nexus gives you a single pane of glass to monitor them all. MSPs managing multiple clients get consistent visibility without switching between tools or consoles.
Windows and Linux server monitoring
Consolidate critical performance data from Windows and Linux servers into one console, covering CPU utilization, memory consumption, disk usage, load average, and process-level thread and handle counts. Automated resolution handles availability and performance issues without requiring manual intervention from your team.
Server resource monitoring
Track changes to internal server resources, including URLs, ports, NTP configurations, files, directories, and system logs. Your team receives instant notifications so you can act quickly to prevent accidental data loss or catch unauthorized alterations before they escalate into larger incidents.
Virtualization and container monitoring
Discover and track VMware ESX/ESXi hosts, datastores, resource pools, Nutanix environments, and critical network components from a unified view. Extend coverage to Docker hosts, Kubernetes clusters, and broader container infrastructure, giving your team complete visibility across every layer of the stack.
Plug-in integrations for extended monitoring
Build custom plug-ins using Python, Shell, PowerShell, Batch, or VB scripts to capture the specific metrics required by each client environment. You can integrate with over 150 ready-to-install plug-ins spanning tools such as Apache, Cassandra, and Nagios, and stay hassle-free.
Comprehensive server monitoring built for MSPs
Microsoft Apps
Exchange, IIS, SQL, Windows Backups, Office 365, Active Directory, Failover Cluster, SharePoint, and Hyper-V
Linux Flavors
Ubuntu, Debian, Red Hat, CentOS, Rocky Linux, Oracle Linux, AlmaLinux, Amazon Linux, SUSE, Fedora, OSX, FreeBSD, IBM AIX, Oracle Solaris, Raspberry Pi, Mandriva Linux, CoreOS, Gentoo Linux & Alpine Linux
Core capabilities of OpManager Nexus server monitoring
Unified server metrics and log visibility for every client
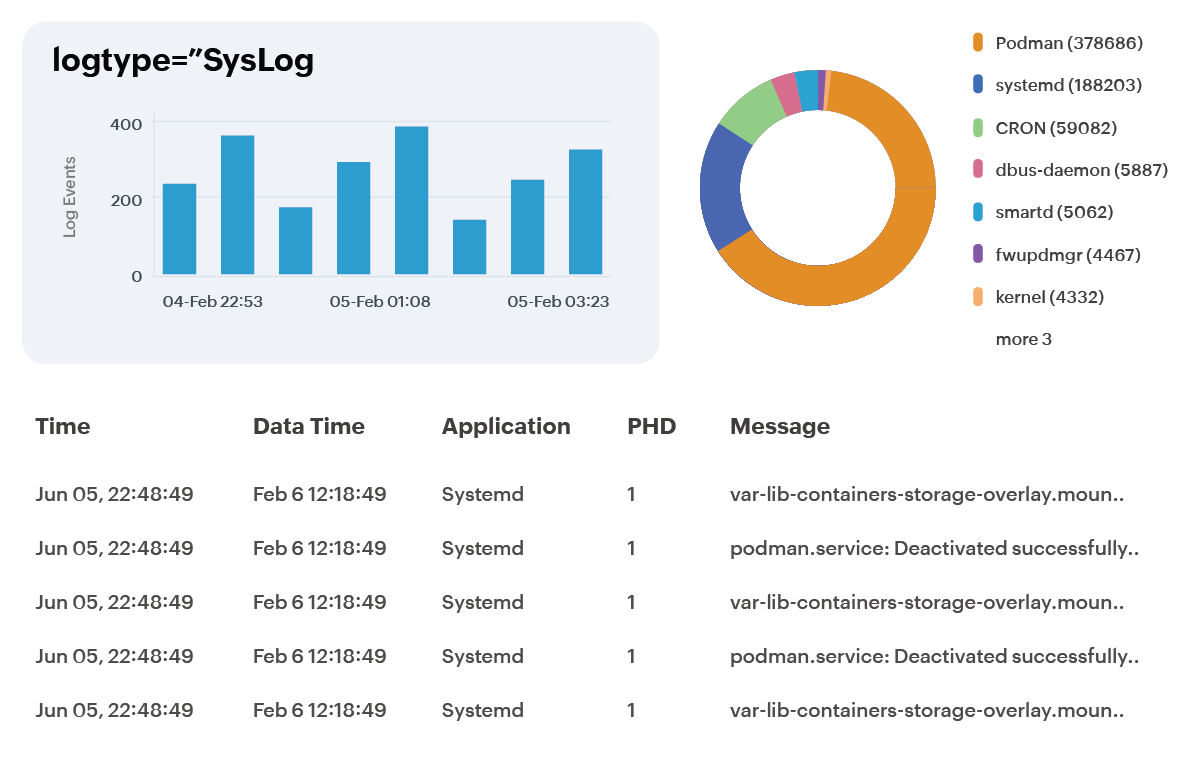
Aggregate syslogs, event logs, application logs, and cloud logs into one view per client.
- Catch issues before they reach your clients with unified log correlation
- Monitor uptime, CPU, and memory across all client server environments
- Aggregate syslogs, event logs, application logs, and cloud logs in one view
- Correlate events across client accounts to detect patterns proactively
Prevent client outages with service and process monitoring
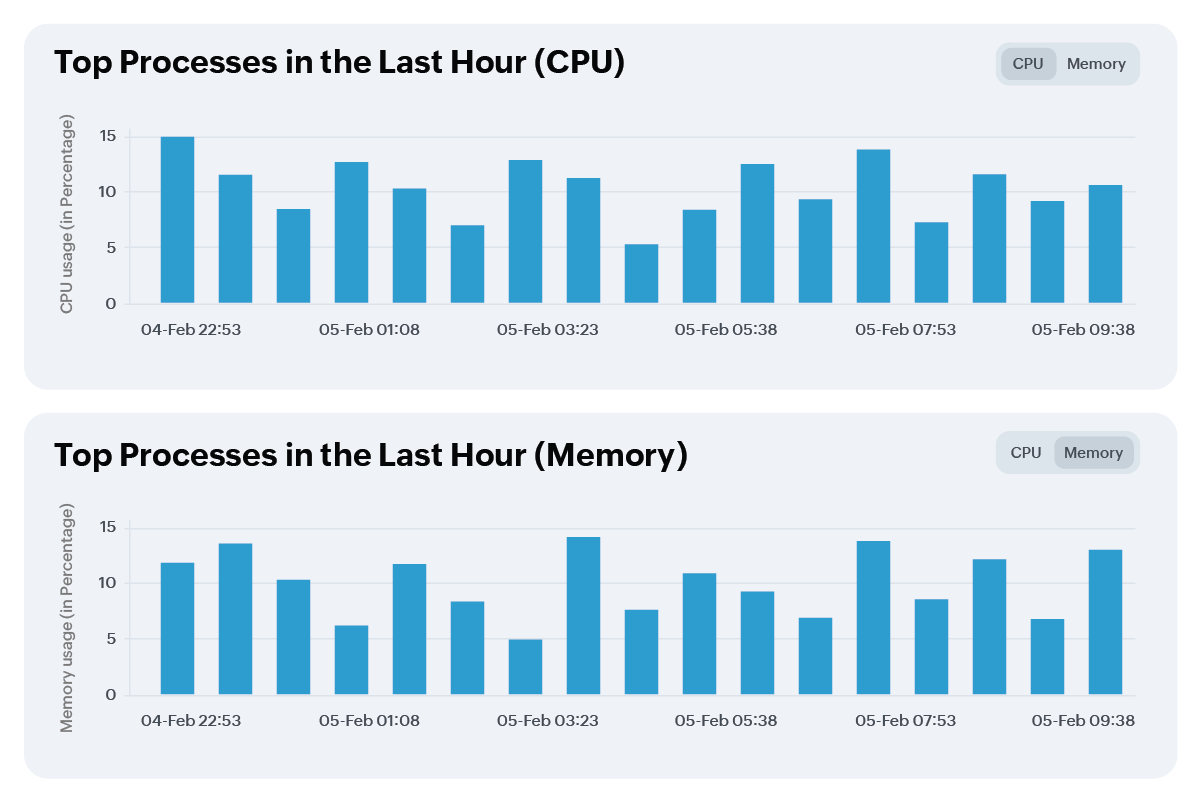
Track service and process behavior across your clients' servers and flag issues before they become incidents.
- Prevent client outages by identifying service instability before it escalates
- Use the Top Process chart to identify resource-draining services per client
- Monitor latency, thread count, disk I/O, and handle count in real time
- Prevent server overloads across multi-client environments with threshold alerts
Cross-stack infrastructure visibility on-premises, cloud, and hybrid IT
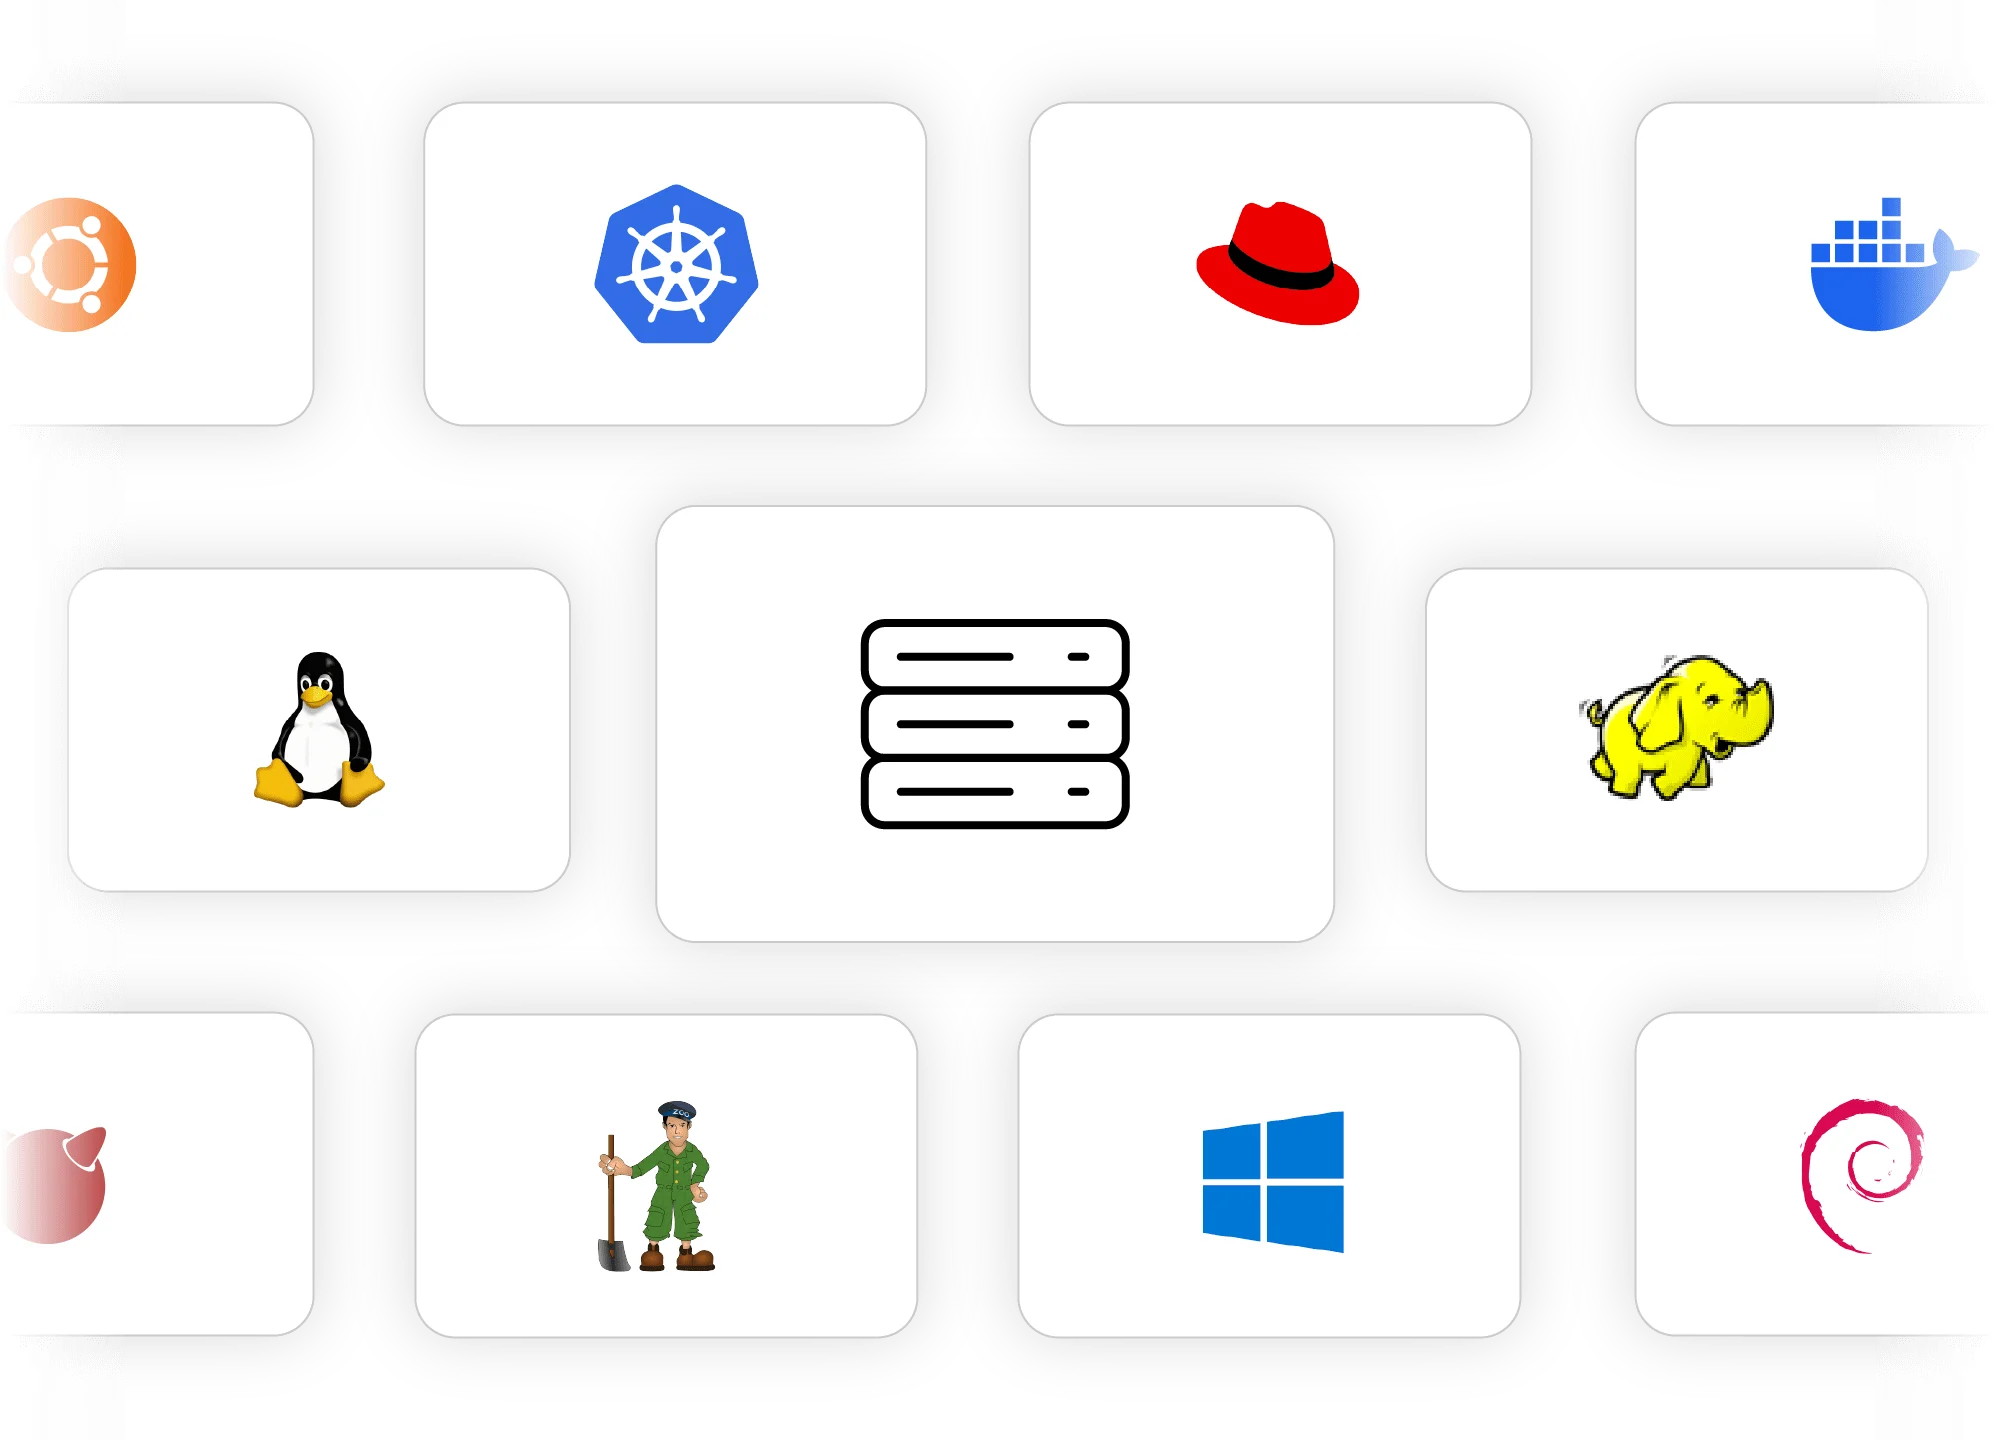
Monitor client servers across on-premises, cloud, and hybrid environments to facilitate interoperability.
- Eliminate blind spots across every layer of your clients' infrastructure
- Monitor on-premises, cloud, and container servers from a single console
- Correlate cross-stack metrics to identify dependencies in client environments
- Connect Prometheus, StatsD, and more than 300 plug-ins for full-stack coverage
Accelerate client issue resolution with AI-driven diagnostics
Transform reactive IT operations into proactive, self-healing workflows and automate remediation across your entire client stack.
- Detect anomalies across client server environments before they escalate into outages
- Forecast resource usage trends to help clients plan capacity ahead of demand
- Correlate events across client infrastructure to surface the most critical issues first
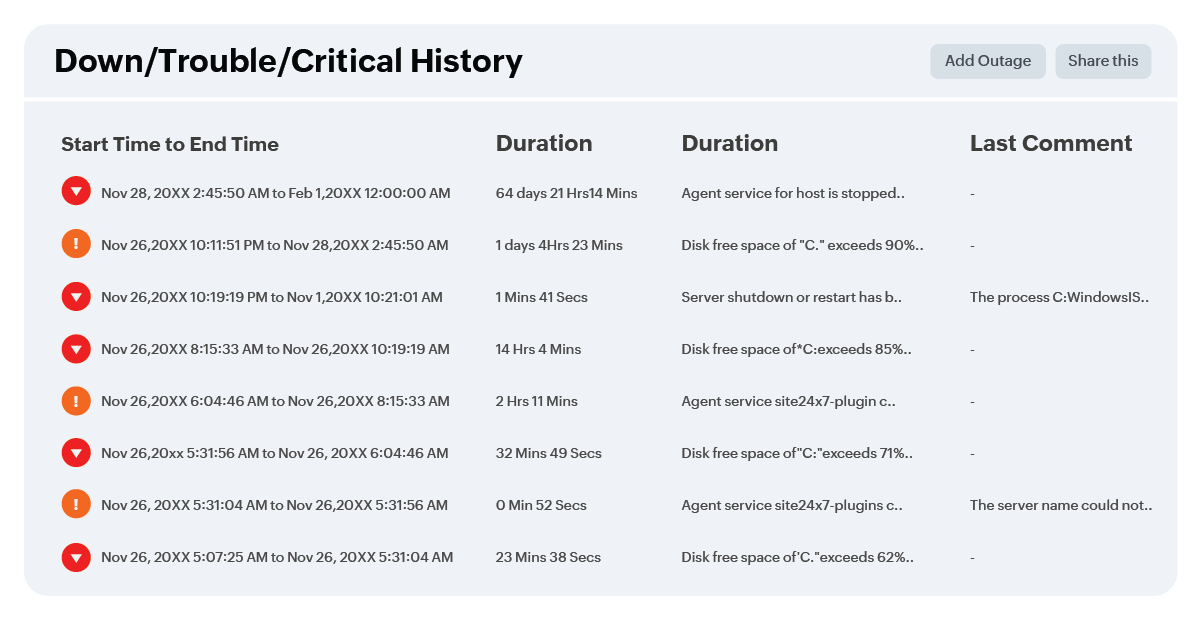
- Generate AI-powered RCA reports that pinpoint the root cause of every server crash
Why MSPs choose OpManager Nexus for server monitoring
OpManager Nexus is purpose-built for MSPs aiming to deliver uninterrupted service to multiple clients. It gives your team the tools to manage and report on every client account without sacrificing visibility or control.

Multi-tenancy
Manage multiple client accounts from a single console with full account isolation. Scale to any number of customers without adding complexity to your operations.

White labeling
Rebrand the monitoring platform and all client-facing reports with your company name, logo, and URL. Your clients see your brand throughout every interaction.

Roles and permissions management
Use operational roles to manage client accounts with precision. Unified licensing gives administrators full control over subscriptions, billing, upgrades, add-ons, and alert credits across all client accounts.

Automated incident remediation
Resolve event alerts automatically with IT automation workflows. Map multiple automation templates to your remediation process to keep client environments running without manual escalation.

Customizable dashboards
Build customized dashboards, NOC views, and business views that surface the metrics your clients care about most. Give each client account a tailored monitoring view.

SLA reporting
Generate SLA performance charts and graphs for each client account. Schedule and send SLA reports that demonstrate your service consistency over time.

Single-console monitoring
Detect performance issues across servers, applications, network devices, and cloud resources across all client accounts in real time from one centralized dashboard.

AI-powered capacity forecasting
Analyze historical performance patterns and resource usage trends across client environments to anticipate capacity demands and plan proactively.

Alerting and integrations
Receive alert notifications via SMS, email, voice calls, and more. Integrate with Slack, Microsoft Teams, Jira, and other tools your team already uses.
Frequently asked questions
Can OpManager Nexus monitor servers across multiple client accounts simultaneously?
What server operating systems does OpManager Nexus support?
OpManager Nexus supports Windows, Linux (including Ubuntu, Red Hat, CentOS, Debian, and more), macOS, FreeBSD, IBM AIX, and Oracle Solaris, covering the full range of server environments your clients run.
Does OpManager Nexus support automated remediation for server issues?
Yes. OpManager Nexus uses remediation profiles and IT automation workflows to resolve server alerts automatically, reducing the need for manual intervention and improving mean time to resolve across client environments.
Don't wait for server issues
to become business problems.
Start monitoring today with a 30-day free trial of OpManager Nexus.
Start your free trial