DNS Query Forecasting Windows
Forecasting in DDI Central for DNS queries and DHCP leases allows network admins to forecast their organization network's DNS services performance by analyzing the historical data.
These dashboards provide visual summarization over the network trends, volumes, intensity and more.
Note: For minimum level of forecasting, historical data need to be under the following criteria
- 24 hours data forecast requires at least minimum two days historical data.
- 7 and 30 days data forecast requires at least minimum 14 days historical data.
- 3, and 6, and 12 month data forecast requires at least minimum of 4 months historical data.
For accurate forecasting, historical data needs to be double the forecasting time period:
- 7 day forecast requires 14 days of historical data.
- 30 days forecast requires 60 days of historical data
- 3 month forecast requires 6 months of historical data
- 6 month forecast requires 12 months of historical data
- 12 month forecast requires 24 months of historical data
For even more accurate forecasting, DDI application in the network is expected to have consistent historical data for the projected time period of forecasting.
Ex: In order to forecast DNS queries for the next 30 days, the application need to have consistent data for the last 30 days for accurate forecasting.
If theres a significant drop in the data input, the prediction may not be valid.
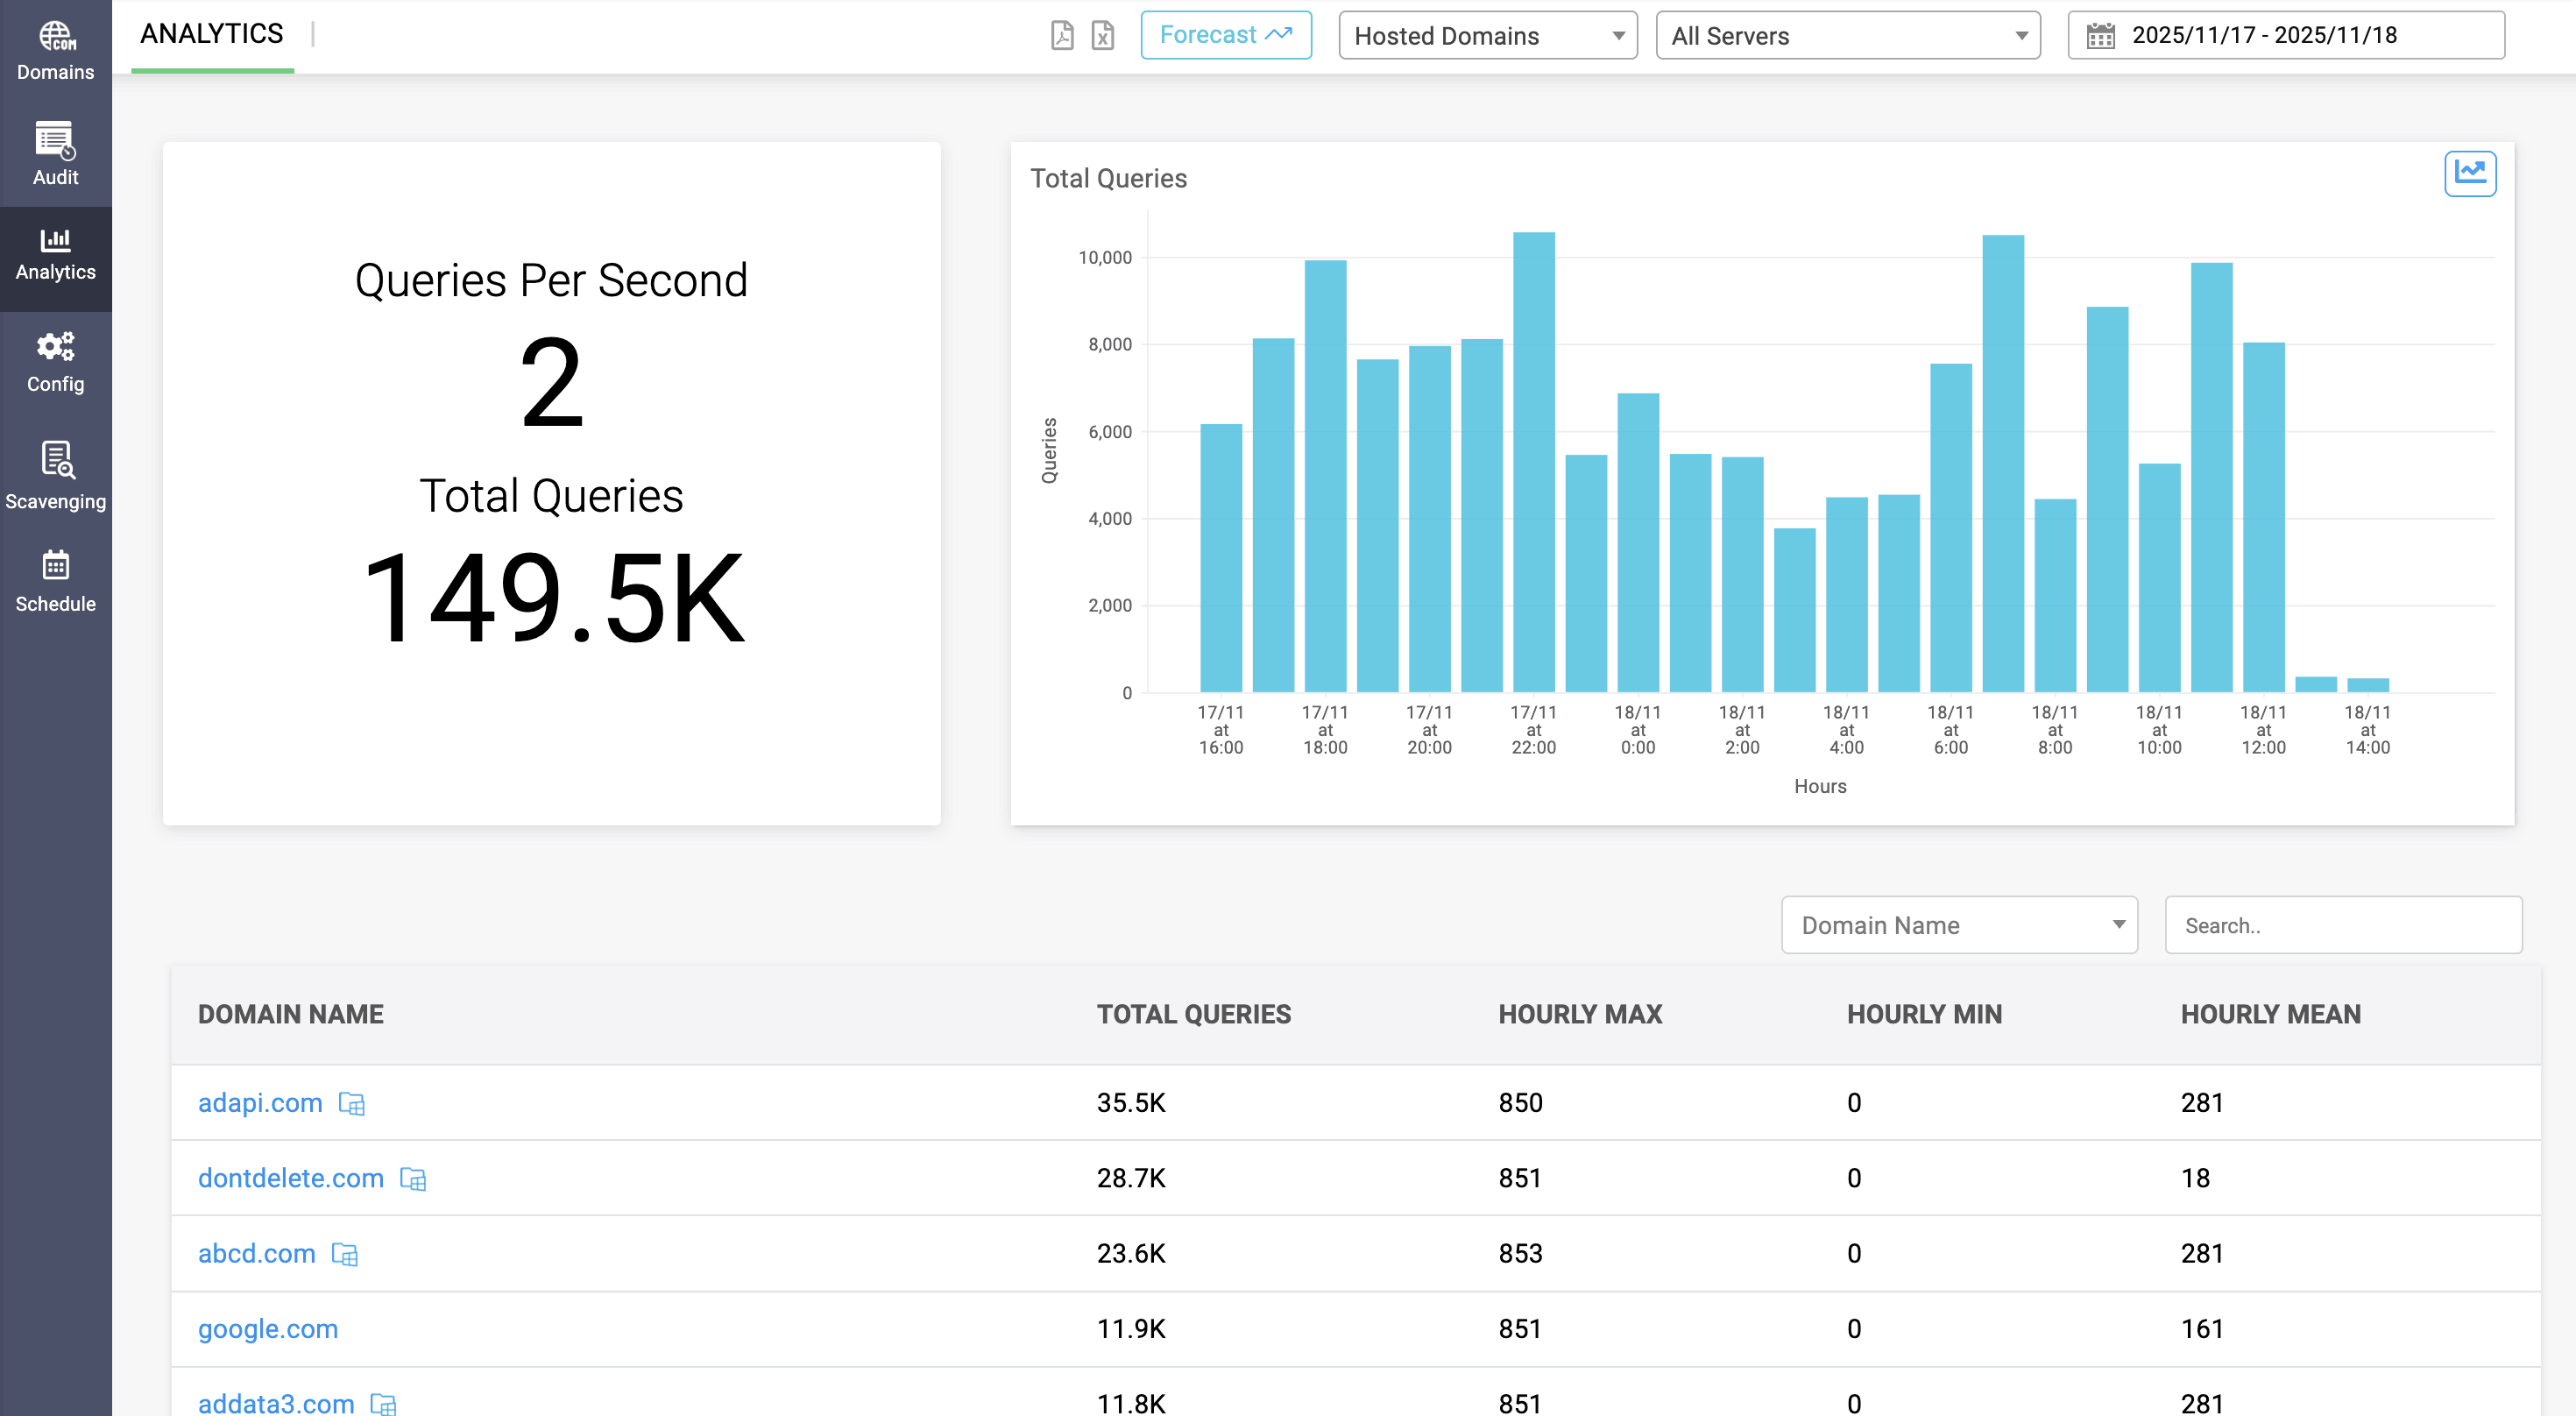
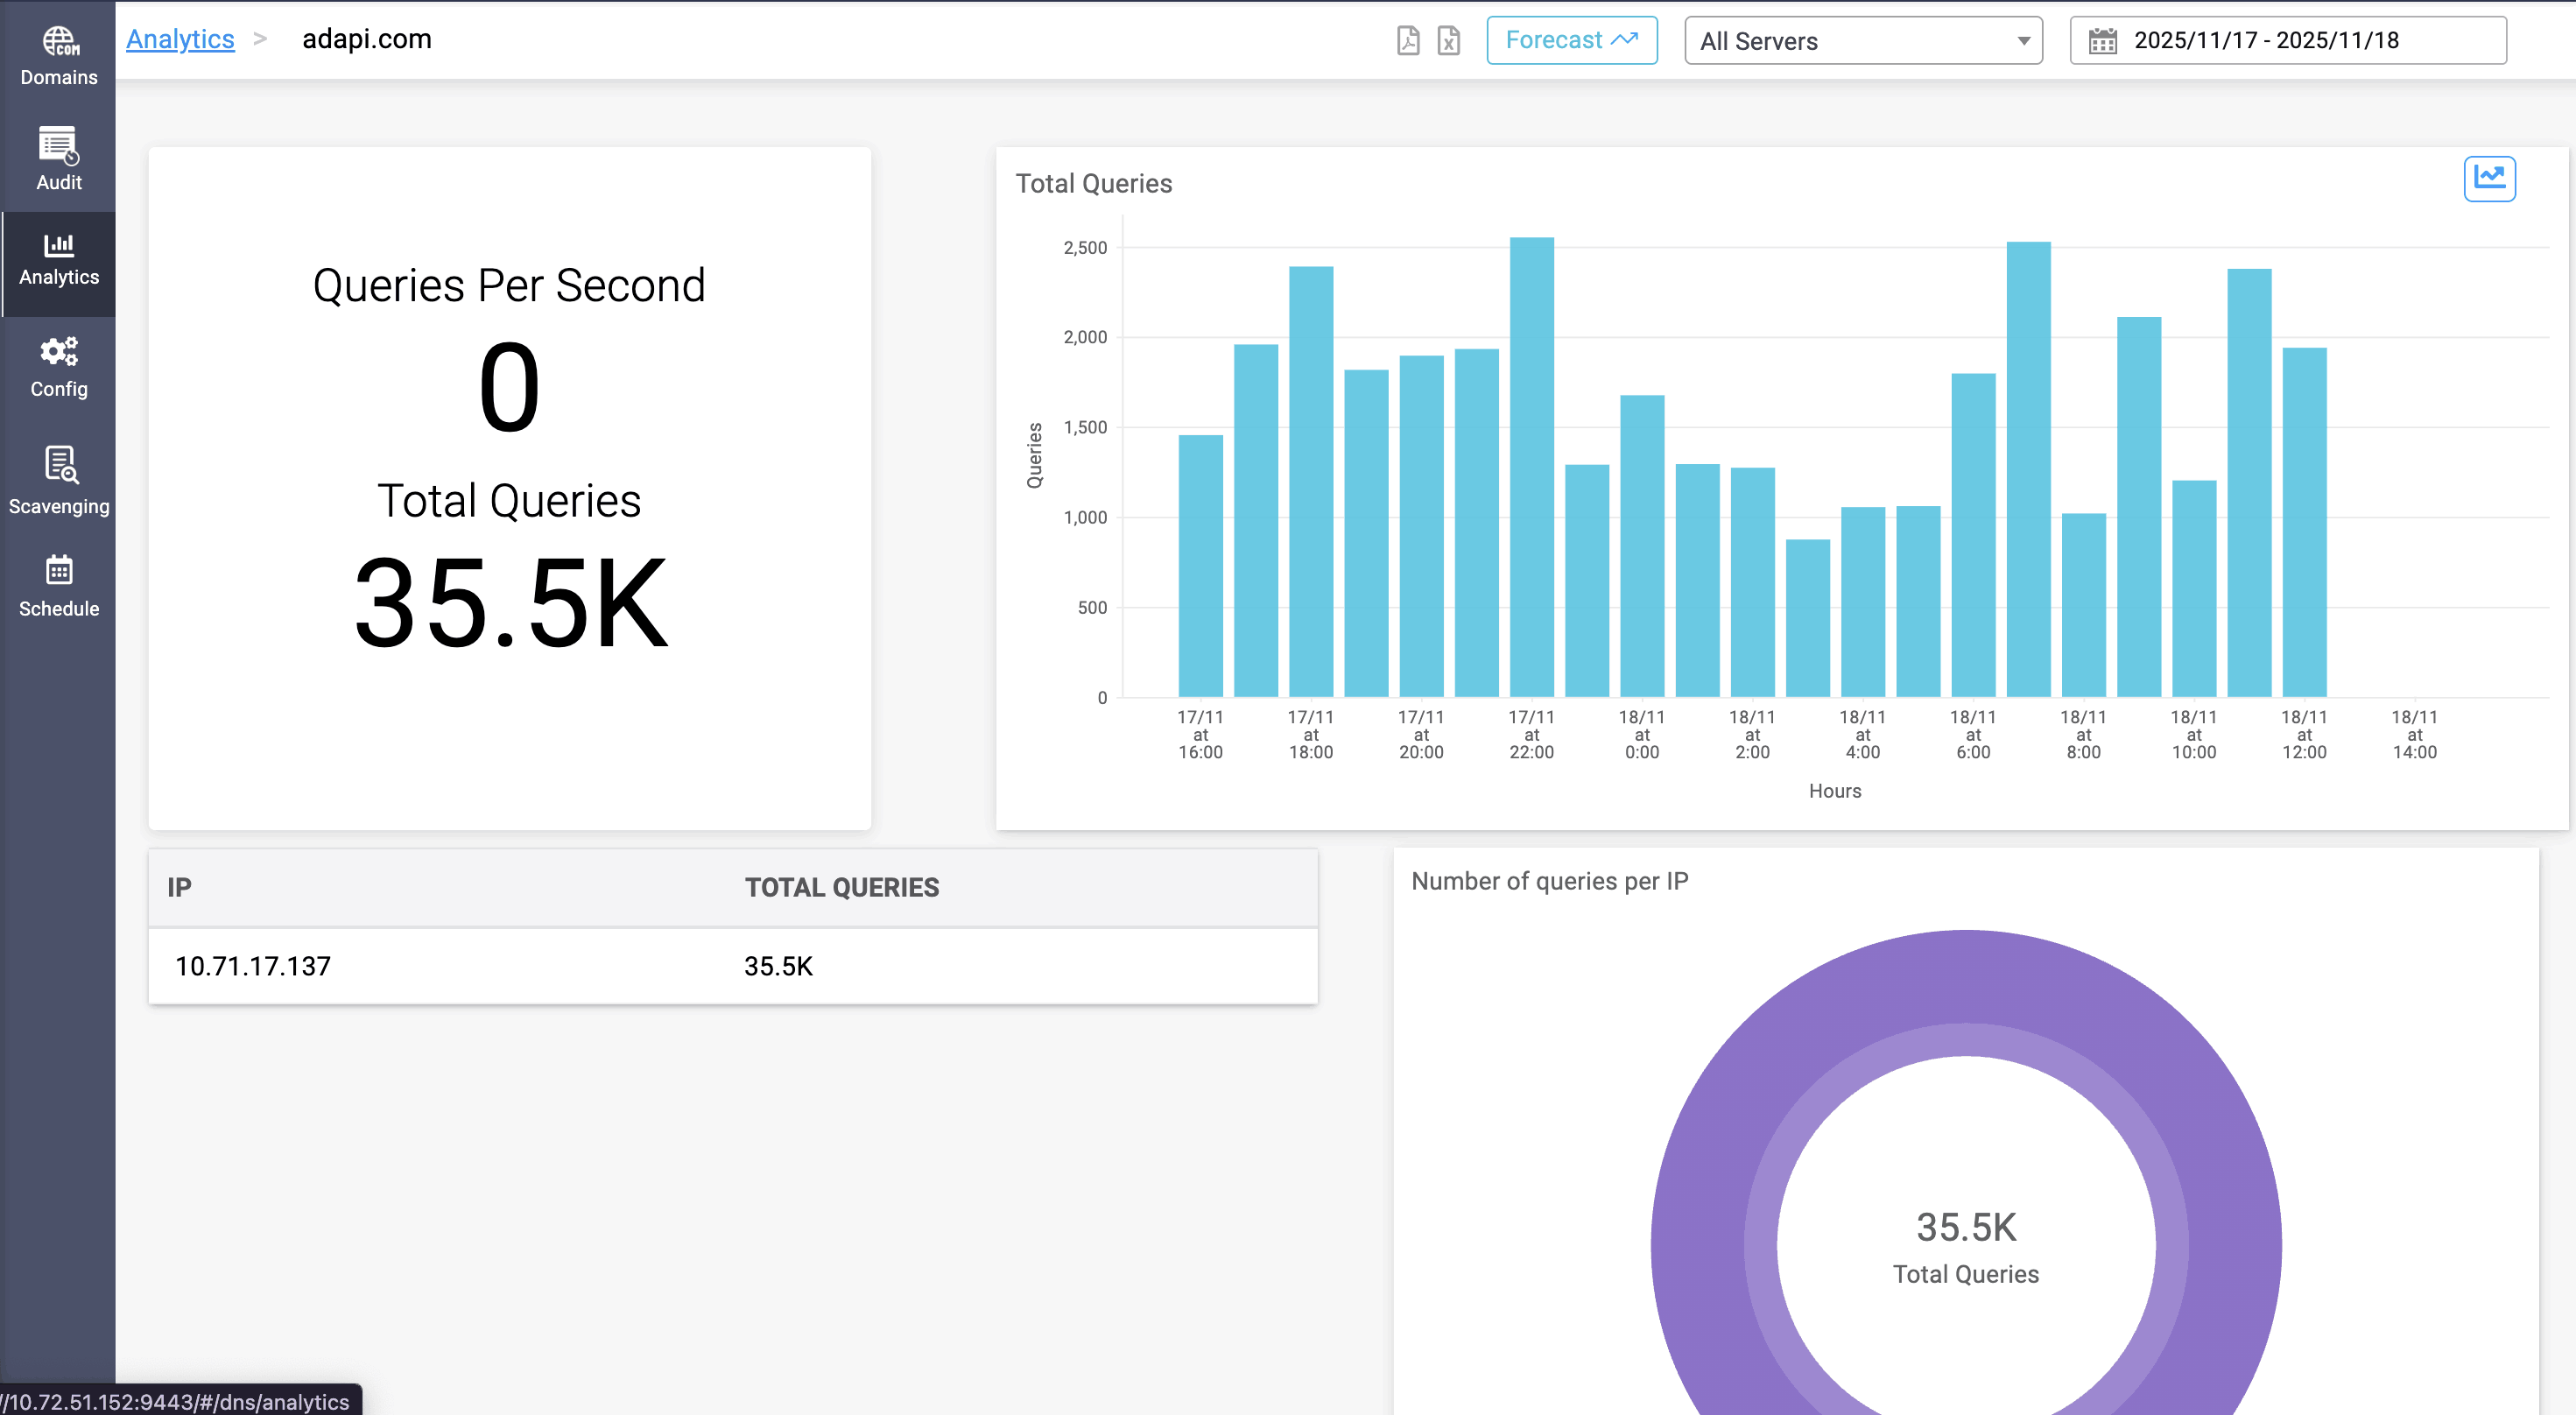
Forecasting for DNS can be viewed by clicking on the Forecast option on the top right menu in Analytics page.
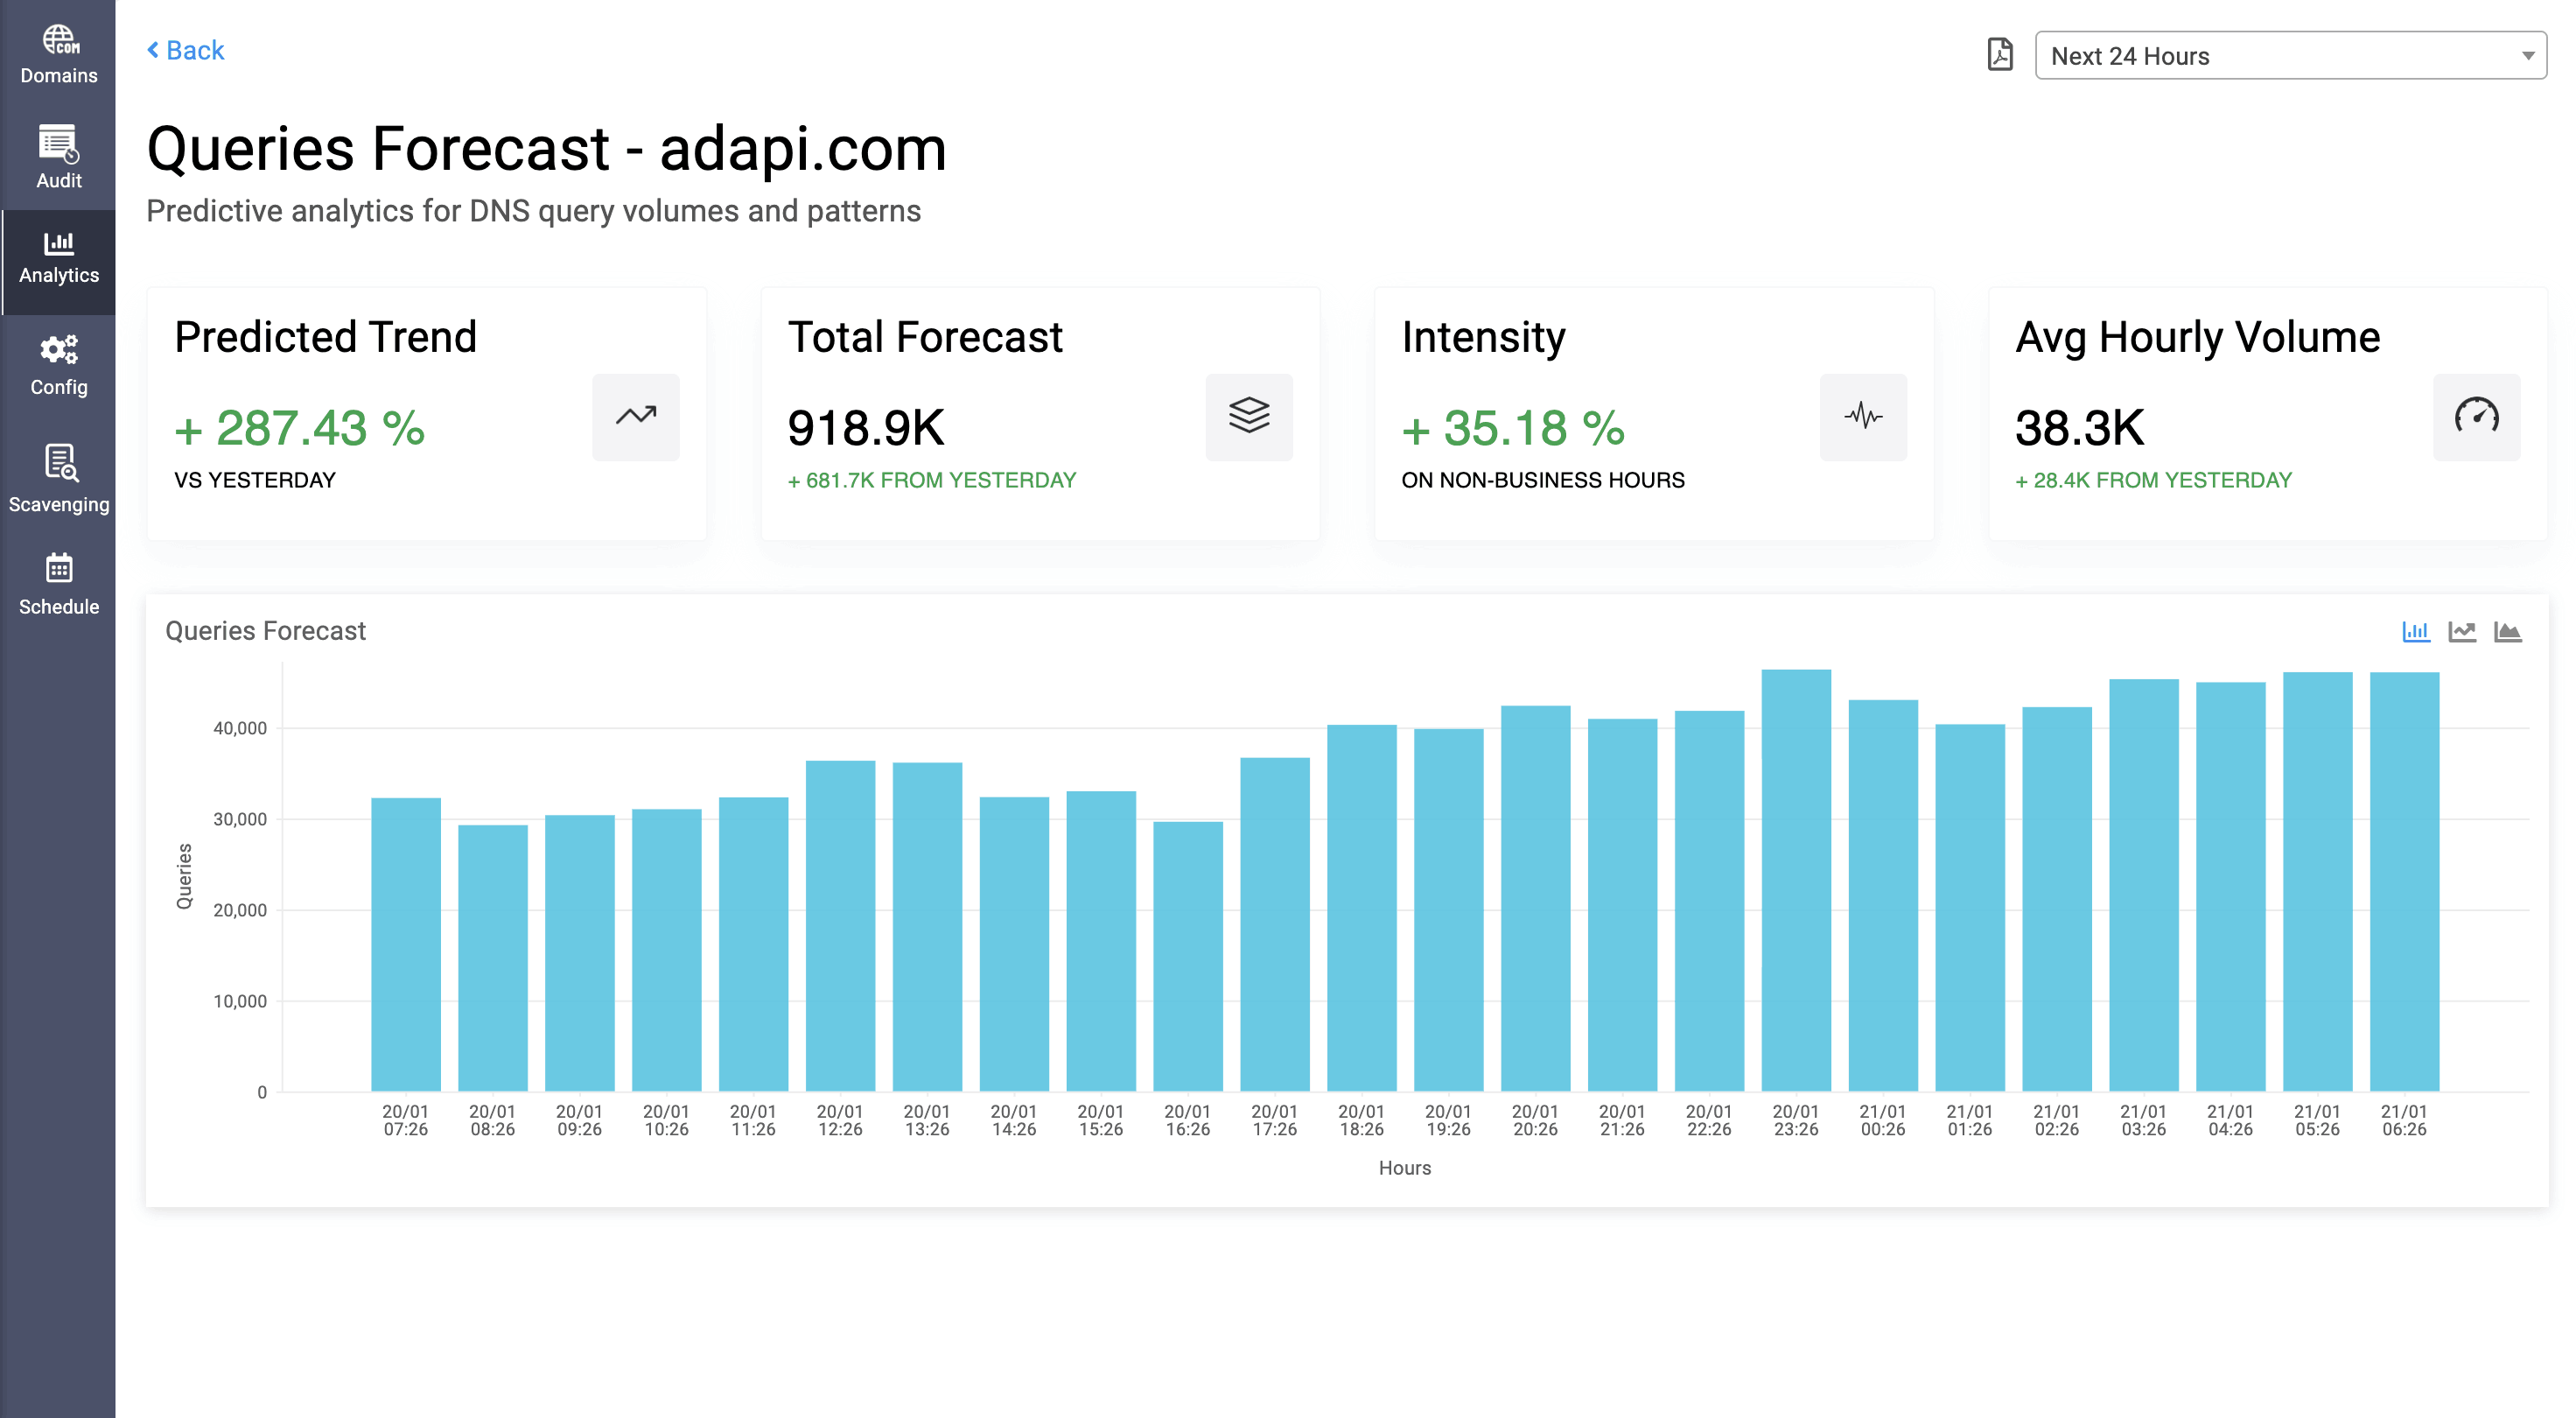
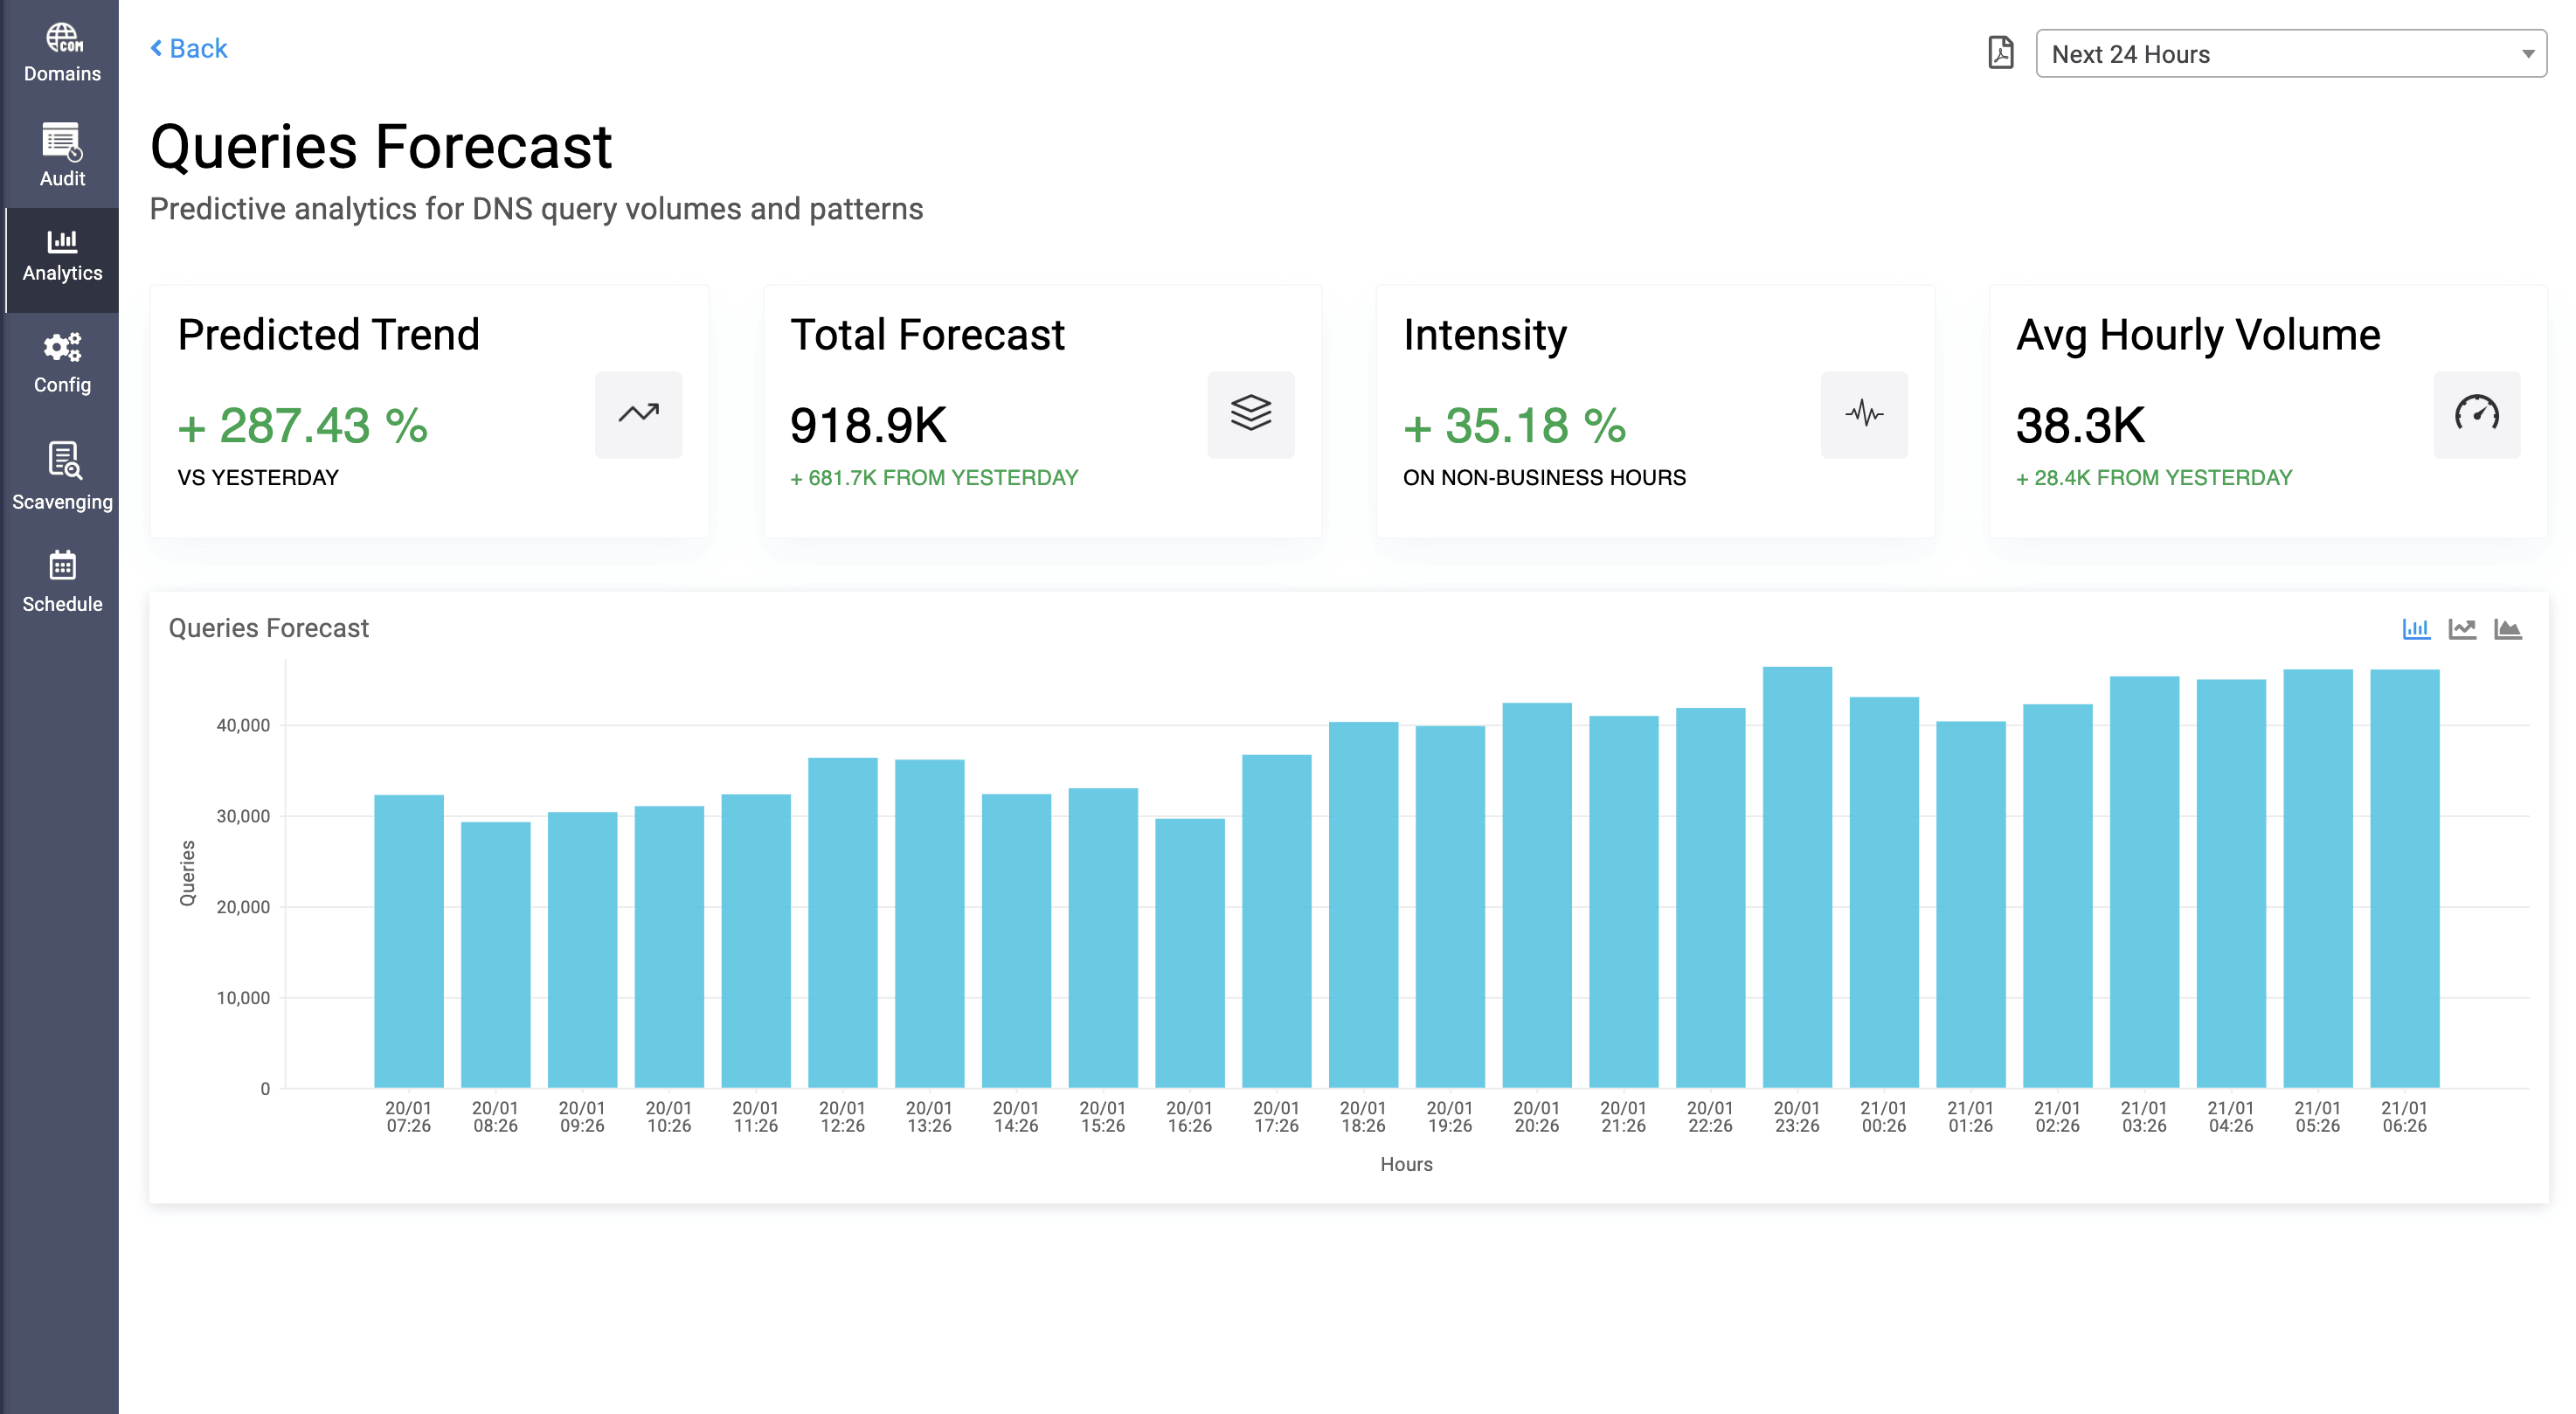
In DNS query forecasting, the dashboard shows the following data:
- Predicted Trend: Percentage value of predicted spike or downgrade in DNS query count compared to the historical data.
- Total Forecast: The total increase or decrease in the query count that is predicted based on the historical data.
- Intensity: The increase or decrease in the query count on business hours (9-6) and non-business hours in hourly basis, and for daily basis, it is based on business days and non-business days.
- Average Volume: Average increase or decrease in query volume per time metrics configured, that is predicted based on the historical data.
DNS query forecasting data can be exported as PDF.
Admins can also view DNS query forecasting for individual domain by selecting specific domain in Analytics page and selecting Forecast option.