Turn insight into action: AI-driven observability, automation & assurance
In today’s dynamic enterprise landscape, IT operations must evolve from reactive troubleshooting to proactive insight. As hybrid clouds, microservices, and distributed architectures redefine modern infrastructure, delivering seamless digital experiences now hinges on deep and intelligent observability.
Yet conventional monitoring tools often fall short. They provide siloed views, struggle to scale, or overwhelm teams with uncorrelated alerts that mask the root cause. What enterprises need is a unified observability platform — one that delivers contextual visibility across every layer of the IT ecosystem, intelligently connects signals to insights, and enables data-driven, automated responses when it matters most.
With a full-fledged observability solution, you can:
Gain comprehensive visibility
Streamline root cause analysis
Ensure reliable performance
Accelerate incident detection and resolution
Reduce overhead costs
Improve collaboration across teams
Observability redefines how enterprises understand and manage complex IT environments — empowering teams to move from simply monitoring what happened to uncovering why it happened, and proactively preventing it from happening again.
Our recognition in the 2025 IDC MarketScape
We’re proud to share that Zoho Corp. (ManageEngine) has been recognized as a Major Player in the IDC MarketScape: Worldwide Observability Platforms 2025 Vendor Assessment (doc # US53004325, November 2025). We believe this is a significant acknowledgment of our investment and success in bringing AI-powered observability practices to enterprises around the globe.
We believe being included in the IDC MarketScape underscores ManageEngine’s strengths in areas such as:
- End-to-end observability & event correlation across hybrid and cloud-native environments
- AI/ML-driven anomaly detection, root cause analysis, and predictive insights
- Workflow orchestration and autonomous remediation
- Scale, multi-tenancy, and cloud-readiness tailored for large enterprise operations
- User experience and operations alignment to reduce business impact
Let us now take a look at some of our core AIOps/ observability features.
Our core observability capabilities
- Anomaly detection
- AI/ML-powered predictive analytics
- Gen AI-powered insights
- Platform capabilities
Modern enterprises cannot afford to operate reactively. ManageEngine leverages AI-powered anomaly detection to spot irregular patterns in IT performance before they escalate into critical failures. Using advanced ML algorithms, ManageEngine continuously analyzes network, server, and application behavior to detect deviations from normal performance baselines.
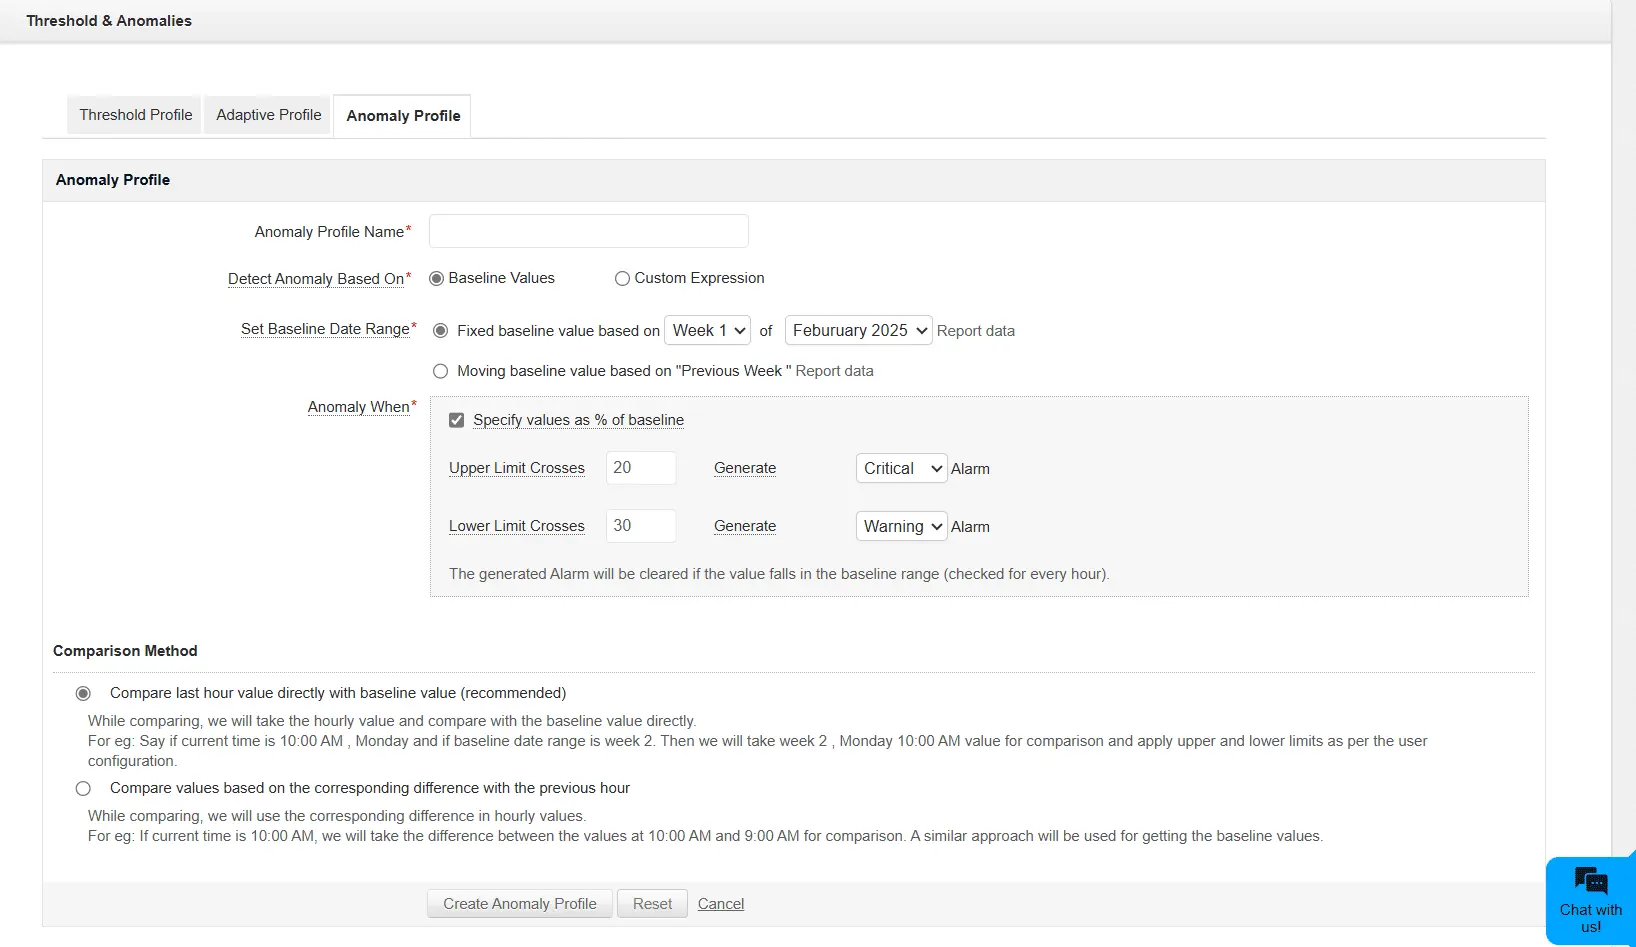
Proactive monitoring
The system identifies outliers in metrics such as CPU utilization, memory consumption, and response times, helping IT teams address potential issues before they impact business operations.
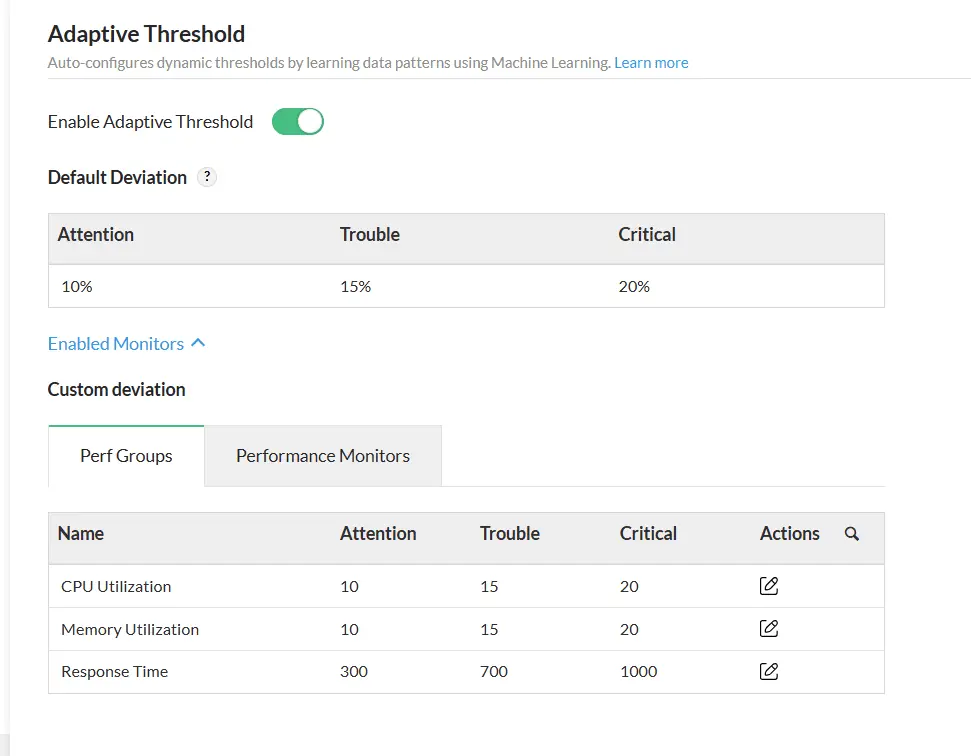
Dynamic thresholds
Unlike traditional manual thresholds, ManageEngine's adaptive thresholds dynamically adjust by analyzing your infrastructure's historical and real-time usage patterns, ensuring that your monitoring mechanism is context-aware.
Improved incident response
By detecting anomalies early, IT teams can proactively mitigate risks, minimize downtime, and enhance overall service reliability.
ManageEngine leverages predictive analytics to help IT administrators anticipate infrastructure faults, performance degradation, and resource constraints. Its in-house ML algorithms continuously analyze infrastructure behavior over time, identifying patterns to forecast potential issues. These predictive insights enable proactive fault detection, allowing administrators to address resource bottlenecks and performance anomalies preemptively. Additionally, ManageEngine recommends remediation actions to mitigate risks and ensure optimal infrastructure performance.
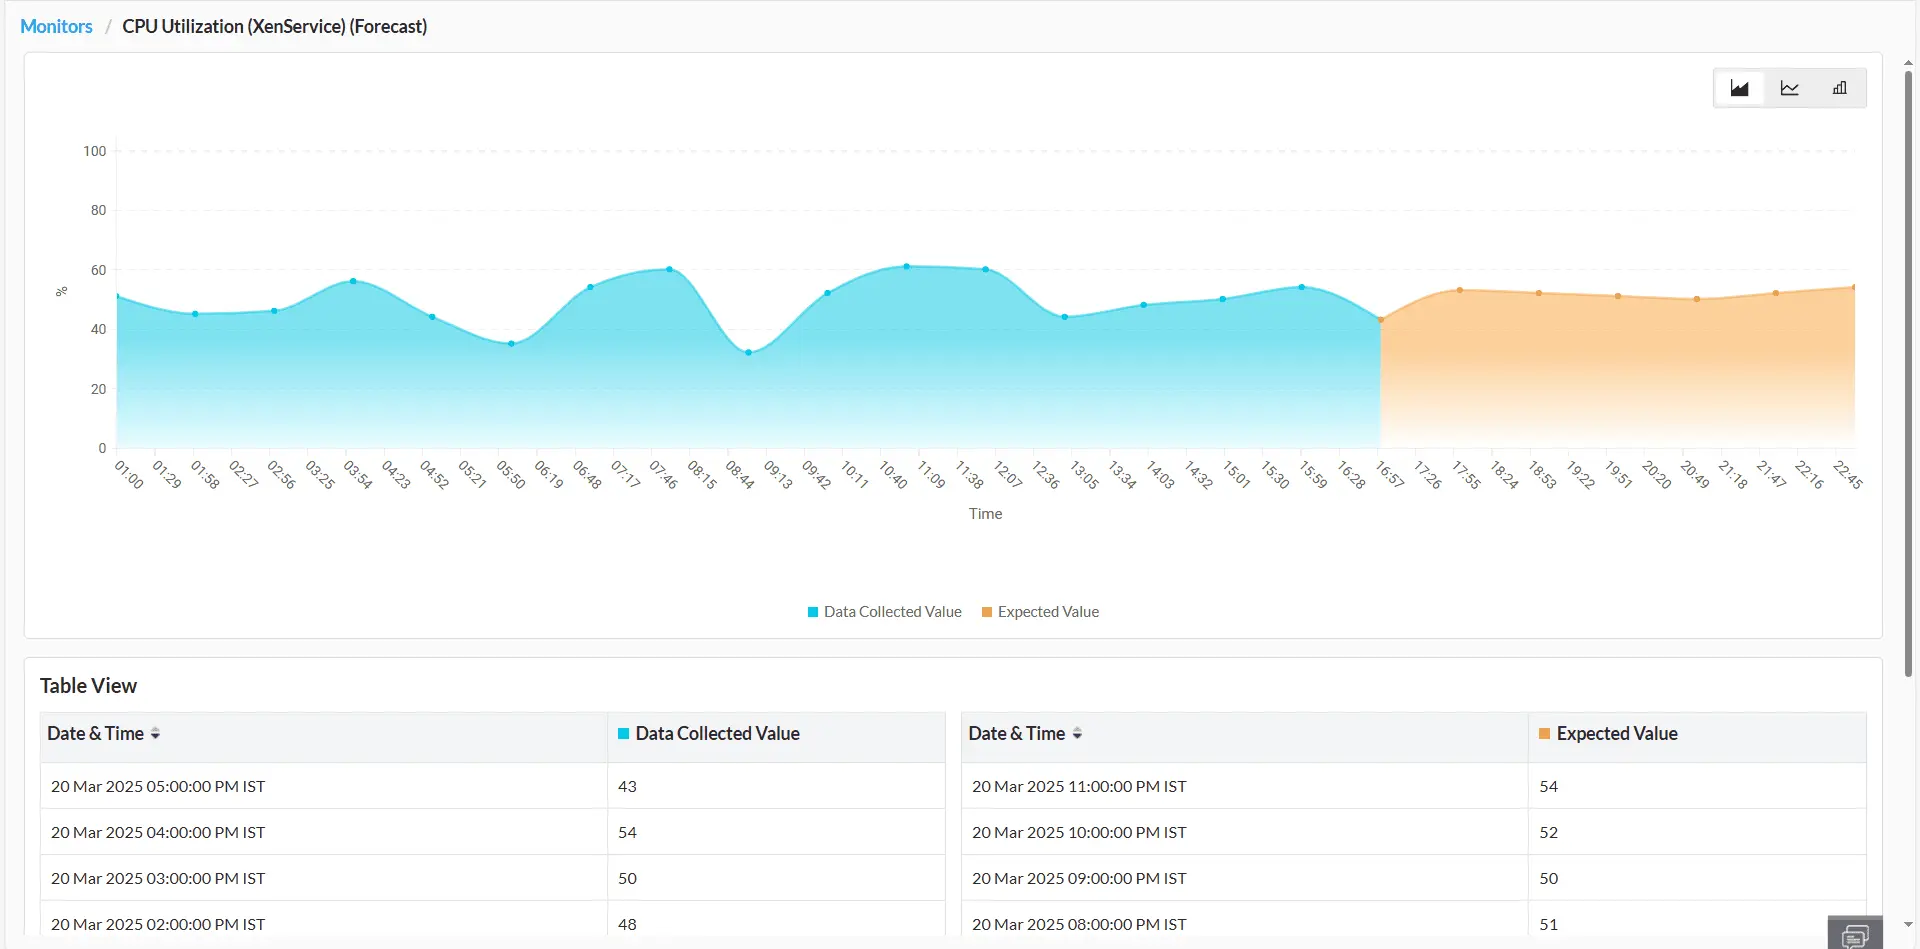
Forecasting performance trends
Utilize AI-driven algorithms to predict future infrastructure performance trends accurately, enabling proactive measures to align with the evolving demands of your IT environment. Learn more.
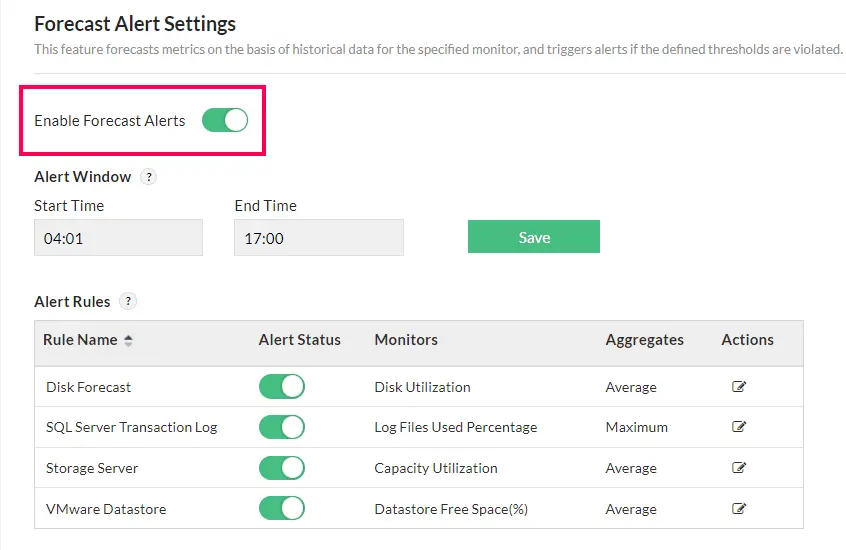
Forecast alerts
Stay ahead of resource exhaustion by predicting the estimated time until network resources reach critical thresholds. This prediction is derived from continuous observation of resource usage patterns over time and analyzed through an advanced forecast engine. Based on these forecasts, proactive alerts are triggered, allowing network administrators to mitigate risks and implement effective capacity planning strategies. Learn more.
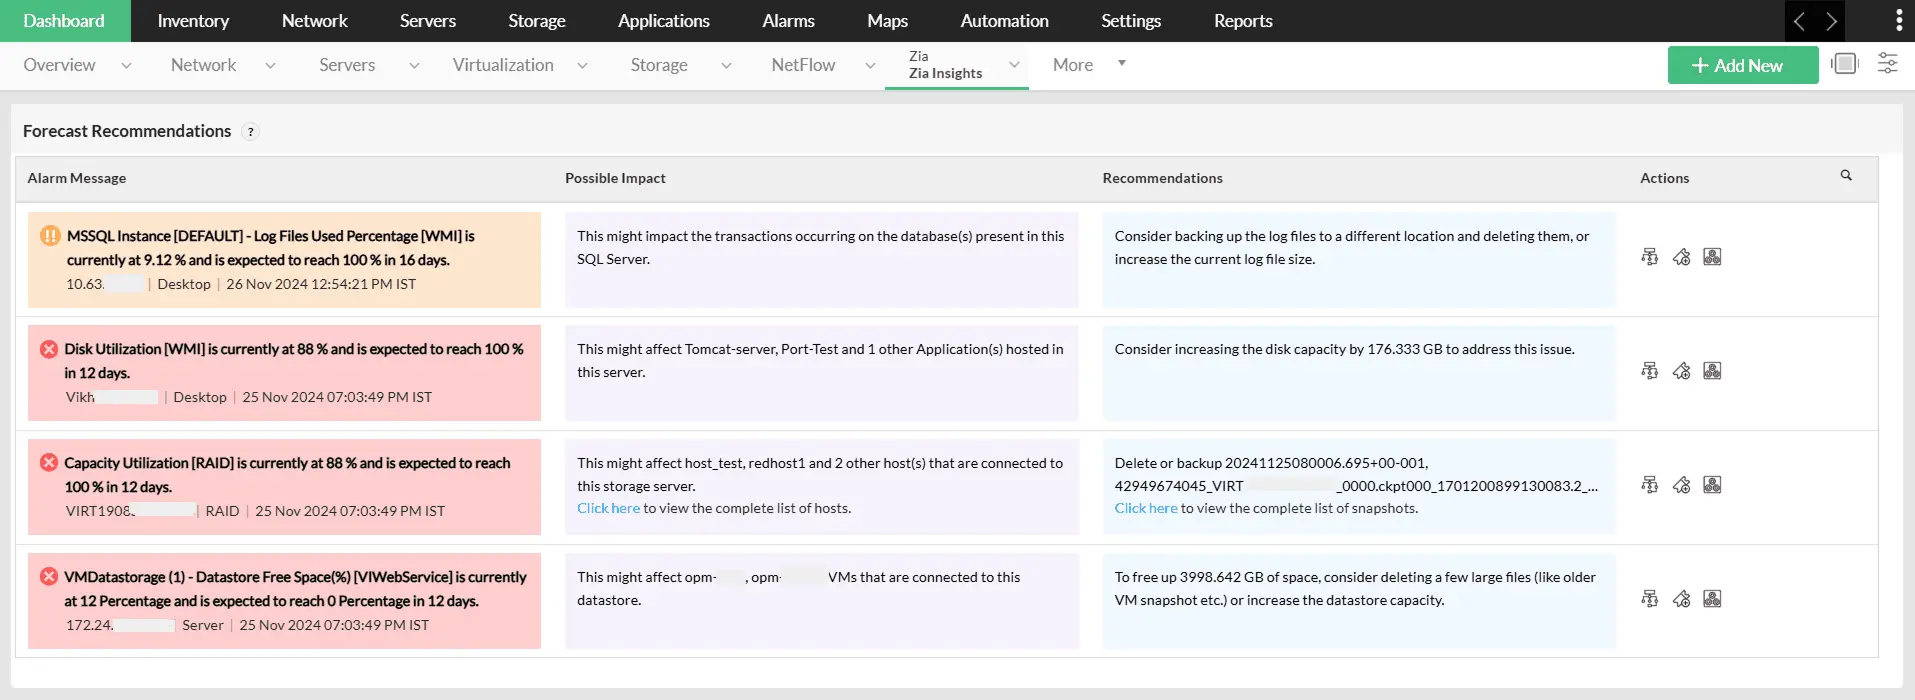
Zia Insights dashboards
Turn the forecast bottlenecks into actionable insights with Zia Insights dashboards. Receive AI-powered recommendations on predicted infrastructure faults and stay ahead of the curve by empowering your IT teams to act proactively and mitigate faults even before they arise. Learn More.
Harness the power of generative AI to transform raw observability data into actionable intelligence. From predictive recommendations to conversational interfaces, these capabilities help teams work smarter, not harder.
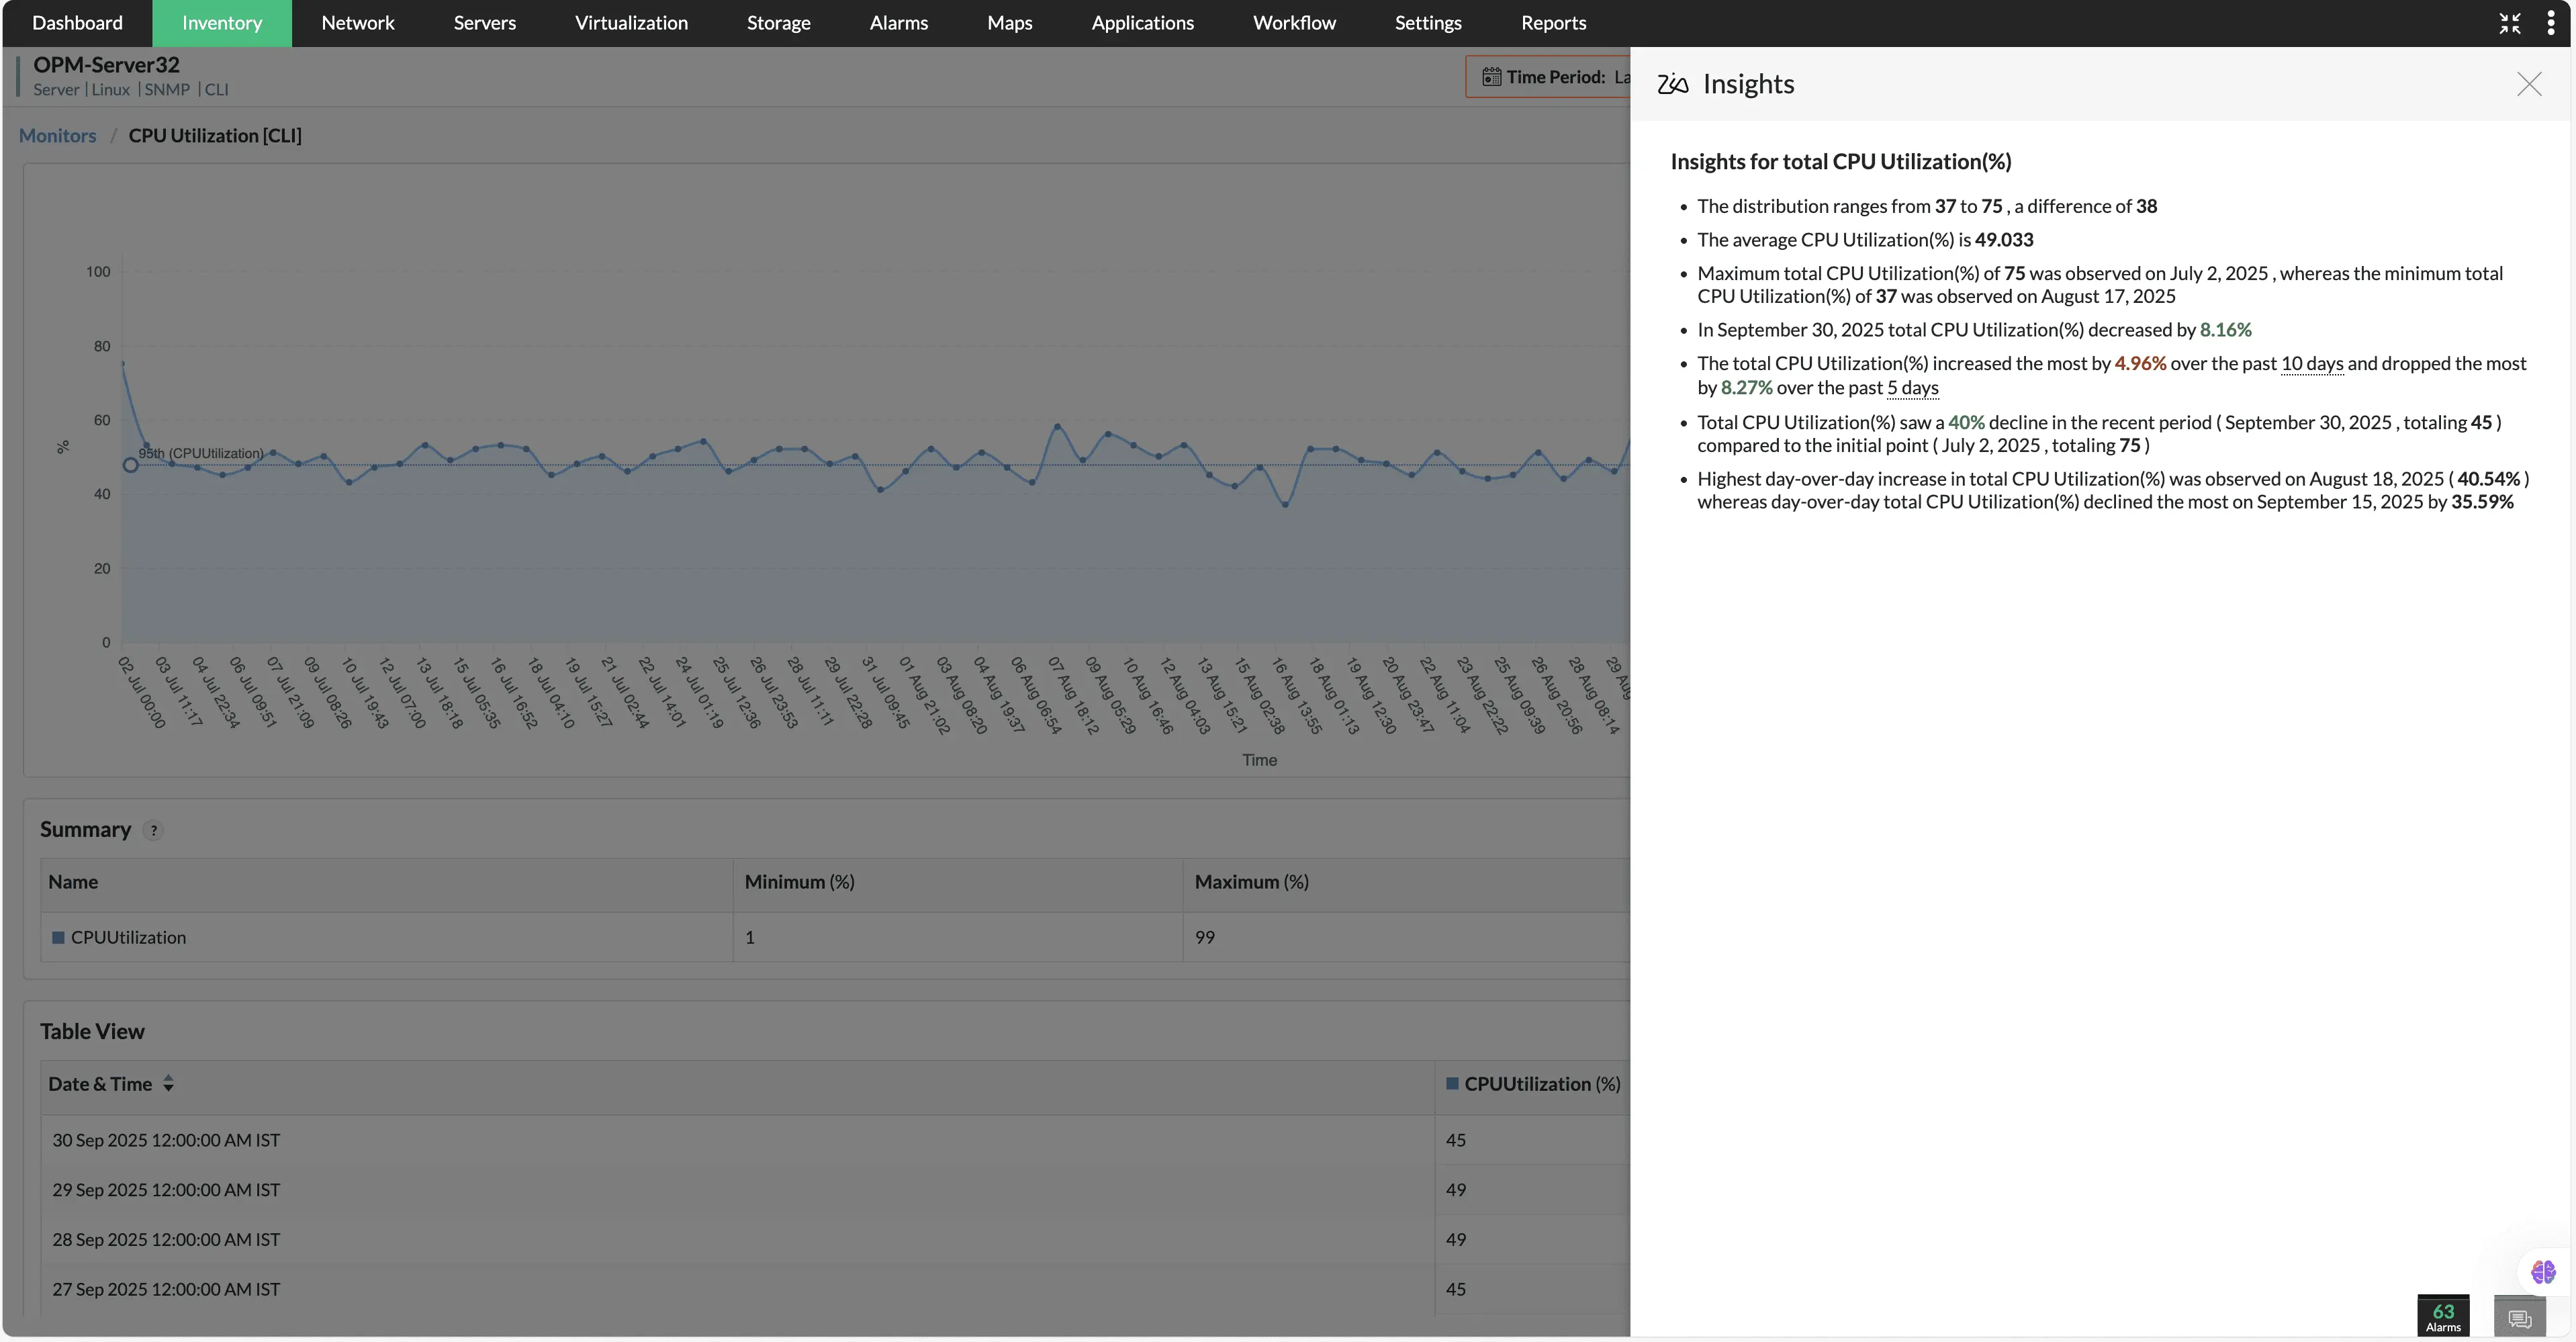
Zia Insights
Effortlessly transform raw, complex data into clear, actionable insights. With our in-house AI model, IT teams can analyze device performance through concise, human-readable summaries instead of sifting through dense graphs and data points.
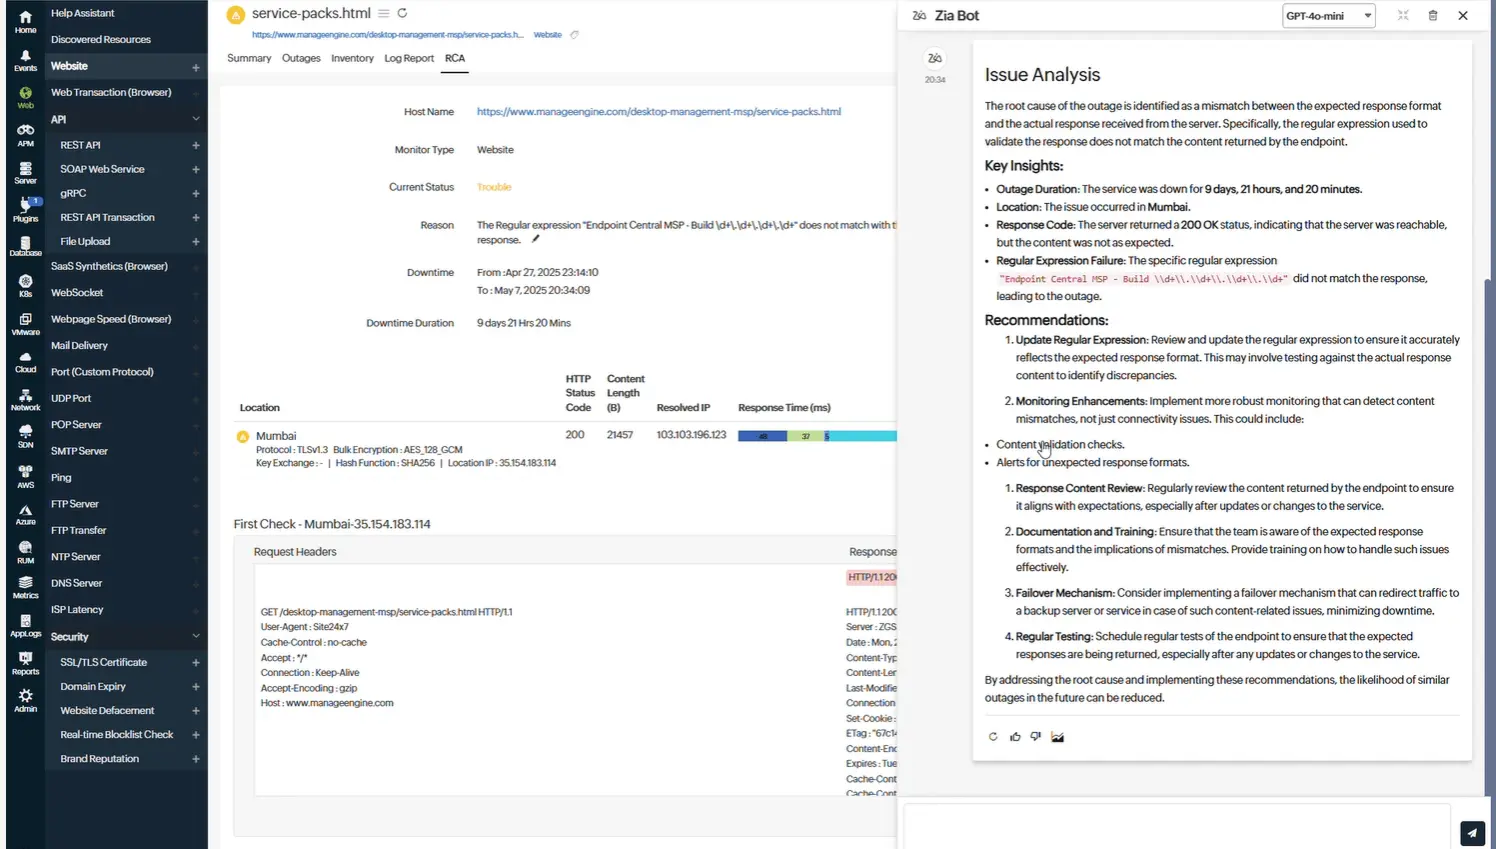
Automated Root Cause Analysis (RCA)
Powered by advanced LLMs, the platform automatically correlates telemetry data across metrics, logs, and traces to identify the most probable root causes. This accelerates fault isolation and minimizes downtime by removing the guesswork from troubleshooting.
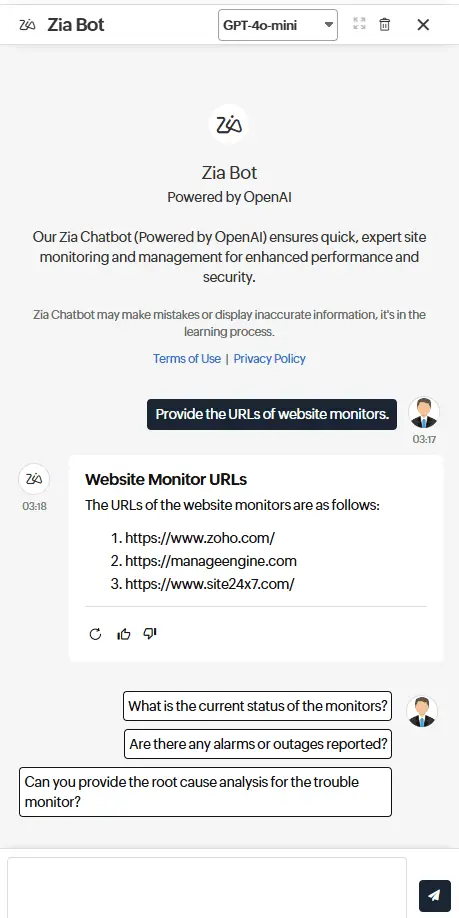
Natural Language Chat Interface
Interact with your observability data through a conversational chatbot. Use plain language to query logs, metrics, and traces, or generate human-readable summaries of incidents and anomalies, making it easier for teams to understand and act quickly.
Our platform empowers IT teams with end-to-end observability across infrastructure, applications, and services, providing a unified view that breaks down operational silos. By consolidating metrics, events, and telemetry from multiple sources, it enables faster insights, proactive monitoring, and streamlined operations, ensuring IT and DevOps teams can manage complex environments efficiently and maintain optimal service performance.
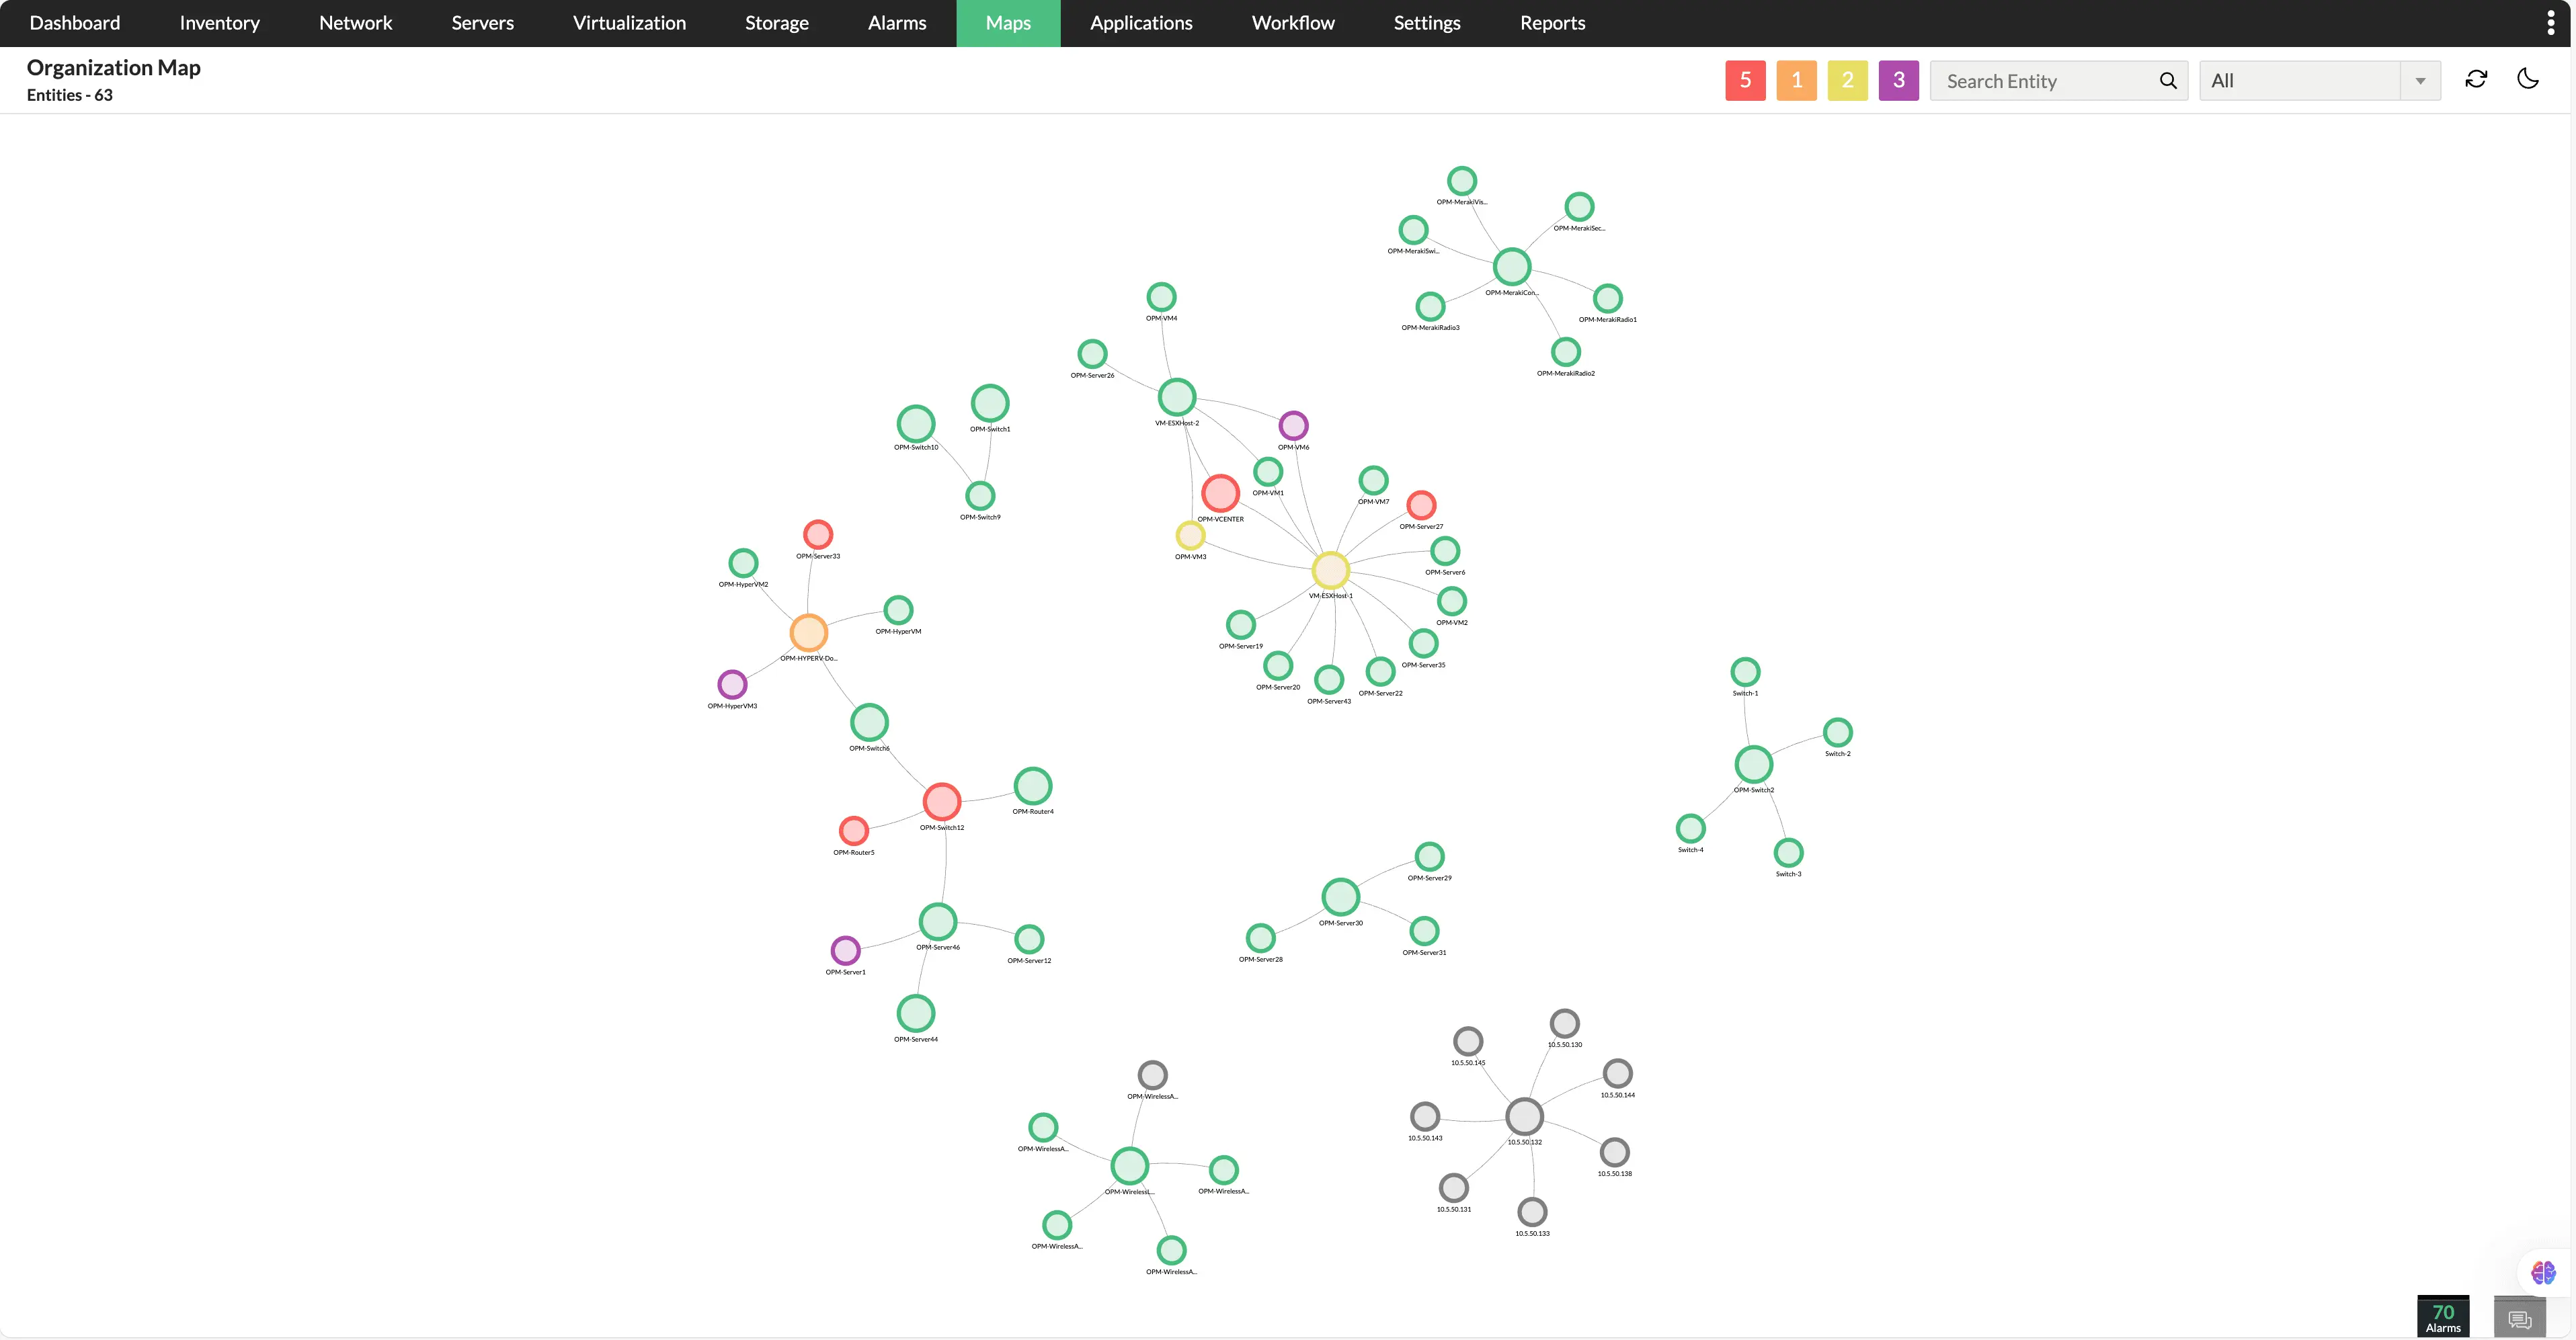
Full-stack topology view
Gain a dynamic, real-time topology view of your infrastructure, showcasing relationships between devices, applications, and services. Instead of navigating through scattered data points, IT teams can see dependencies at a glance, helping them quickly identify problem areas, understand potential impact, and streamline troubleshooting efforts.
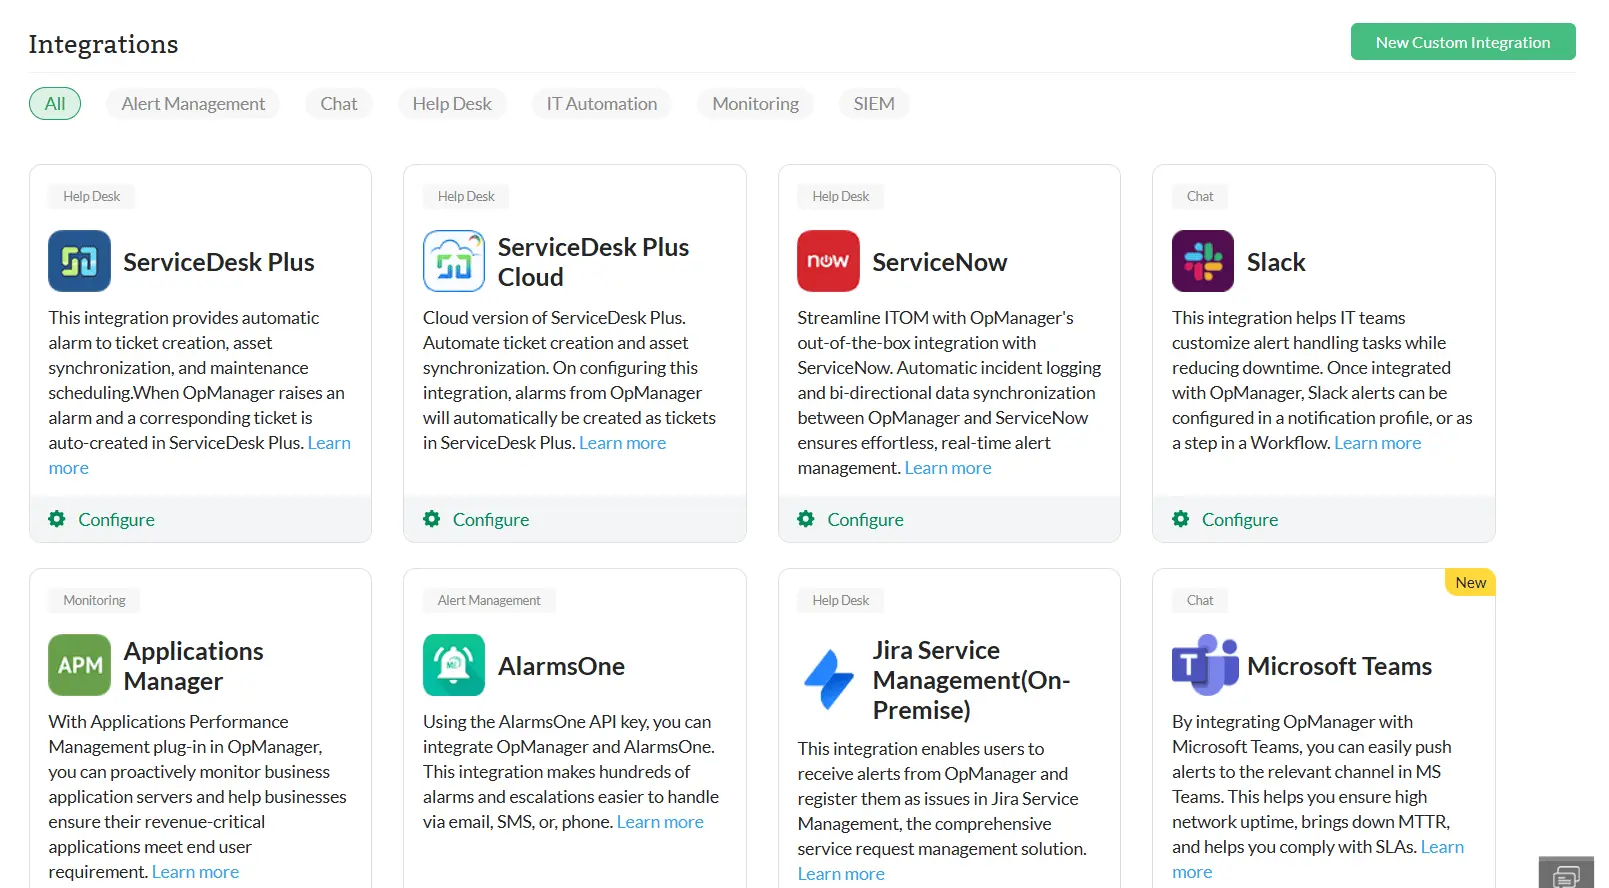
Unified IT ecosystem
Integrate seamlessly with ITSM platforms, collaboration tools, and cloud services to centralize monitoring and incident response.
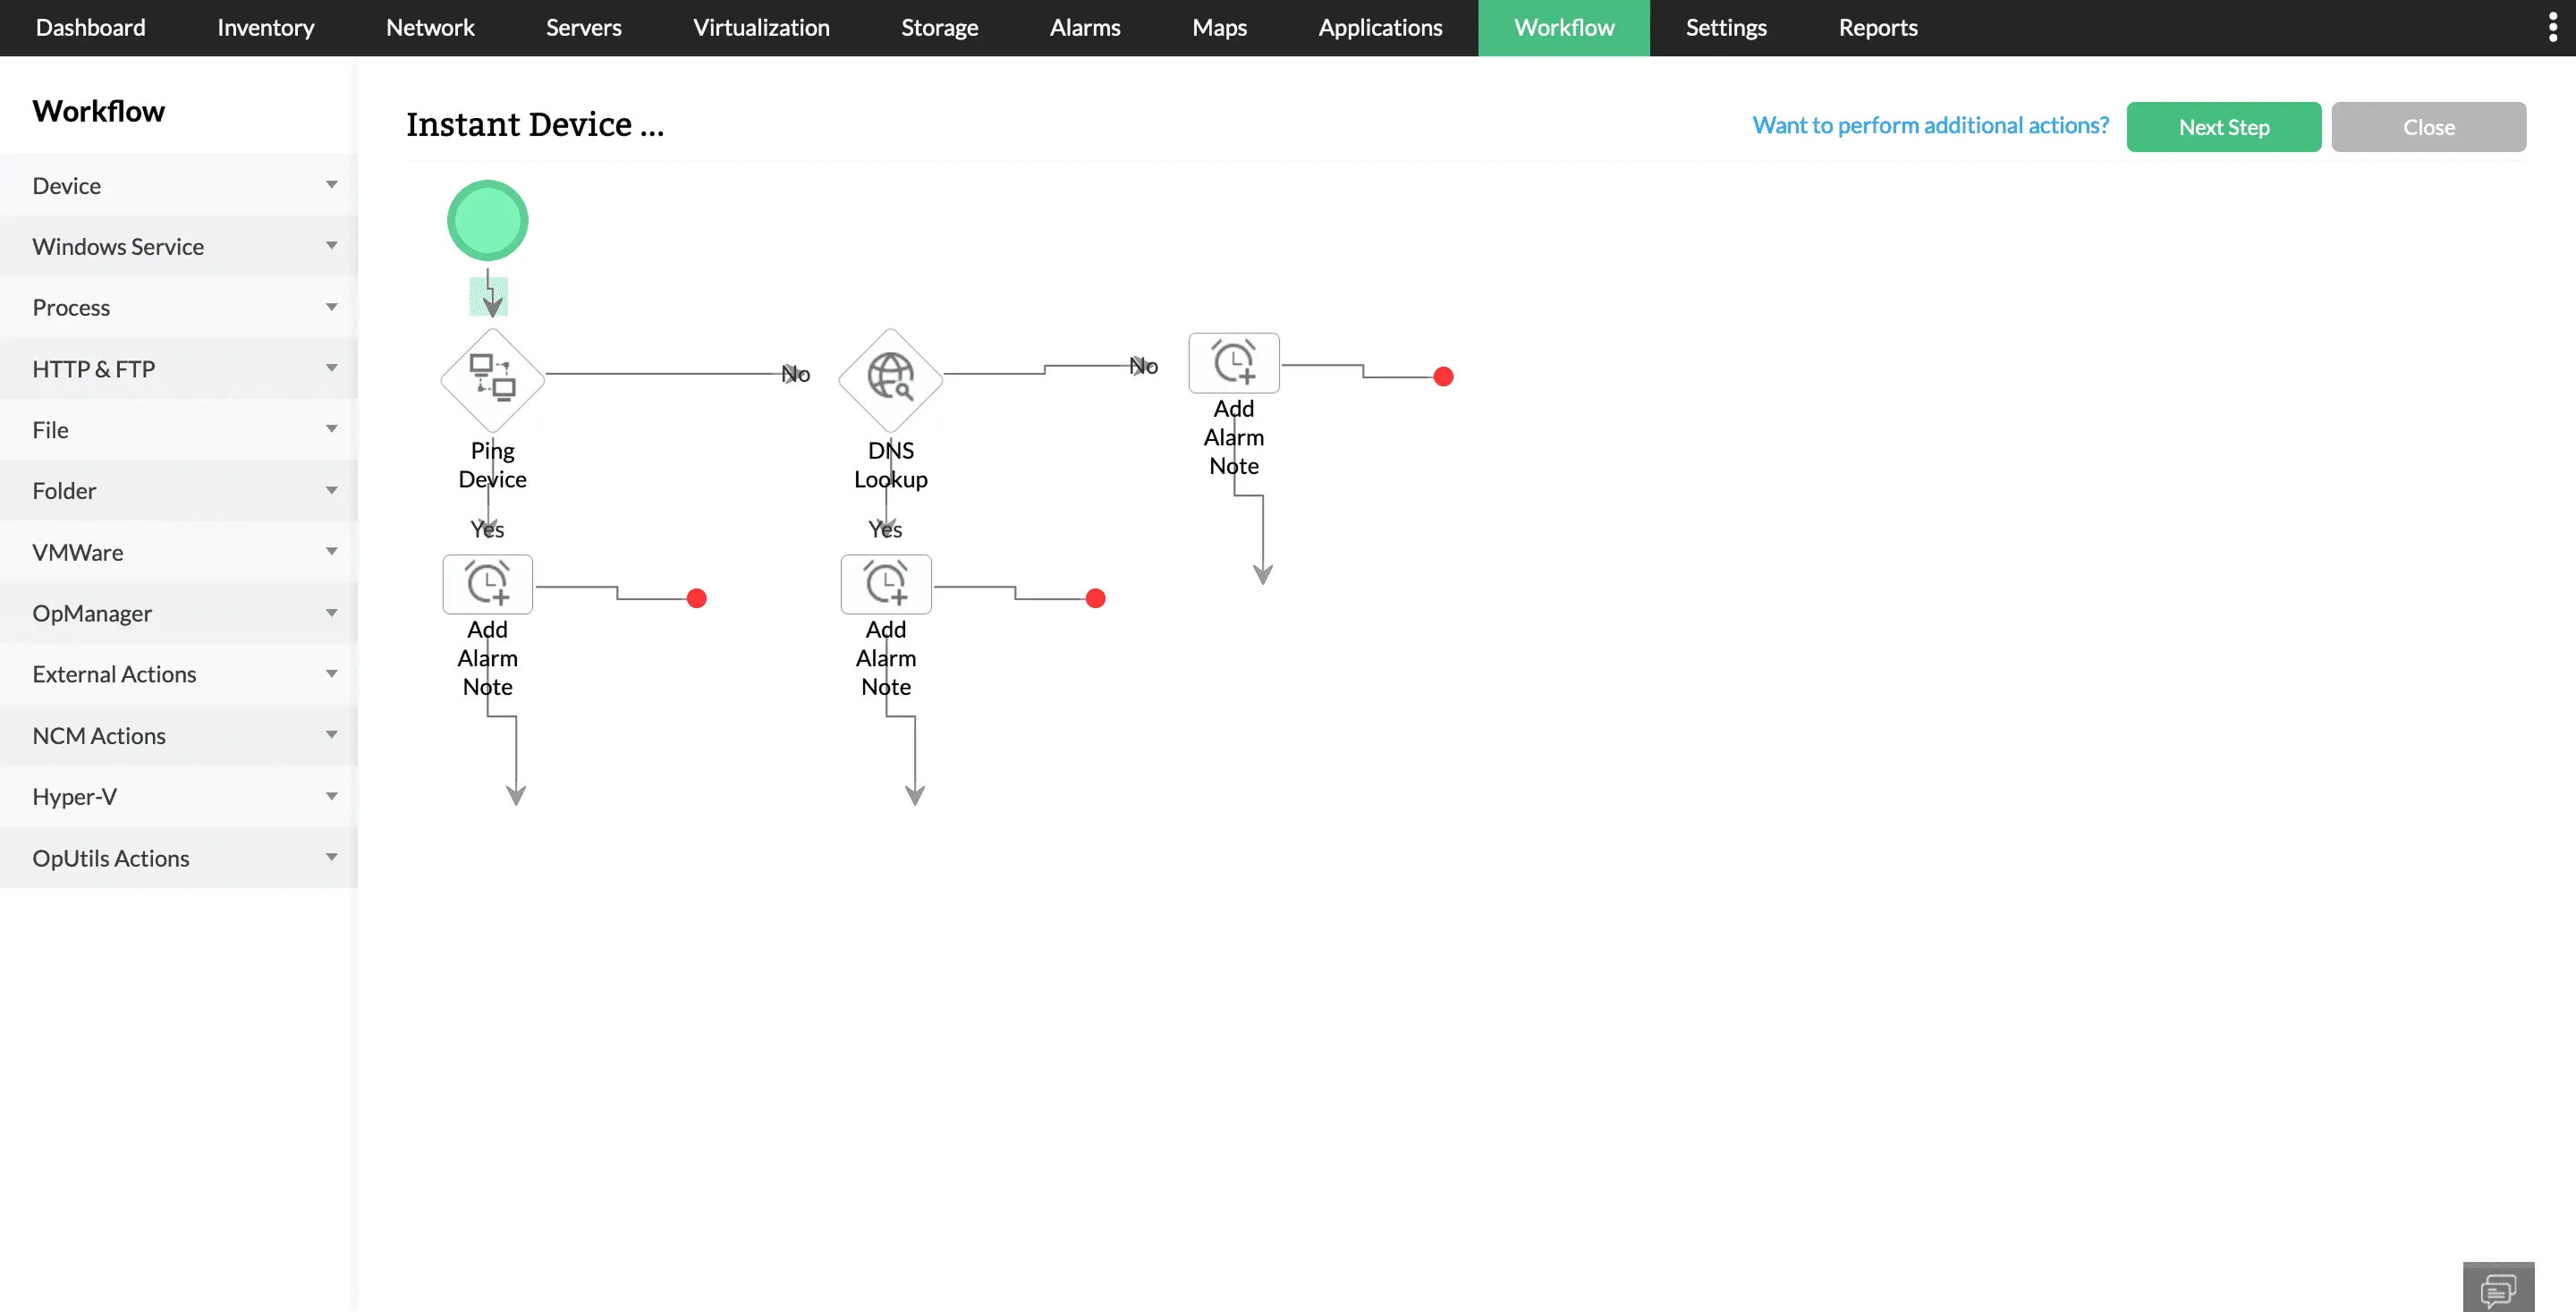
Tailored integrations and automated workflows
Use customized, API, or webhook-driven integrations to customize troubleshooting. Leverage automated, trigger-based workflows to implement Level 1 fault remediation measures.
5 reasons why enterprises around the world choose ManageEngine

- Reliable: Over 20 years presence in the market
- Cost-effective: Better features at a lesser price
- Secure: Compliant with top standards and regulations
- Modernized: Latest monitoring and security features
- Convenient: Advanced automation and intuitive interface
Trusted by 1 million IT admins across the globe
Top global brands trust us with their IT
Loved by customers all over the world
“Easy Implementation, Excellent support & Lower Cost Tool - Team Lead, IT Services Industry”
Reviewer Role: Infrastructure and Operations
Company size: 500M - 1B USD
We have been using OpManager since 2011 and our overall experience has been excellent. The tool plays a vital role in providing the value to our organization and to the customers we are supporting. The support is excellent and staff takes full responsibilities in resolving the issues. Innovation is never stopping and clearly visible with newer versions.
“OpManager - 10 steps ahead of the competition, one step away from being unequaled - Network Services Manager, Government Organization”
Reviewer Role: Infrastructure and Operations
Company size: 5,000 - 50,000 Employees
I have a long standing relationship with ManageEngine. OpManager has always missed one or two features that would make it truly the best tool on the market, but over it is the most comprehensive and easy to use the product on the market.
“Easy Implementation with a feature rich catalogue, support has some room for improvement - NOC Manager, IT Services Industry”
Reviewer Role: Program and Portfolio Management
Company size: 500M - 1B USD
The vendor has been supportive during the implementation & POC phases providing trial licenses. Feature requests and feedbacks is usually acted upon swiftly. There was sufficient vendor support during the implementation phase. After deployment, the support is more than adequate, where the vendor could make some improvements.
“Great Monitoring tool - CIO in Finance Industry”
Reviewer Role: CIO
Company size: 1B - 3B USD
ManageEngine provides a suite of tools that have made improvements to the availability of our internal applications. From monitoring, management and alerting, we have been able to peak performance within our data center.
“Simple Implementation, Easy To Use. Very Intuitive. - Principle Engineer in IT Services”
Reviewer Role: Enterprise Architecture and Technology Innovation
Company size: 250M - 500M USD
ManageEngine support was responsive to all our queries.

“OpManager helps me monitor all aspects of the data-center and equipment like servers, switches and routers. It is fast, intuitive and centralized and you do not need to be an expert to deal with OpManager.”
Altaleb Alshenqiti
NGHA

“Donald Stewart, IT Manager of Crest Industries is happy with ManageEngine OpManager for its end-to-end network monitoring software. It is easy-to-use and offers fault and performance management for router.”
Donald Stewart
IT Manager, Crest Industries

“John Rosser, MIS Manager of Yale Chase talks about the proactive nature of ManageEngine OpManager & how his organisation gained value from it.”
John Rosser
MIS Manager