Customize Dashboard Views
Last updated on:
In this page
- Overview
- Filtering data by time range
- Adding a new tab
- Adding a new widget to a tab
- Editing, deleting, and reordering tabs
- Reordering and resizing widgets
- Editing and deleting widgets
- Viewing the dashboard in full screen mode
- Viewing a widget in full screen mode
- Refreshing the dashboard and widgets
- Changing refresh interval
Overview
Customizing the ManageEngine Log360 dashboard allows you to tailor the view to focus on the data most relevant to your log sources. You can add, remove, or rearrange tabs and widgets, and adjust layout settings to create a personalized dashboard that enhances monitoring efficiency and visibility. This page outlines the available customization options and explains how to configure the dashboard to suit your specific monitoring requirements.
Filtering data by time range
You can filter the data displayed on the dashboard by selecting a time range.
- In the top-right corner of the Dashboard, click the
 drop-down.
 - Choose from predefined options such as Today, Yesterday, Last 7 days, Last 30 days, This month, Last month.
Figure 1: Selecting a time range - To define your own range, select Custom and specify the From and To dates and times using the calendar and time fields.
Figure 2: Selecting a time range - Alternatively, you can use the Last field to set a relative time range.
- Click Apply to update the dashboard data for the selected period.
Adding a new tab
To add a new tab to the dashboard,
- In the Dashboard, click the
 icon on the top-right corner and select Add Tab.
Figure 3: Adding a New Tab in the dashboard - In the pop-up box that appears, you can see the following:
- Default tabs: Events Overview, Network Overview, Security Overview, M365 Overview, Incident Overview, Detection Overview, Threat Analytics, and AD Audit.
- Other predefined templates
- Add Custom Tab option
- Click Add Custom Tab. Enter a name for the tab in the given field and click Add.
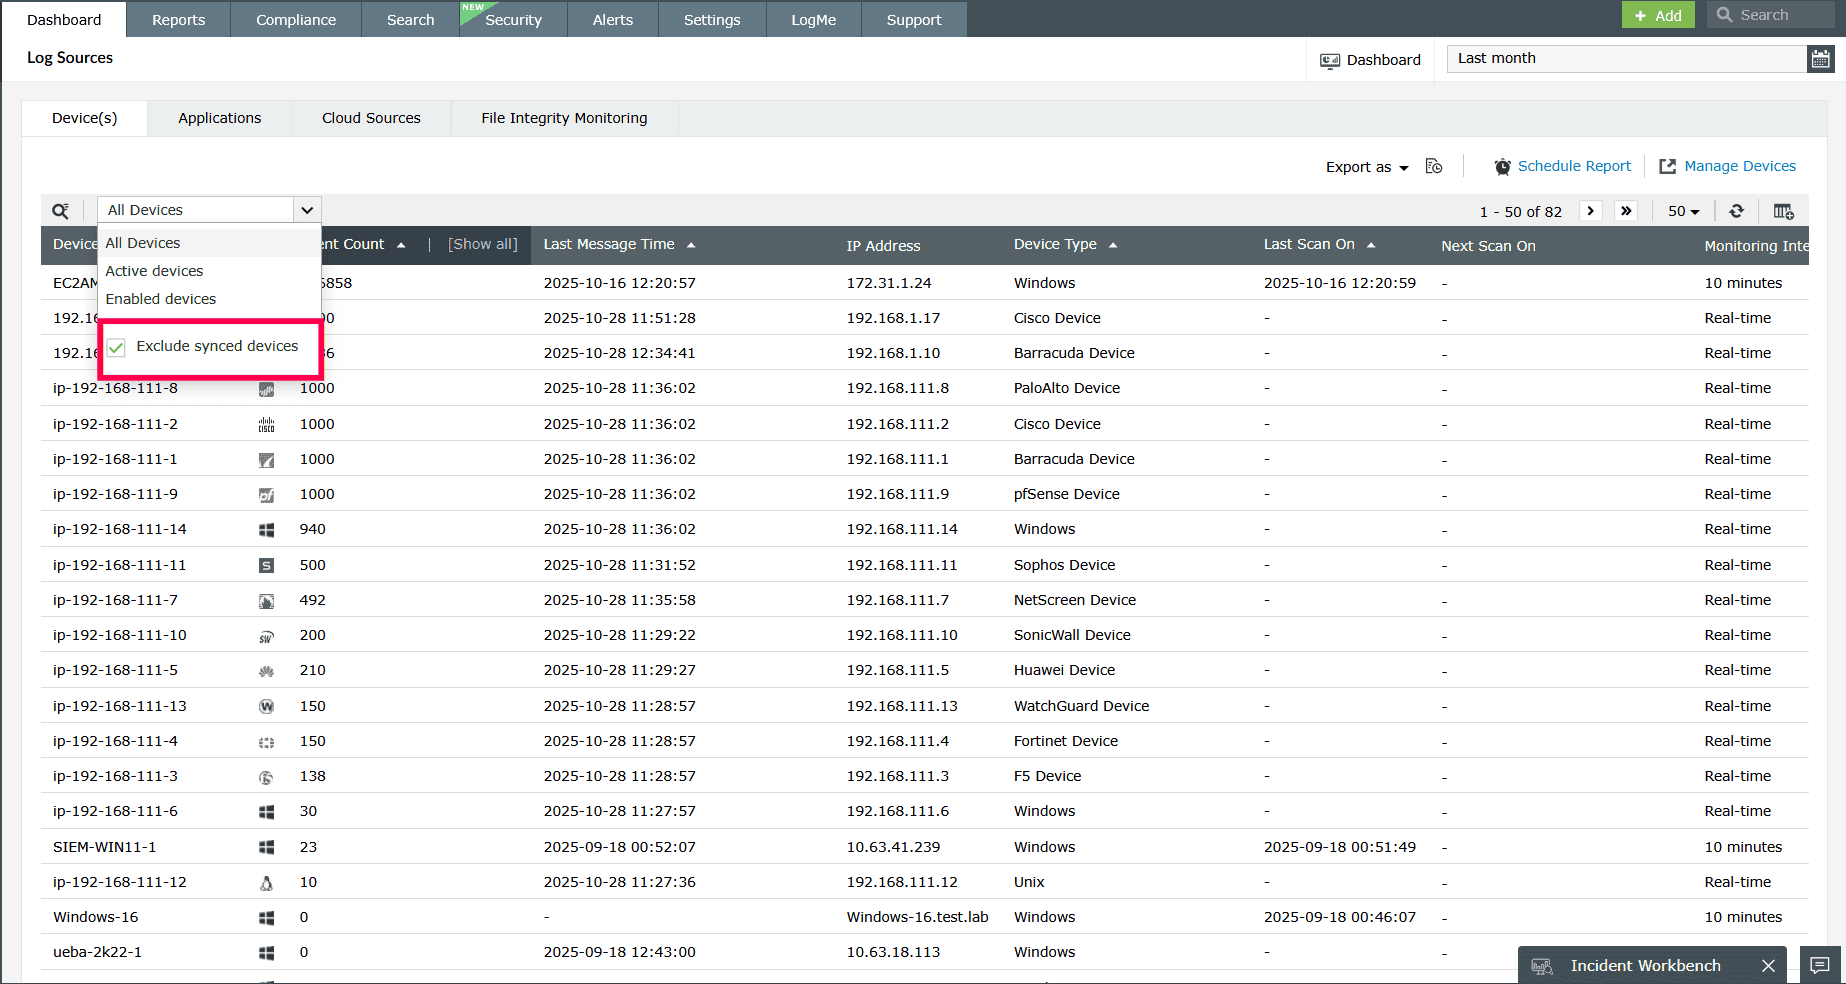
Figure 4: Adding a Custom Tab
Adding a new widget to a tab
To add a new widget,
- In the Dashboard, click the icon on the top-right corner and select Add Widgets.
- In the Add New Widget window, choose a component from the Select Component drop-down.
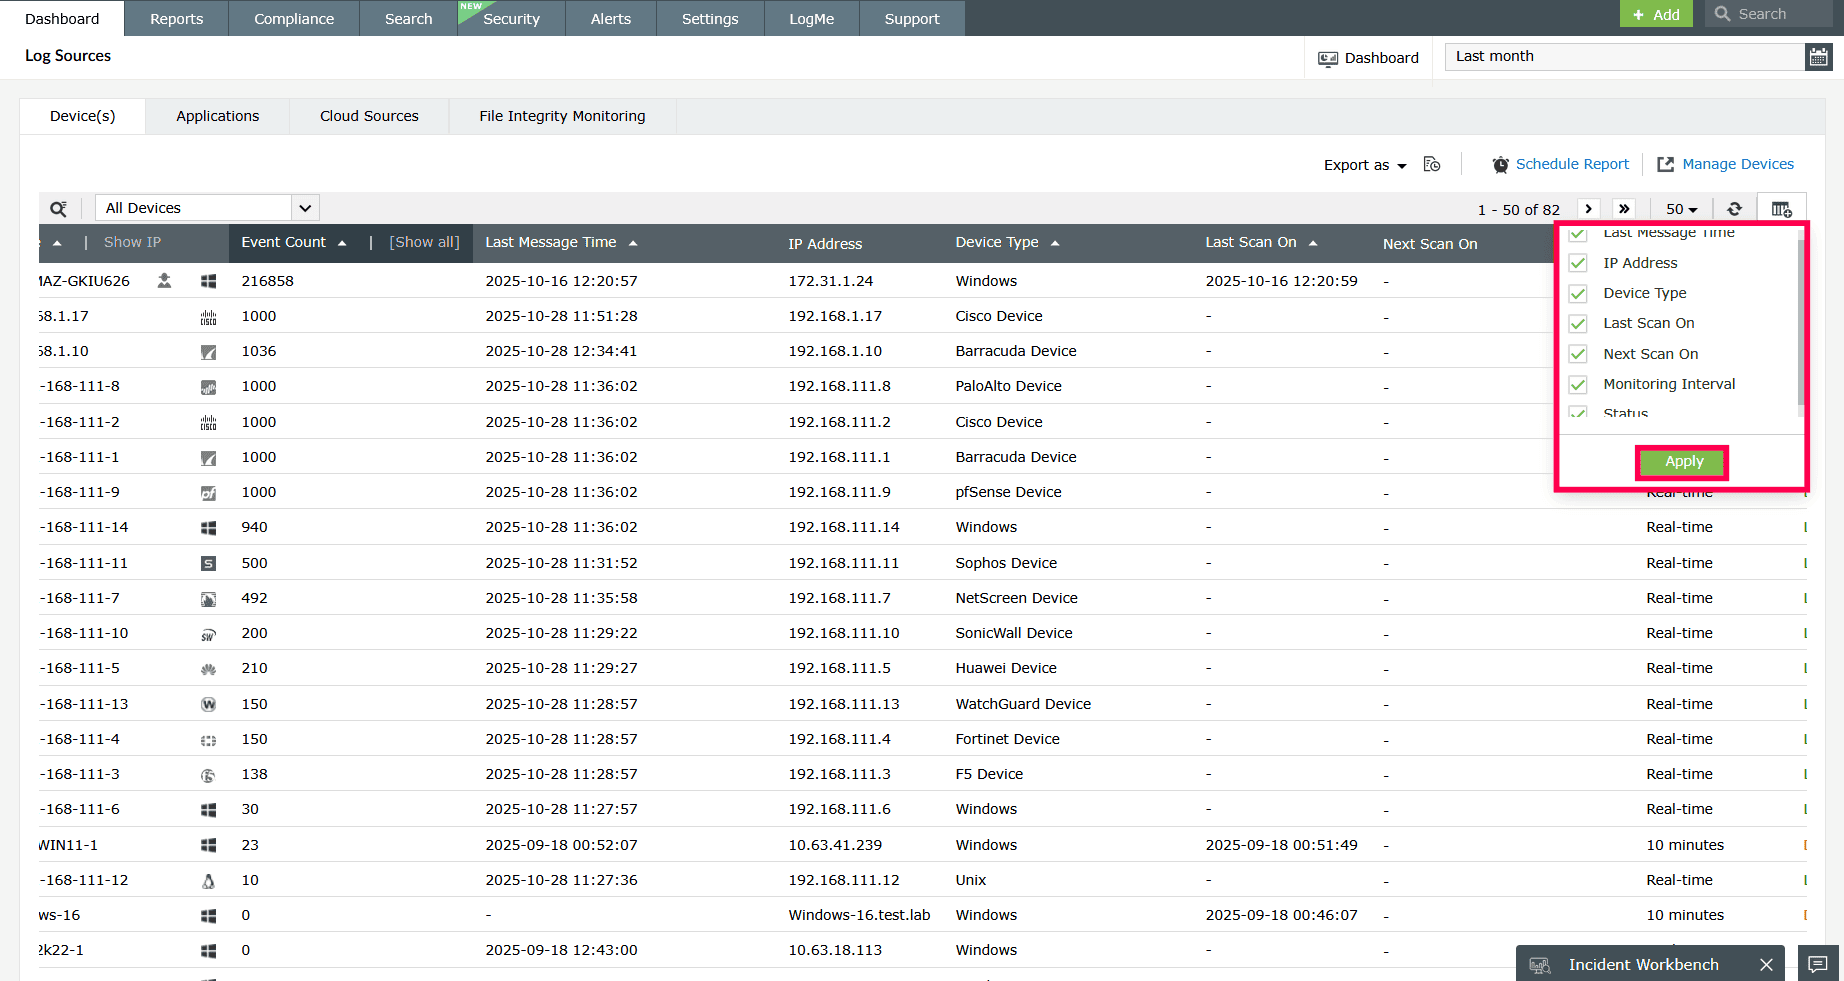
Figure 5: Selecting a component - Specify the widget, widget type, chart type, chart color, and provide a display name for the widget.
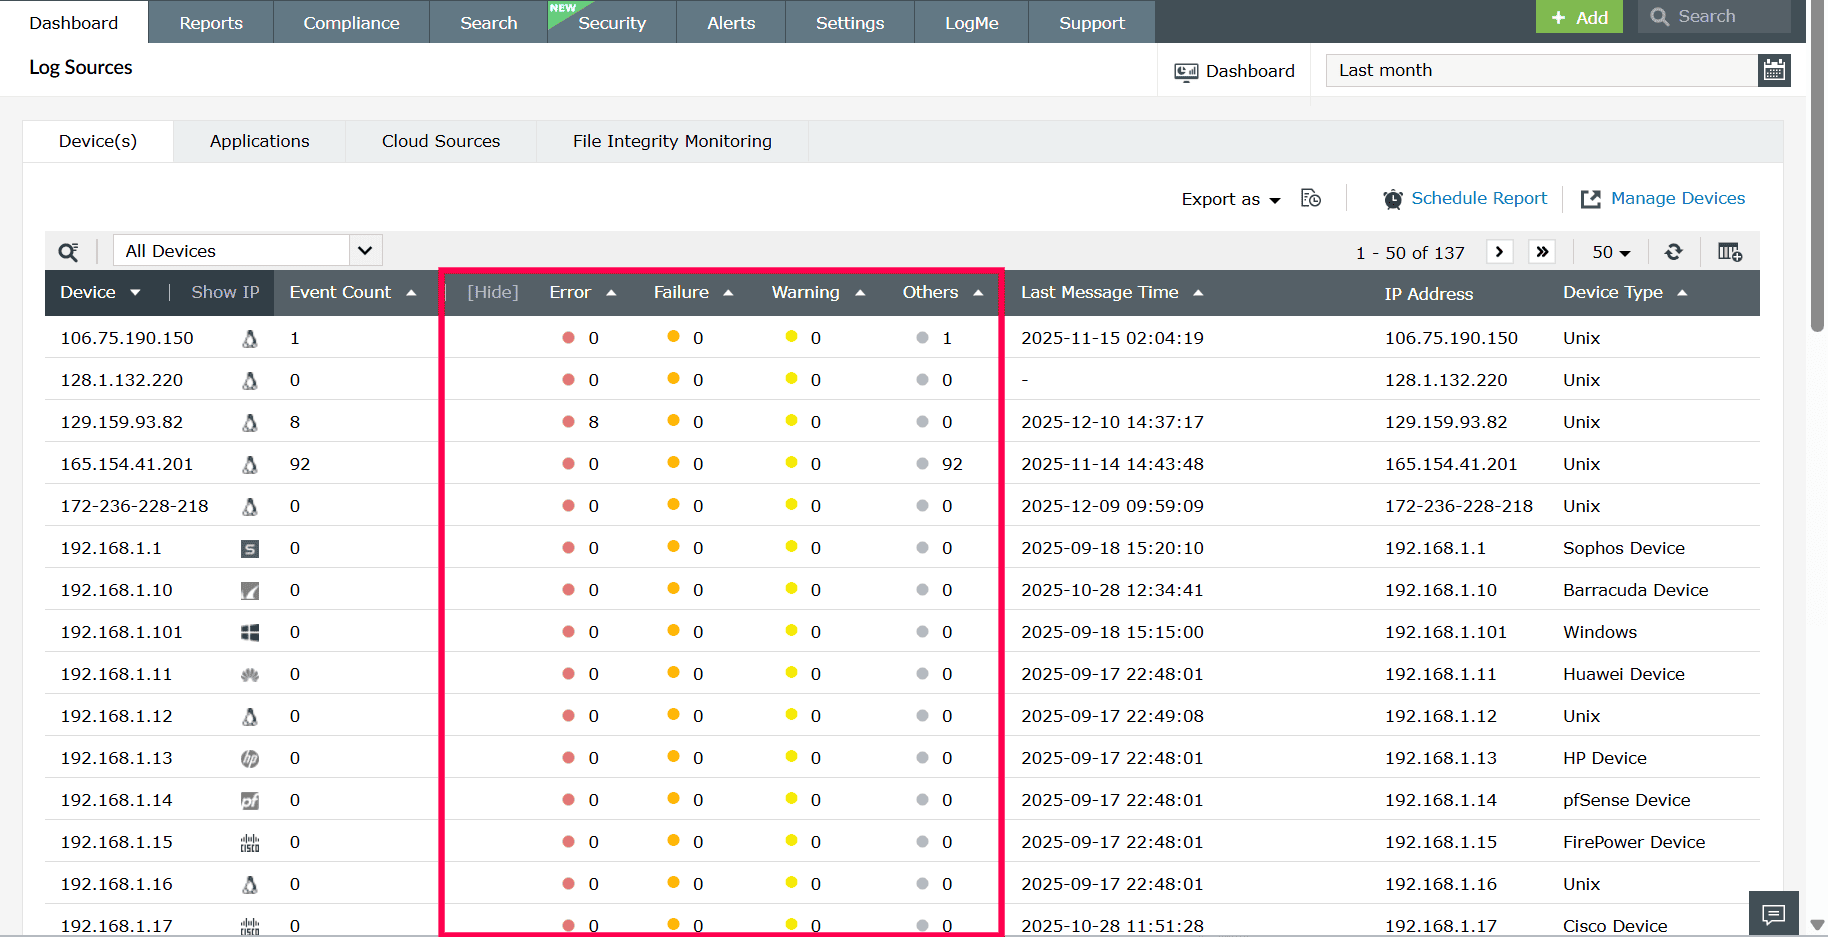
Figure 6: Configuring a New Widget in the dashboard - Once configured, select Add to save the widget.
Editing, deleting, and reordering tabs
To delete tabs from the dashboard,
- In the Dashboard, click the icon on the top-right corner and select Manage Tabs.
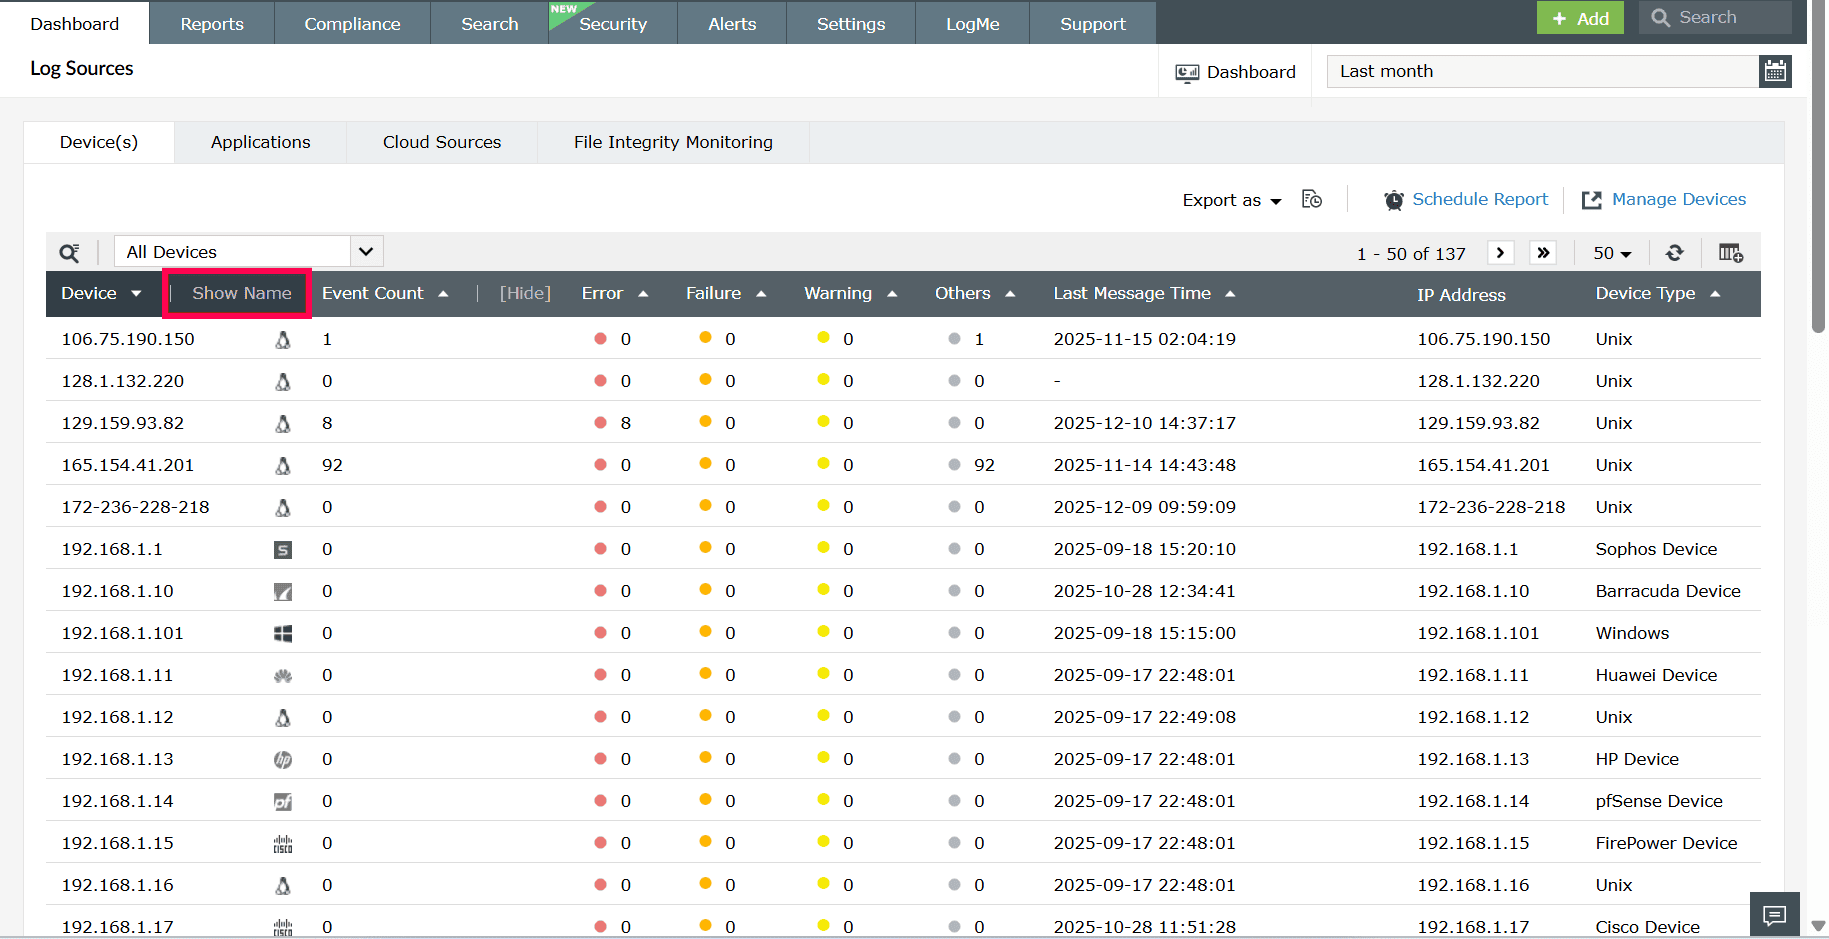
Figure 7: Deleting tabs in the dashboard - In the Manage Tab dialog box that appears, click the
 icon corresponding to that tab that you want to delete.
 - In the pop-up confirmation box, click Yes to confirm the deletion of the tab.
- Click Save to apply the changes to the dashboard.
To reorder the tabs in the dashboard,
- In the Dashboard, click the icon on the top-right corner and select Manage Tabs.
- Click the
 icon and drag and drop the tabs in the order of your choice.
 - Click Save to apply the changes to the dashboard.
To edit a dashboard tab:
- In the Dashboard, click the icon on the top-right corner and select Manage Tabs.
- Hover over the tab you want to edit and click the edit icon.
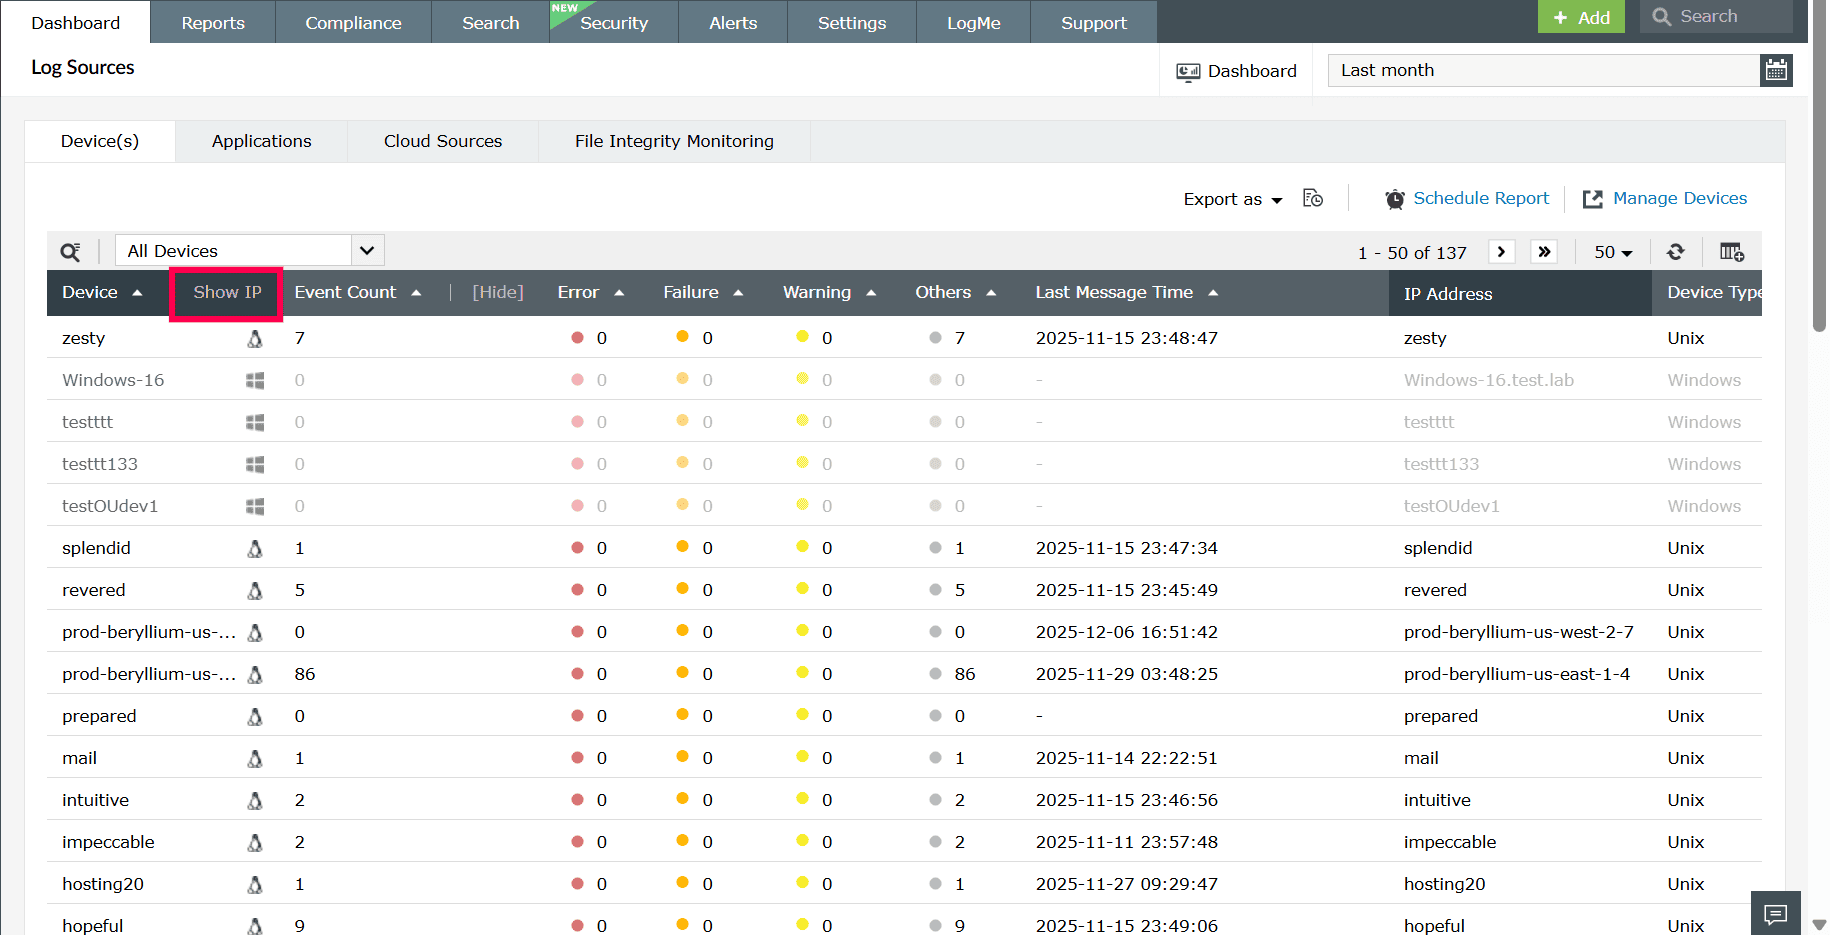
Figure 8: Editing a dashboard tab - Modify the tab name and click the
 icon to confirm.
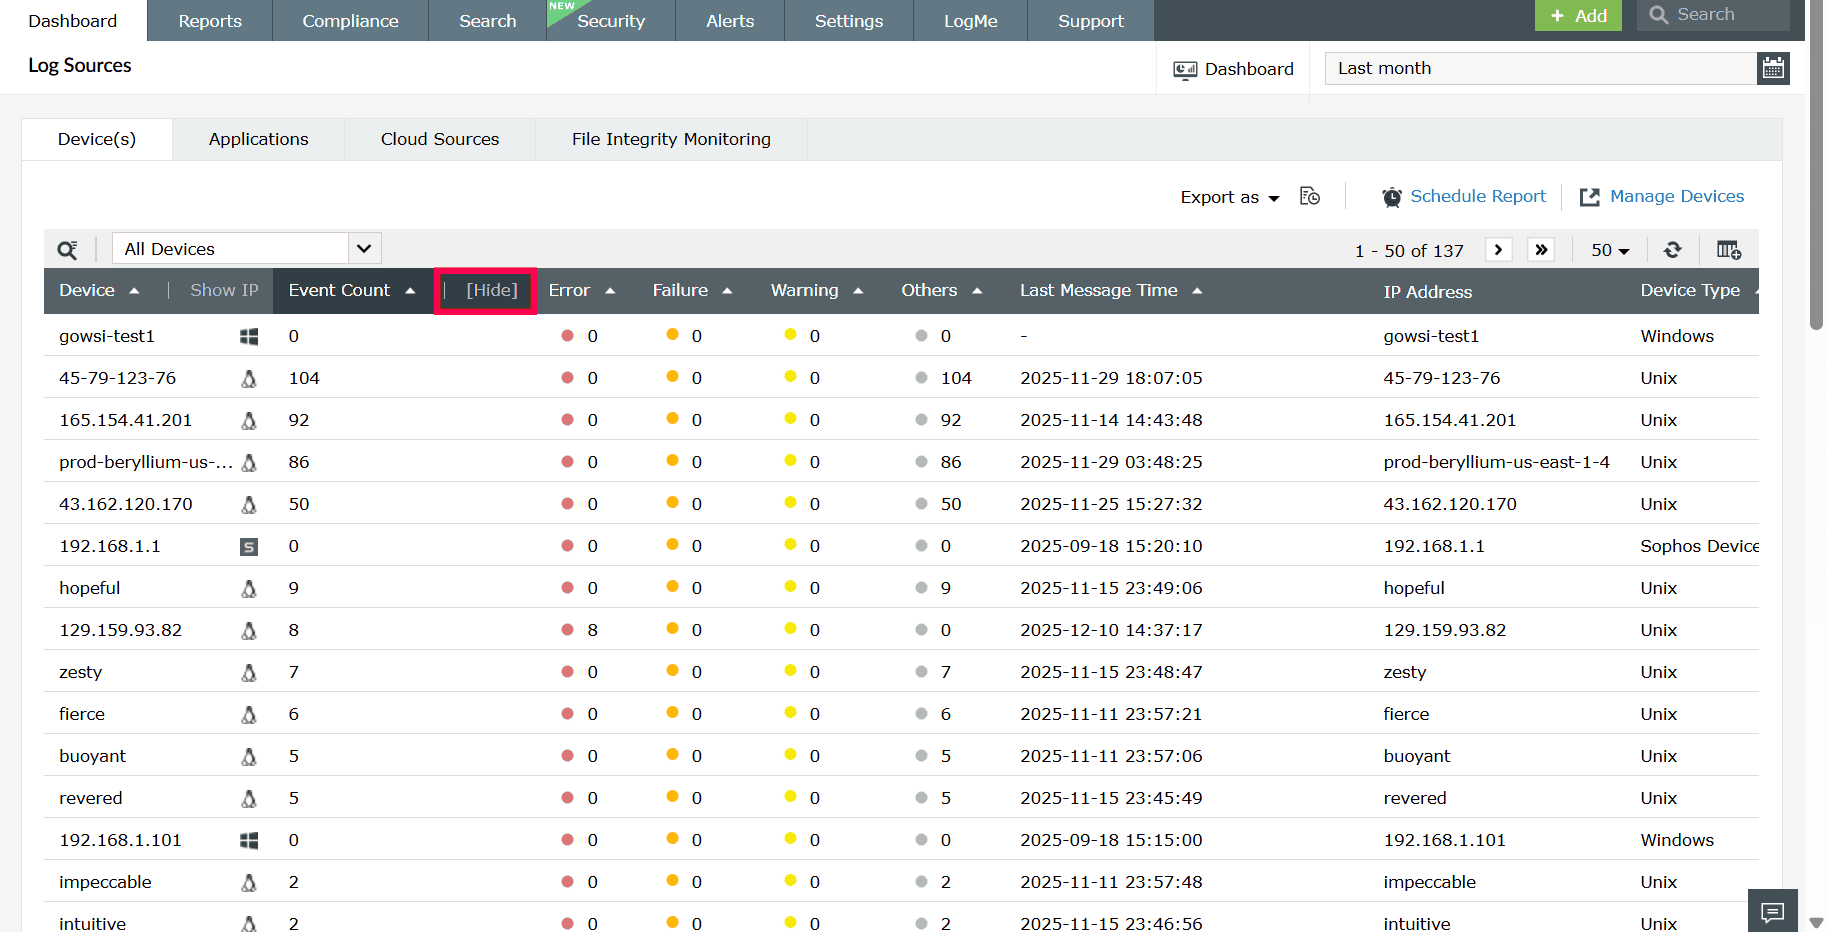
Figure 9: Modifying the tab name - Click Save to apply the changes to the dashboard.
Reordering and resizing widgets
To reorder the widgets in a tab,
- In the Dashboard, go to the tab containing the widgets you want to reorder.
- Click the icon on the top-right corner and select Reorder Widgets.
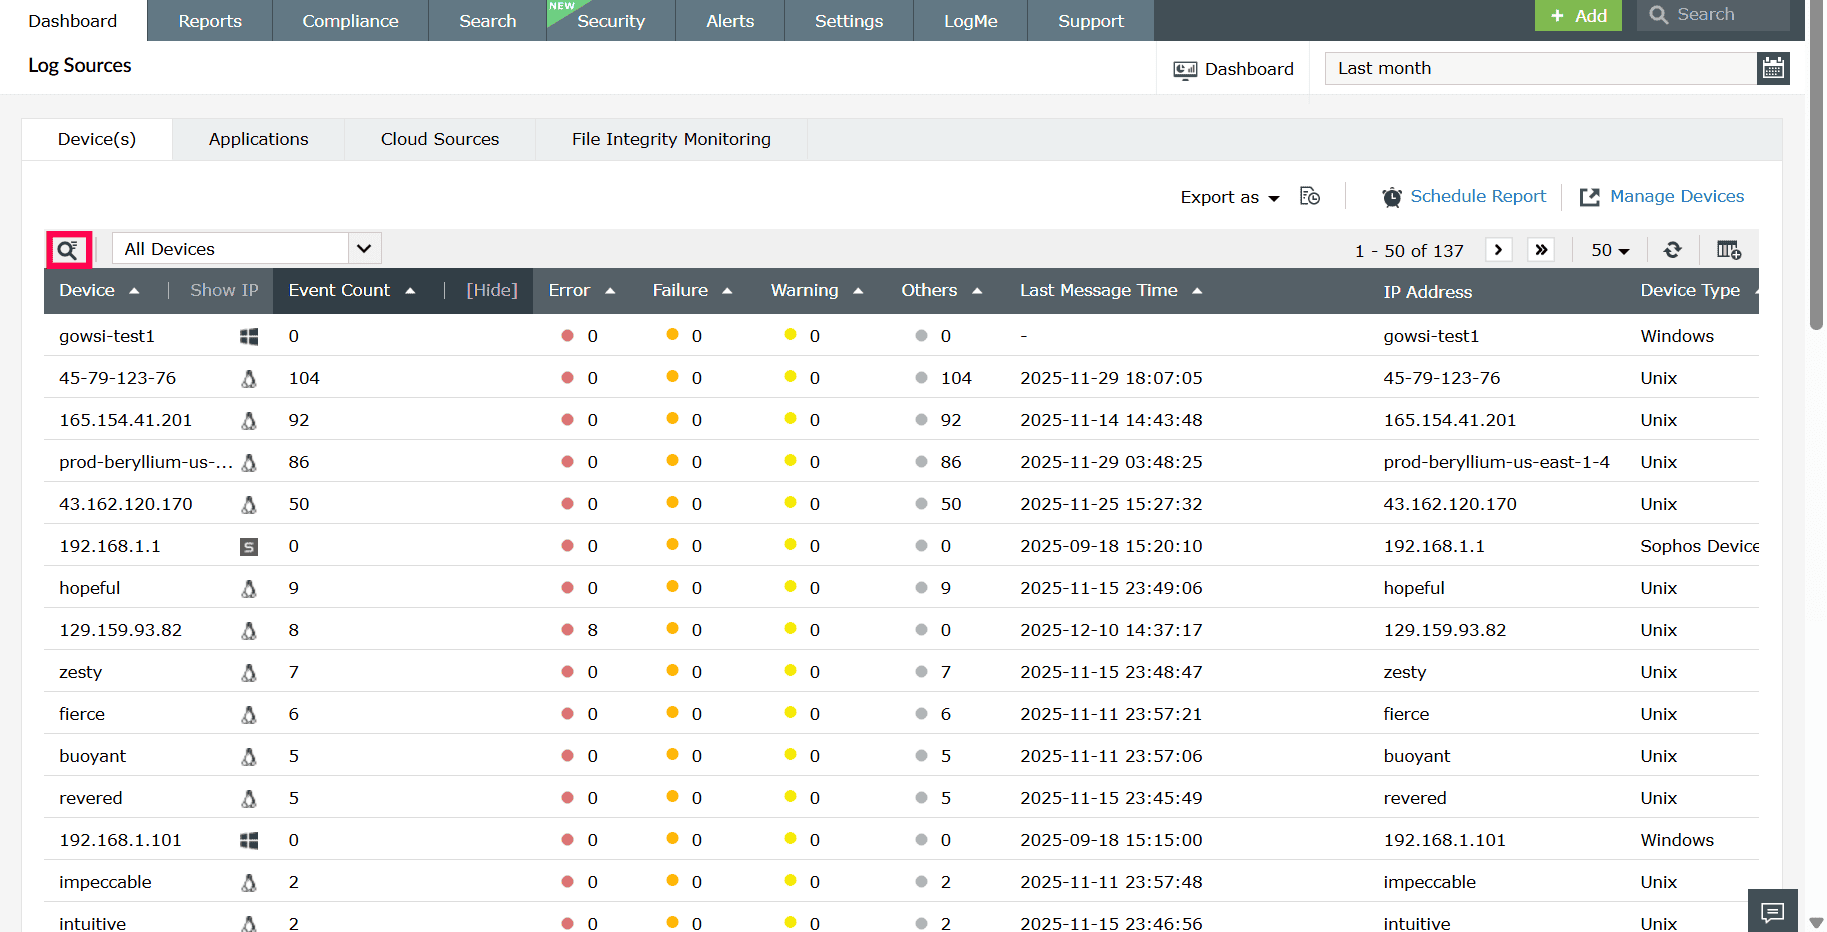
Figure 10: Reordering widgets in the dashboard - Click and drag the widgets to your desired positions.
- Click Save in the top-right corner to apply the changes to the dashboard.
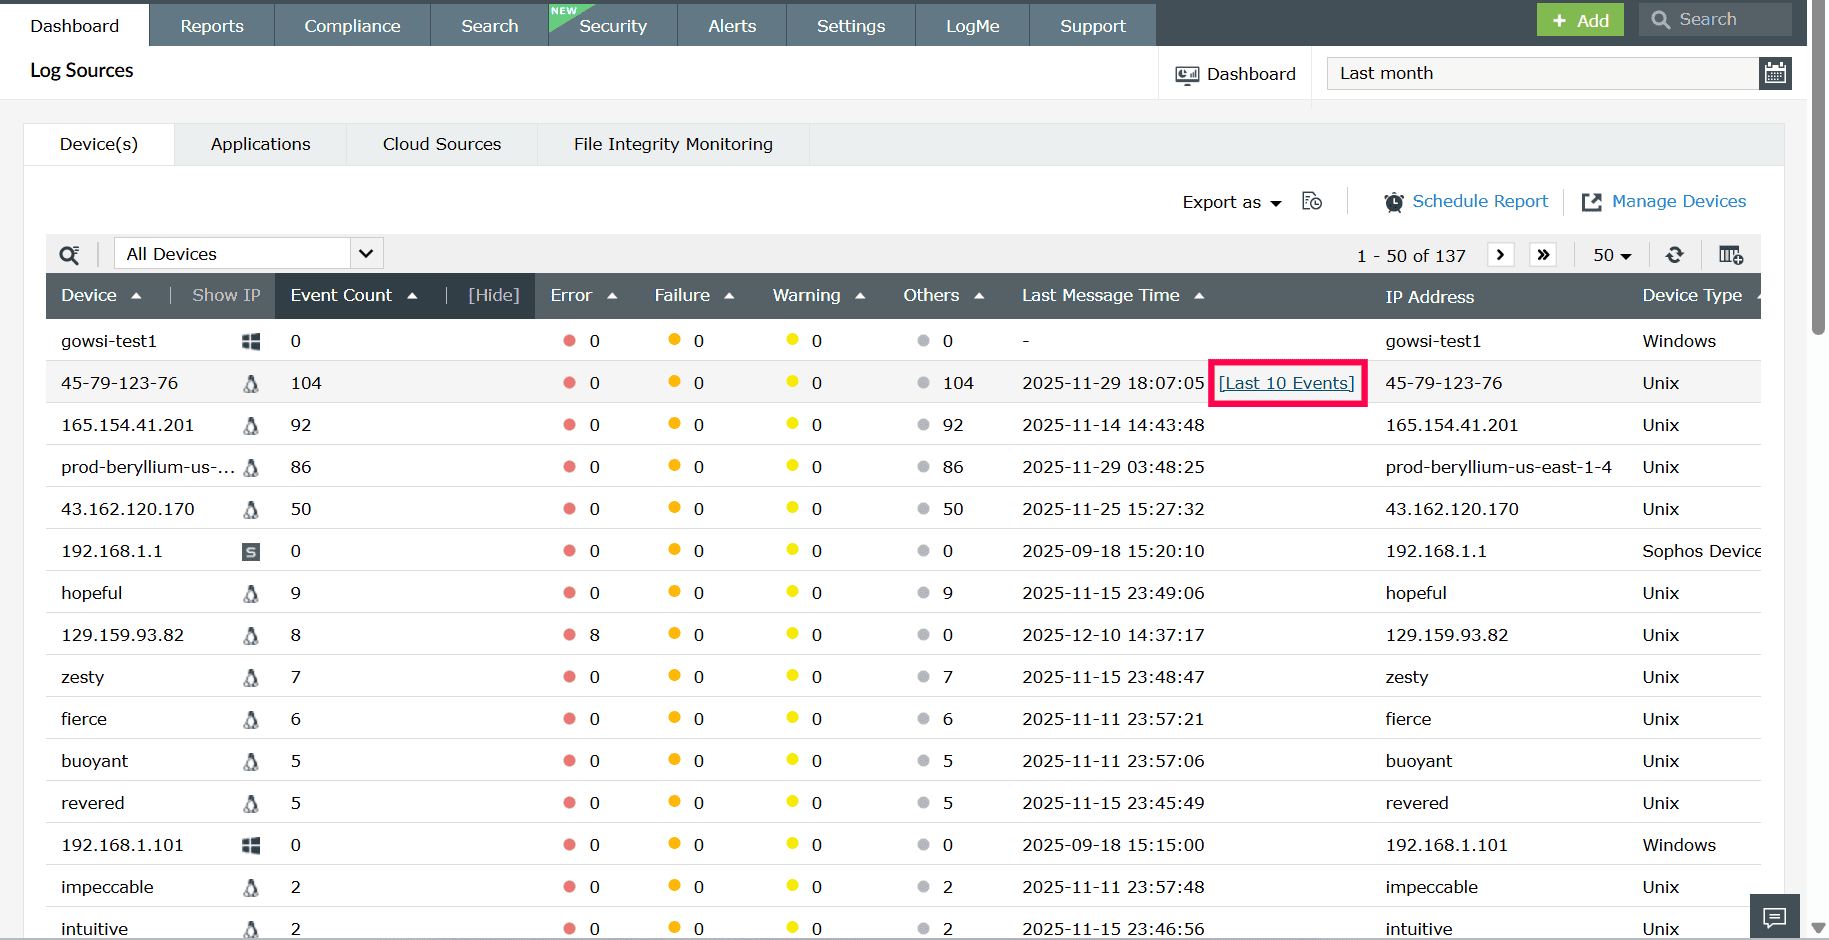
Figure 11: Saving changes to the dashboard
To resize the widgets in a tab,
- In the Dashboard, navigate to the tab whose widgets you want to resize.
- Click the icon on the top-right corner and select Reorder Widgets.
- Hover over the widget you want to resize, click the
 icon, and drag from the bottom-right corner to adjust the size as needed.
 - Click Save in the top-right corner to apply the changes to the dashboard.
Editing and deleting widgets
To edit a widget in a tab,
- In the Dashboard, click the
 icon and select Edit Widget corresponding to the widget that you want to edit.
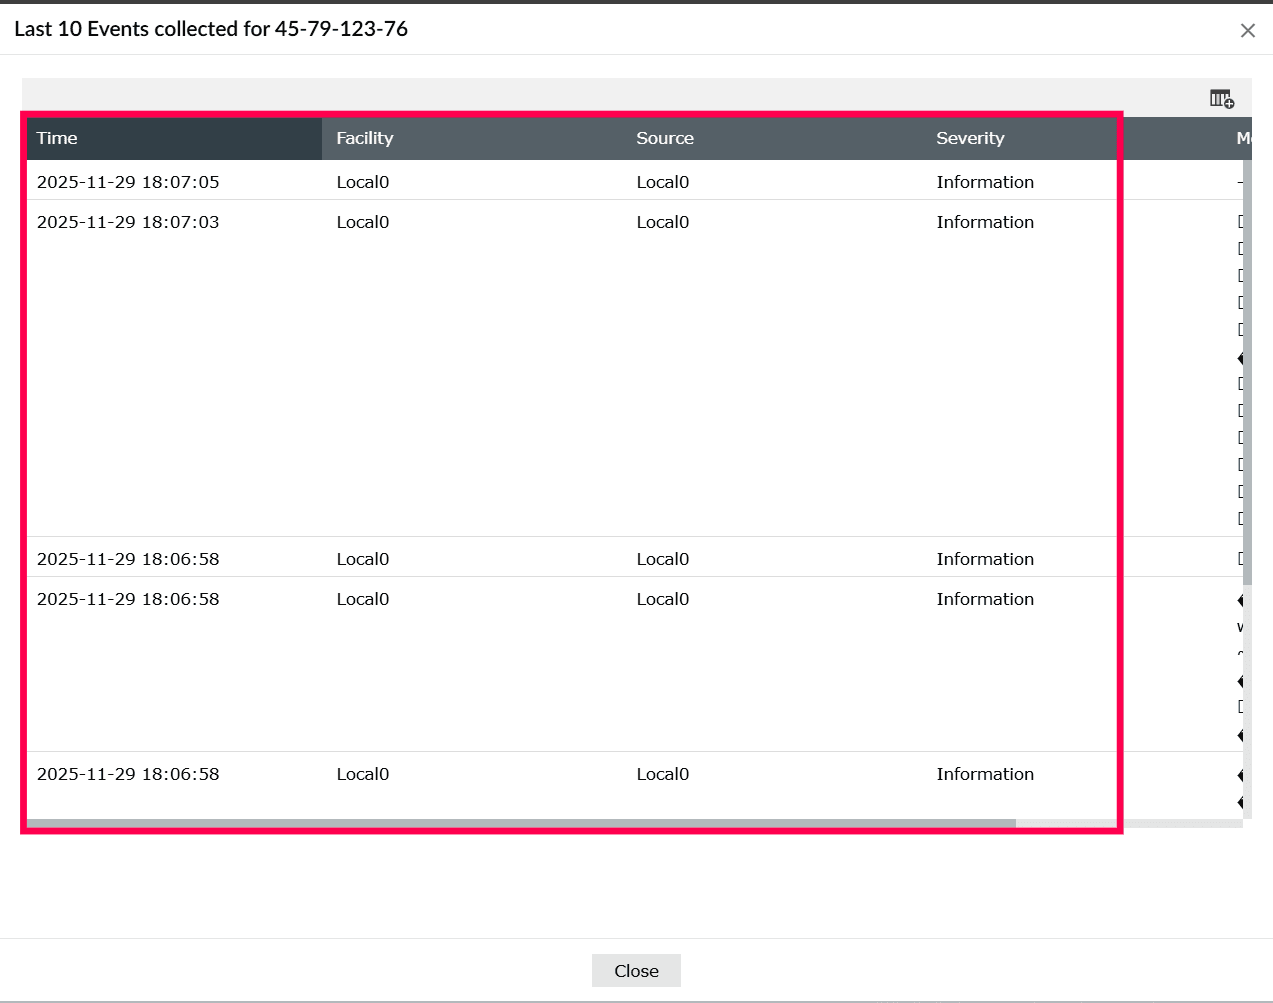
Figure 12: Editing a widget - Update the necessary information and click Update.
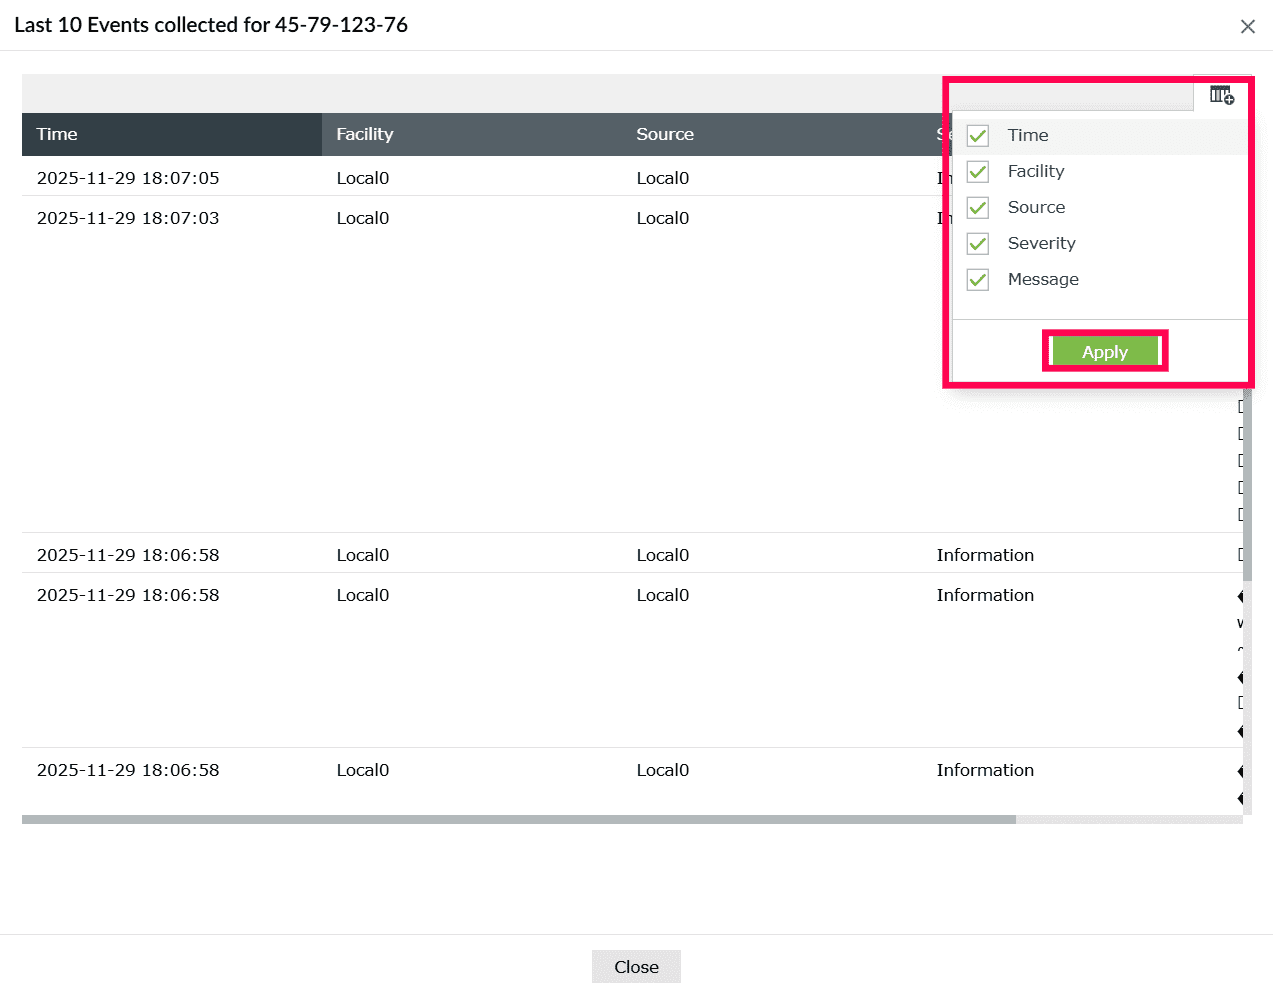
Figure 13: Editing a widget
To delete a widget from a tab,
- In the Dashboard, click the icon corresponding to the widget that you want to delete.
- Select Delete Widget.
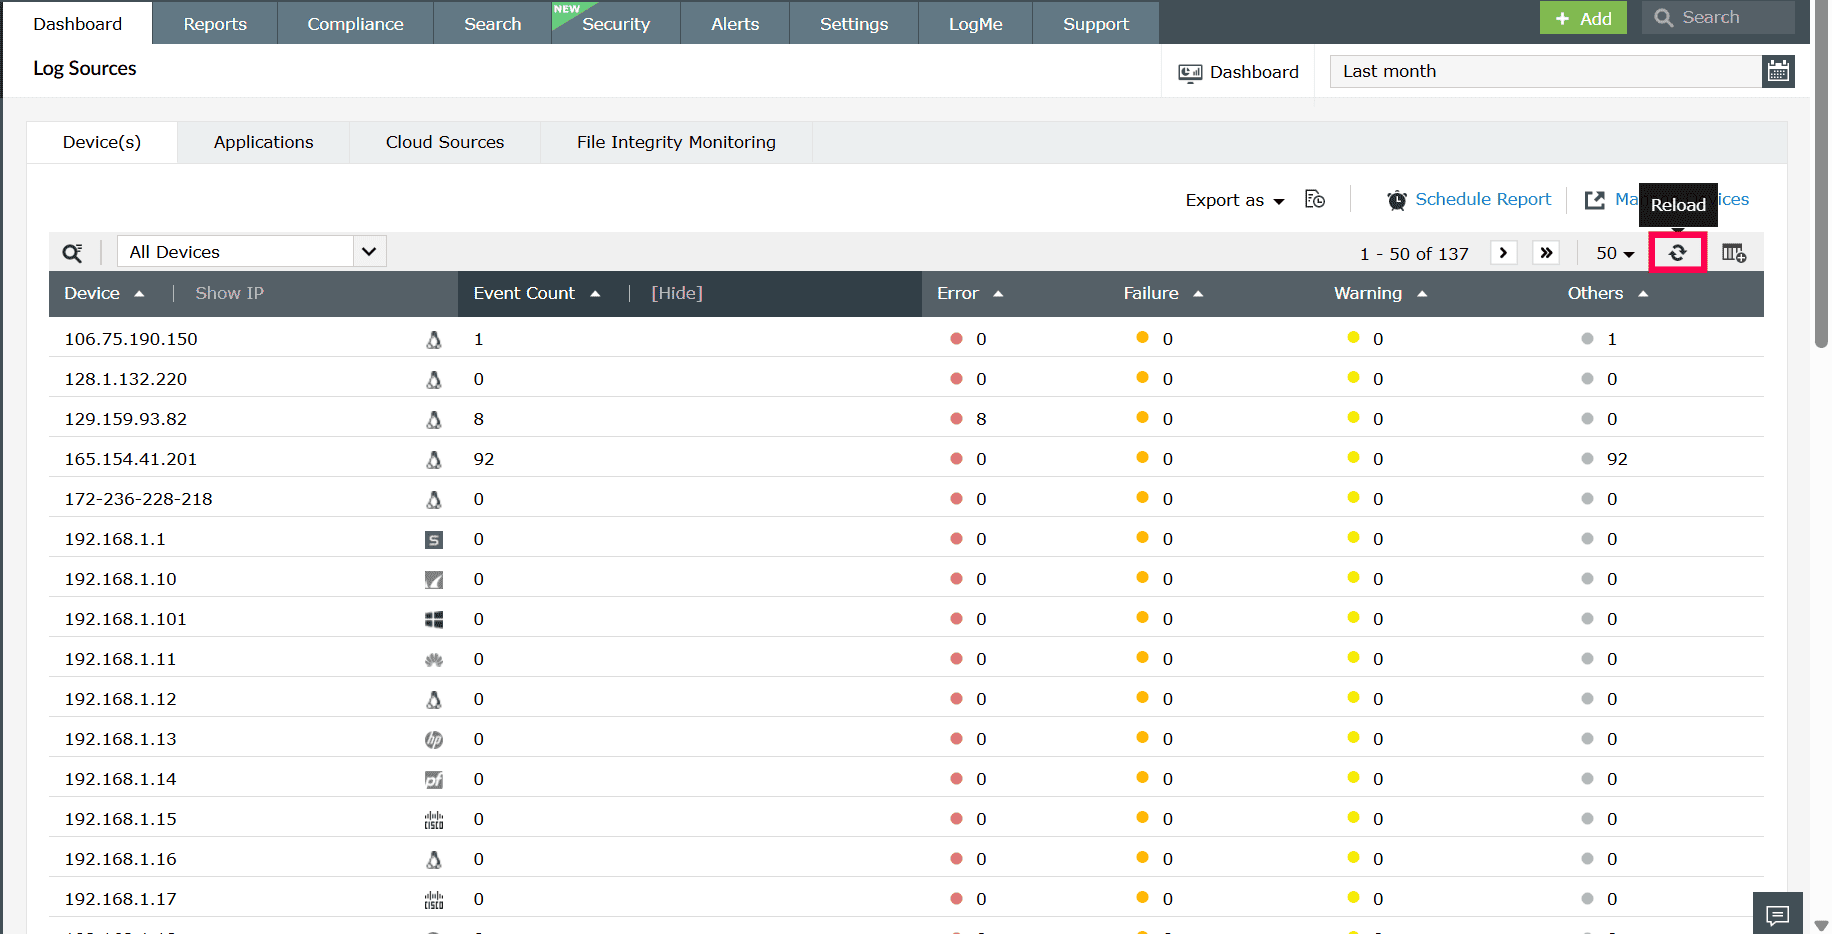
Figure 14: Deleting a widget - Click Yes in the pop-up box to complete the deletion.
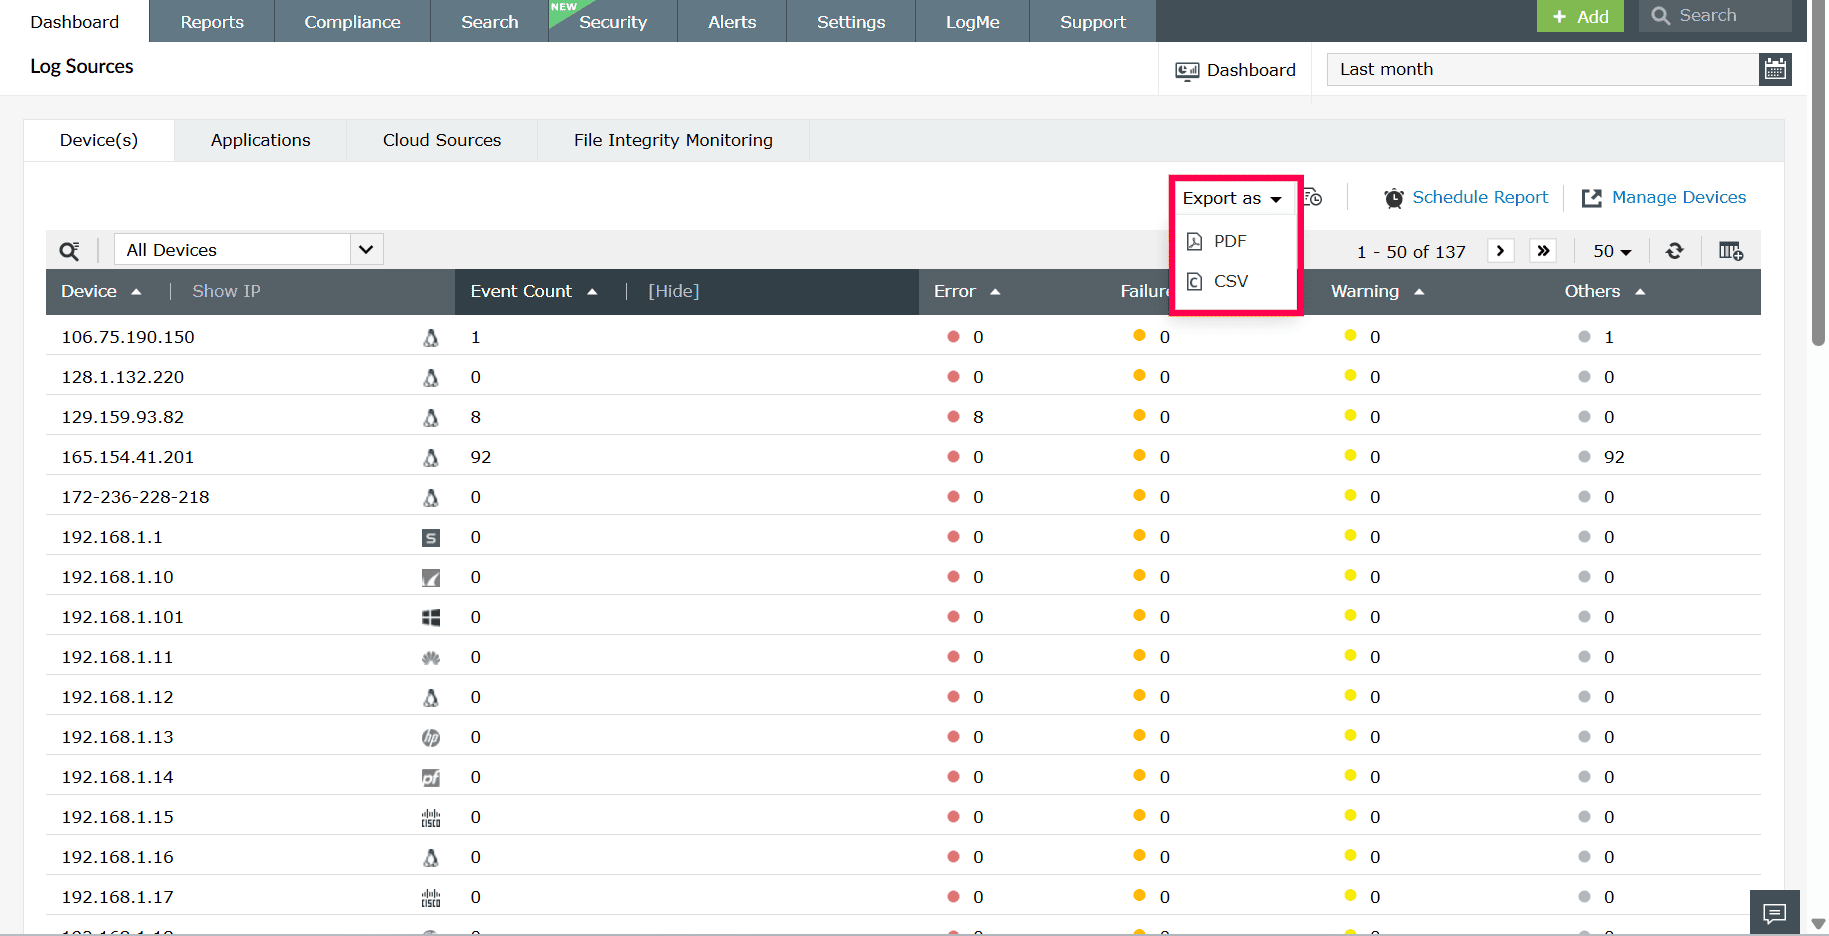
Figure 15: Confirming deletion of a widget
Viewing the dashboard in full screen mode
To view the dashboard in full screen,
- In the Dashboard, click the
 icon on the top-right corner.
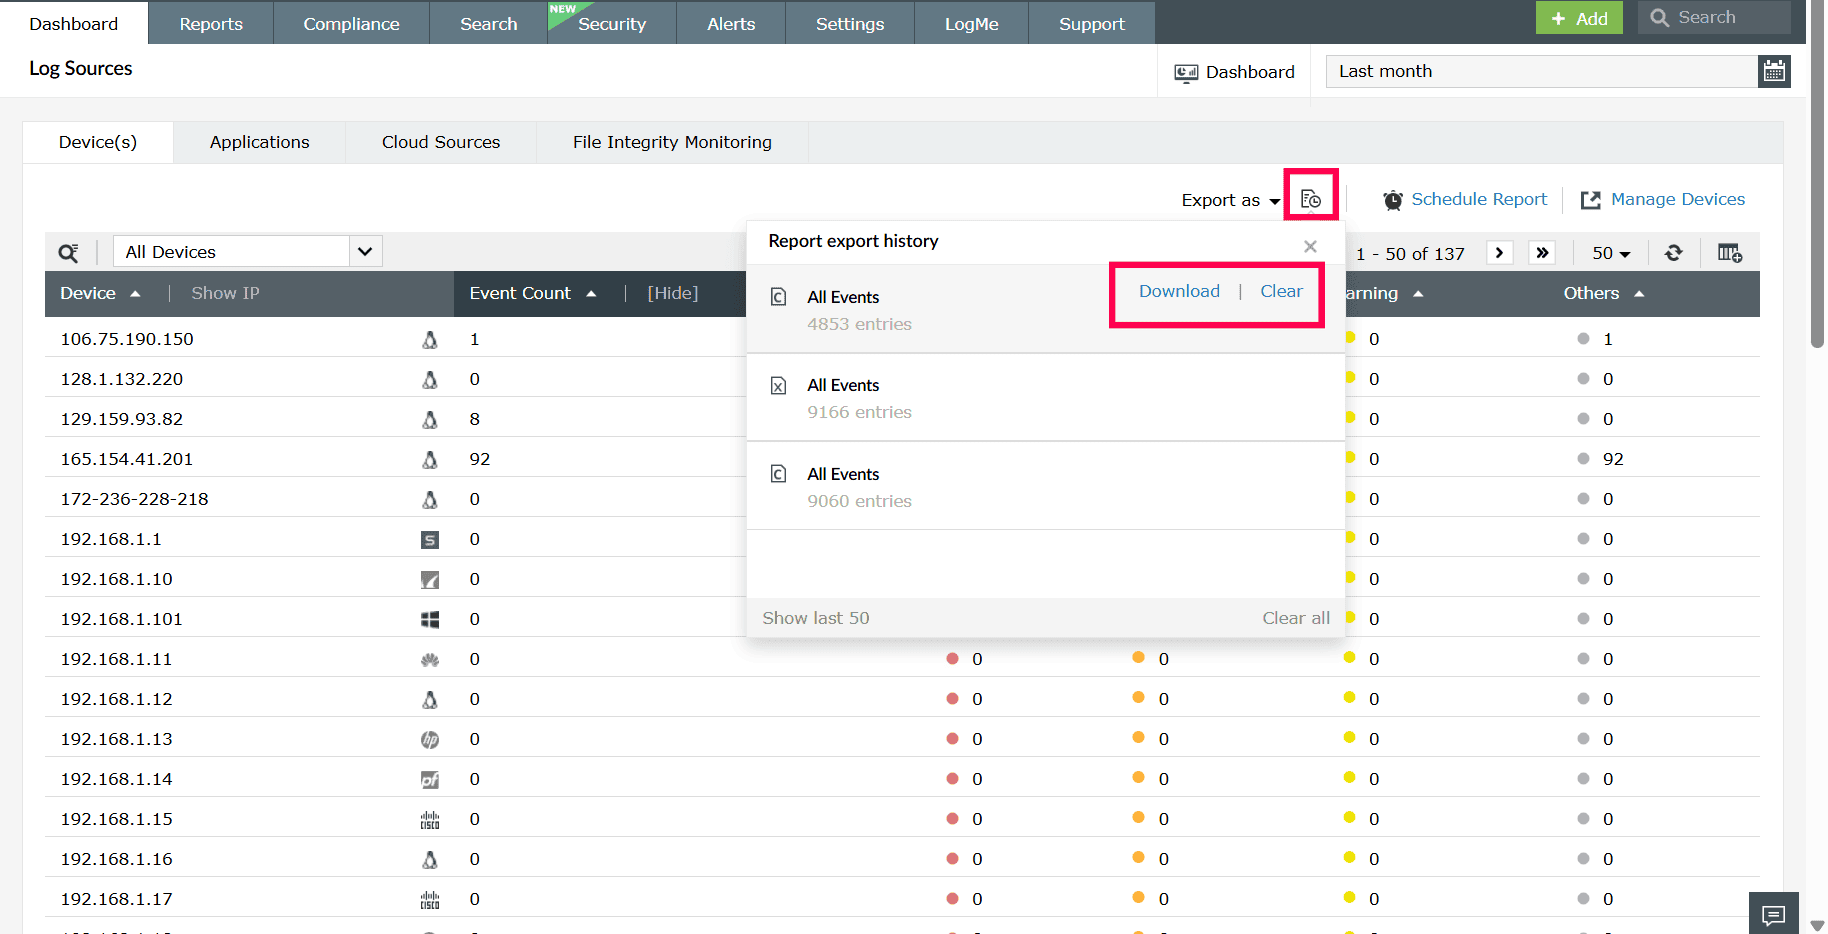
Figure 16: Viewing the dashboard in full screen mode - To start a slideshow of the tabs, click the play icon
 at the top of the screen.
 - To switch between tabs, click the drop-down button
 at the top of the screen.
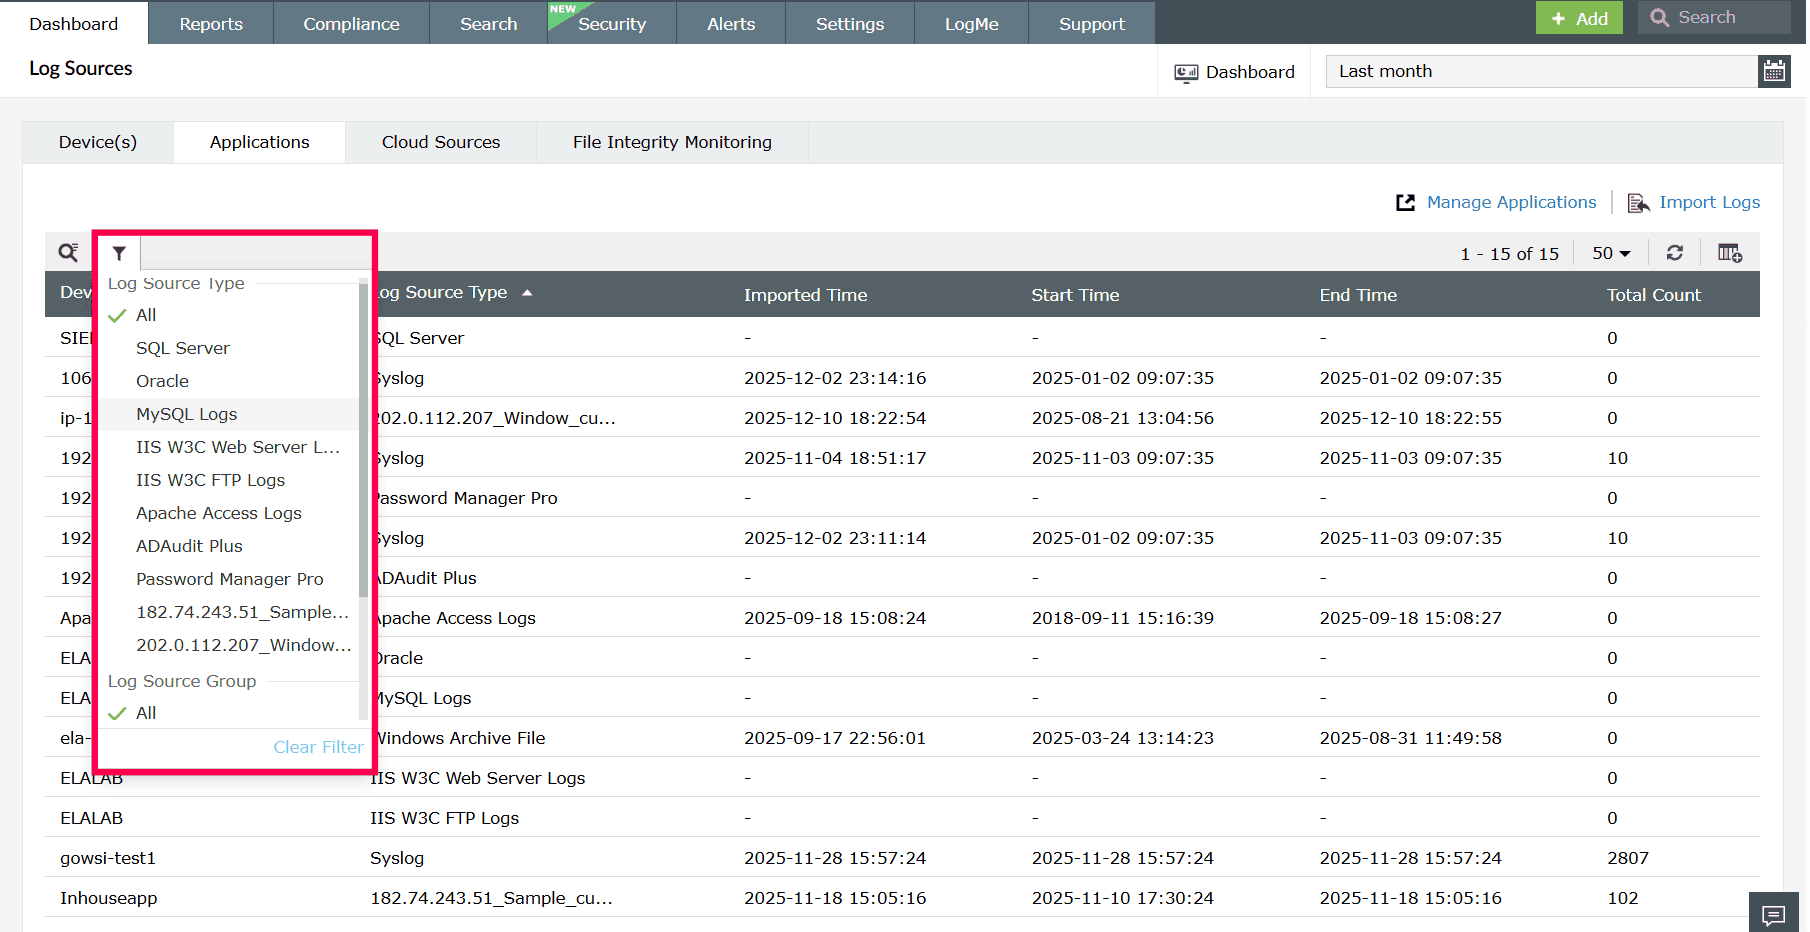
Figure 17: Switching between tabs - To remove a particular tab from the slideshow, click the toggle button
 next to the tab name in the drop-down list.
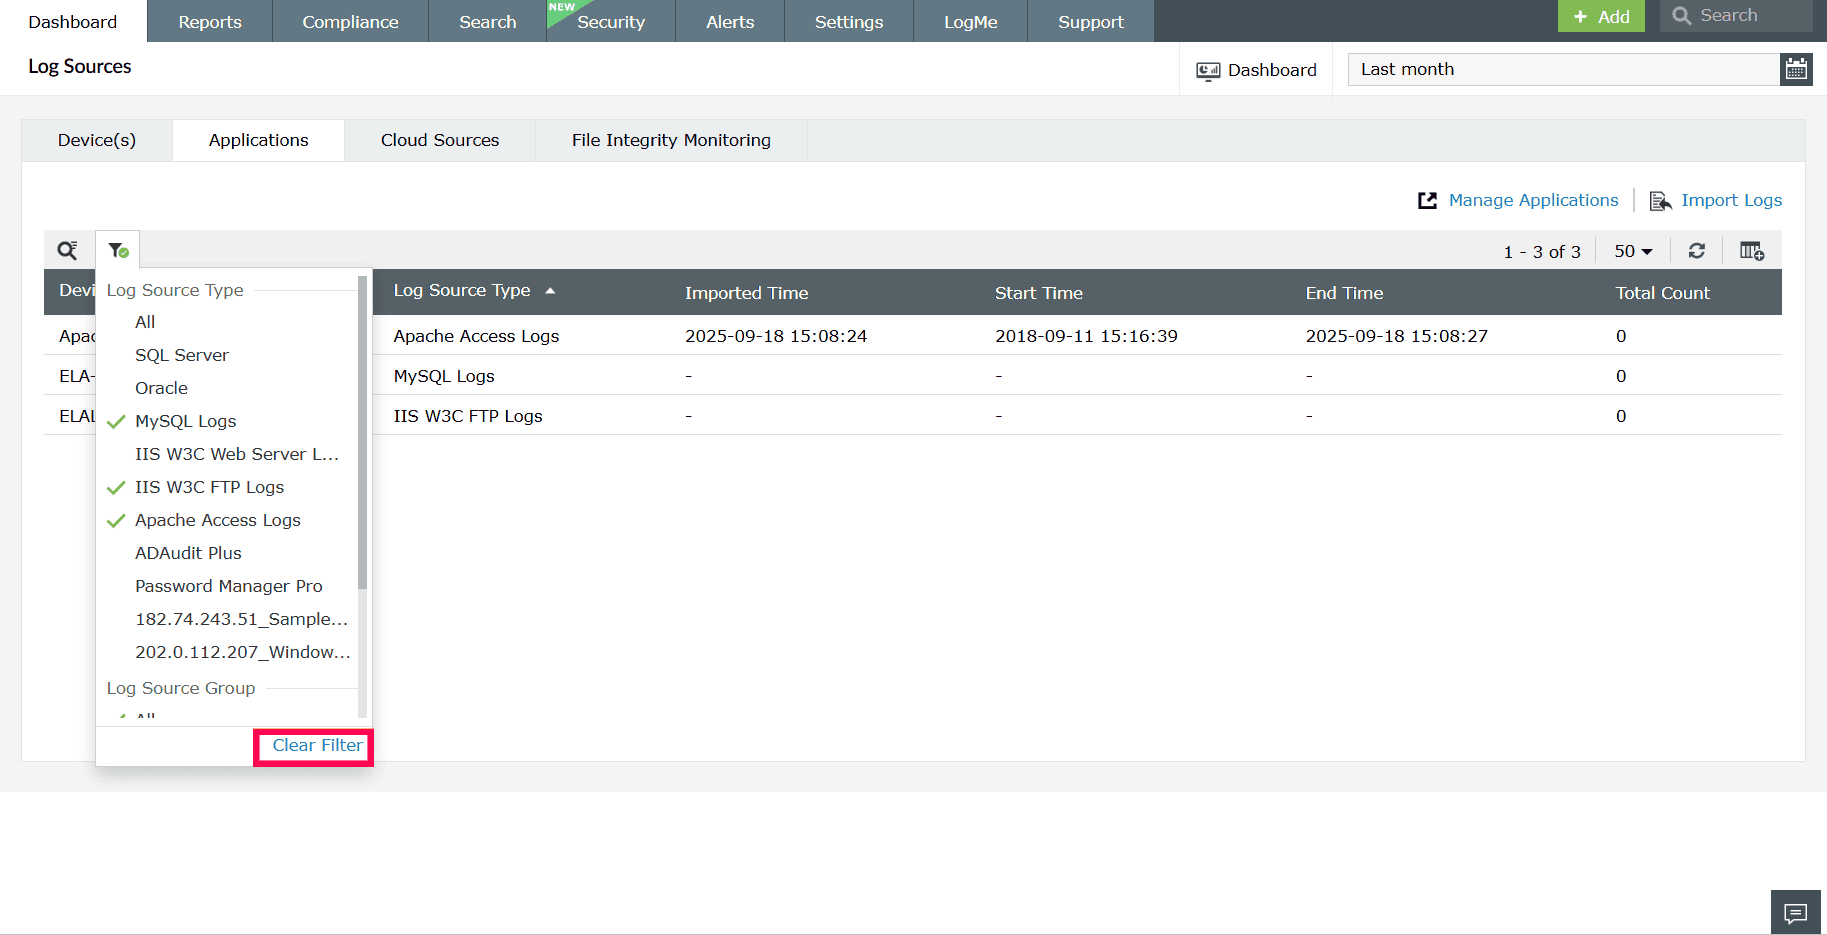
Figure 18: Removing a tab from the slideshow - To switch to dark mode, click the toggle button at the top-right corner of the screen.
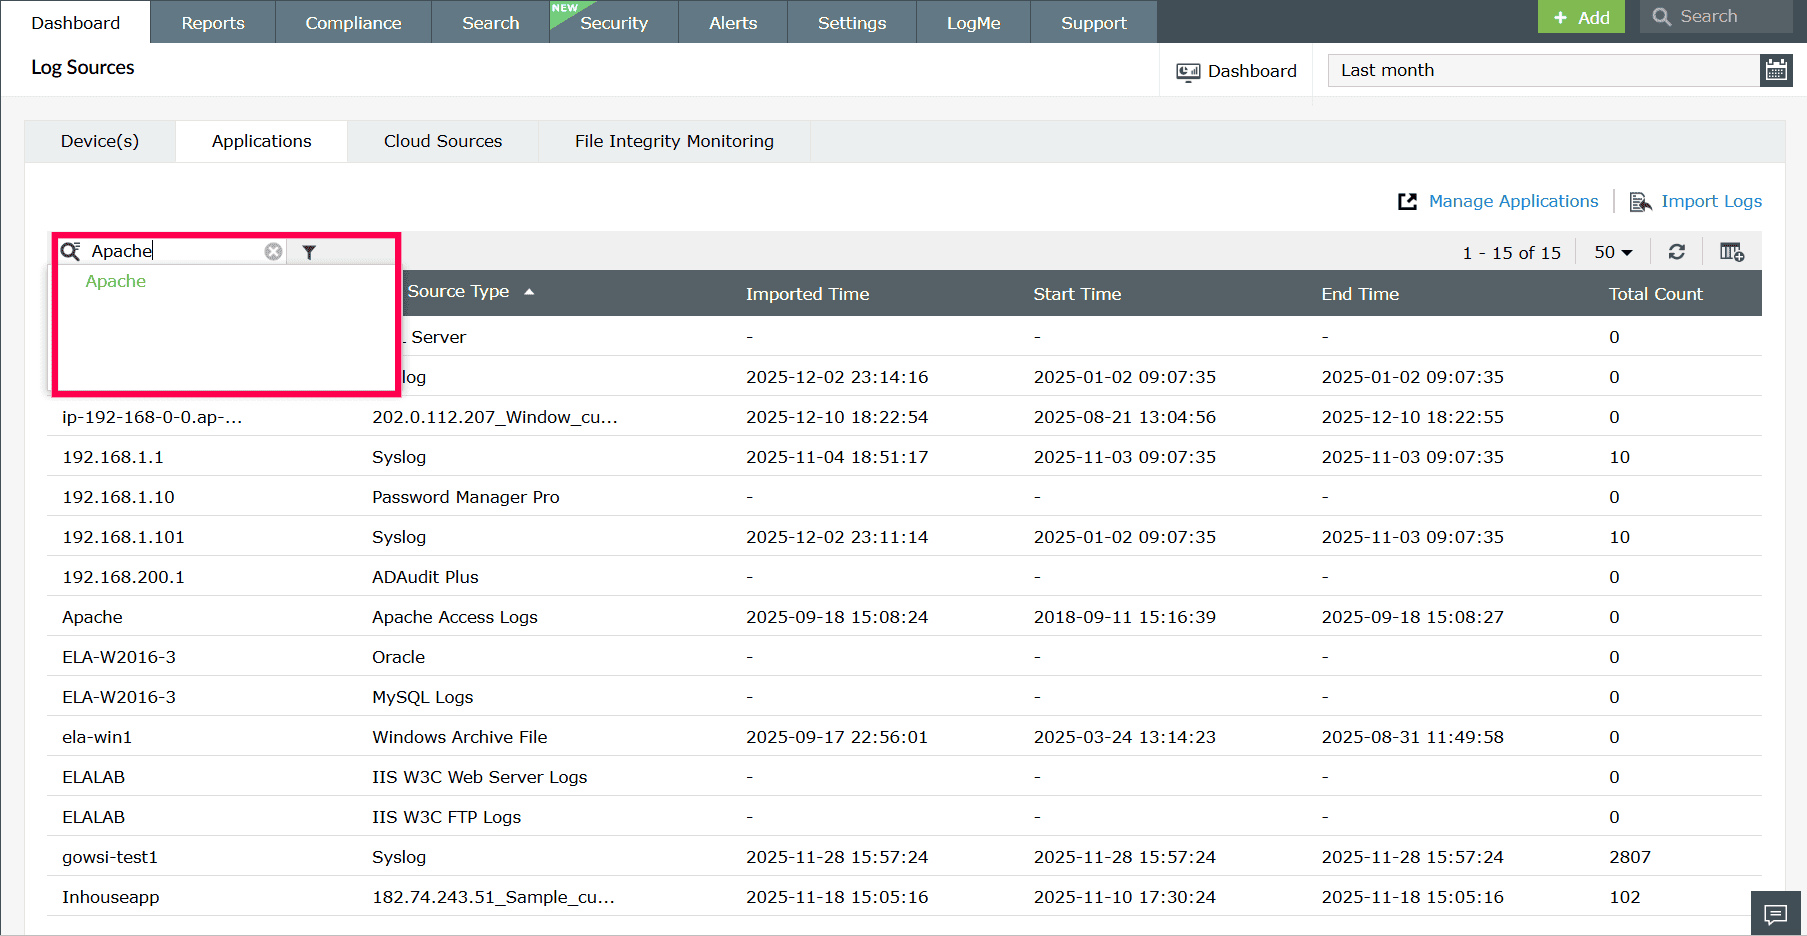
Figure 19: Switching to dark mode - To exit full screen mode, click the
 icon.
icon.
Viewing a widget in full screen mode
To view a widget in full screen, in the dashboard, click the icon on the top-right corner of the widget you want to view.
Refreshing the dashboard and widgets
To refresh the entire dashboard,
- In the Dashboard, click the
 icon on the top-right corner of the screen.
Figure 21: Refreshing the dashboard
To refresh a particular widget,
- In the Dashboard, click the icon on the top-right corner of the specific widget.
Figure 22: Refreshing a widget
Changing refresh interval
To change the time interval for the automatic refreshing of the dashboard,
- In the Dashboard, click the icon on the top-right corner and select Refresh Interval.
Figure 23: Configuring Refresh Interval in the dashboard - In the Dashboard Refresh window, select the refresh interval: Never, 30 seconds, 1 minute, 5 minutes, 10 minutes, or 1 hour.
NOTE If you select Never, the dashboard will not refresh automatically. You will need to refresh it manually.
Figure 24: Changing the refresh interval - Click Save to apply the changes to the dashboard.
NOTE Watch this video for a step-by-step demonstration of customizing the dashboard.
Read also
This page explained about customizing the Log360 dashboard to tailor tabs and widgets. To learn more about predefined dashboard views and widget management, refer to the following documents: