# CPU Memory Disk Performance Monitor — ManageEngine OpManager
## CPU & Memory Monitoring Software
When you identify server performance degradation, the usual suspects are CPU, memory, and the disk. OpManager's [hardware monitor](https://www.manageengine.com/network-monitoring/hardware-monitoring.html) scrutinizes these system resources on Windows and Unix-based servers and spots performance bottlenecks early on. OpManager uses SNMP, WMI, or SSH protocol to monitor the host resources and gathers performance data.
Using OpManager you can:
## Start monitoring to manage CPU, Memory, and Disk utilization instantly
- Find CPU, [Disk Space Monitor](https://www.manageengine.com/network-monitoring/disk-space-monitor.html?disk-space-monitor), and memory utilization monitors associated out-of-the-box for close to a dozen server types.
- Spot high resource utilization at a glance using the intuitive dials in snapshot page.
- Monitor multiple processors with detailed utilization reports for each CPU instance.
- Fine tune the monitoring configurations right from the snapshot page and narrow down a problem more quickly.
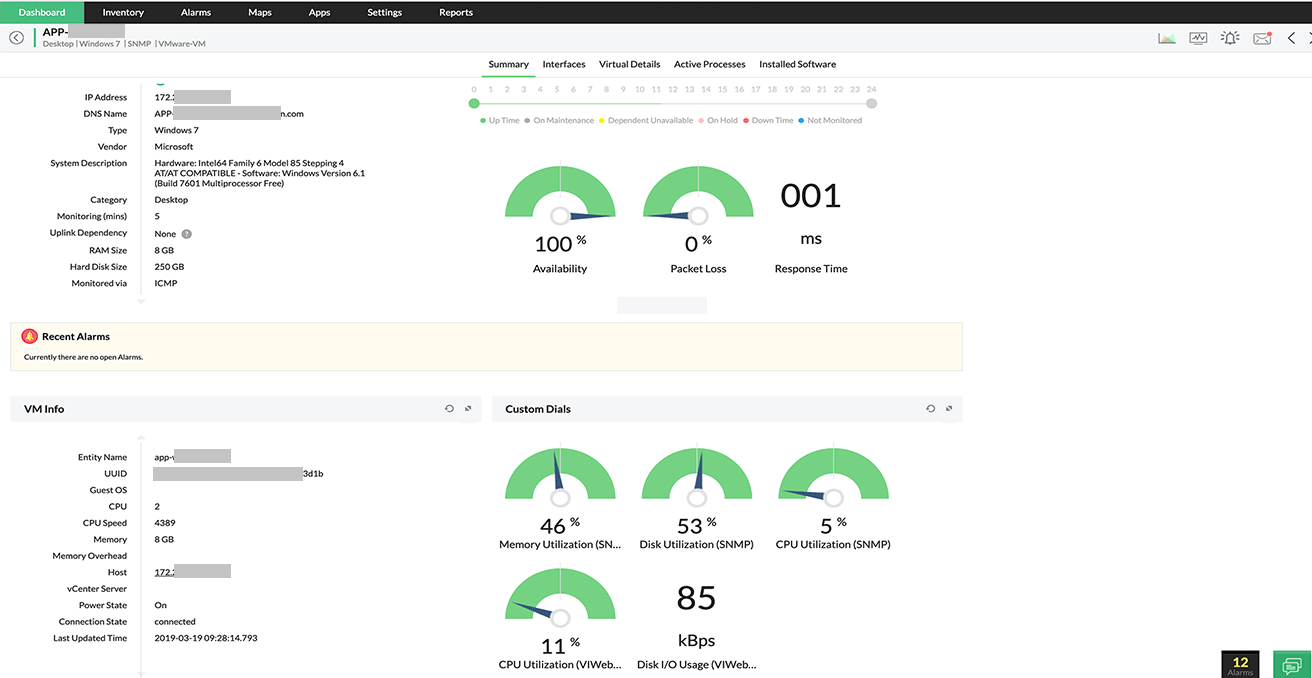
Monitor CPU Memory Disk with **server resource performance dials.**
CPU monitor configuration screen. One can **set a threshold and test the monitor** to gauge the current performance statistics in a click.
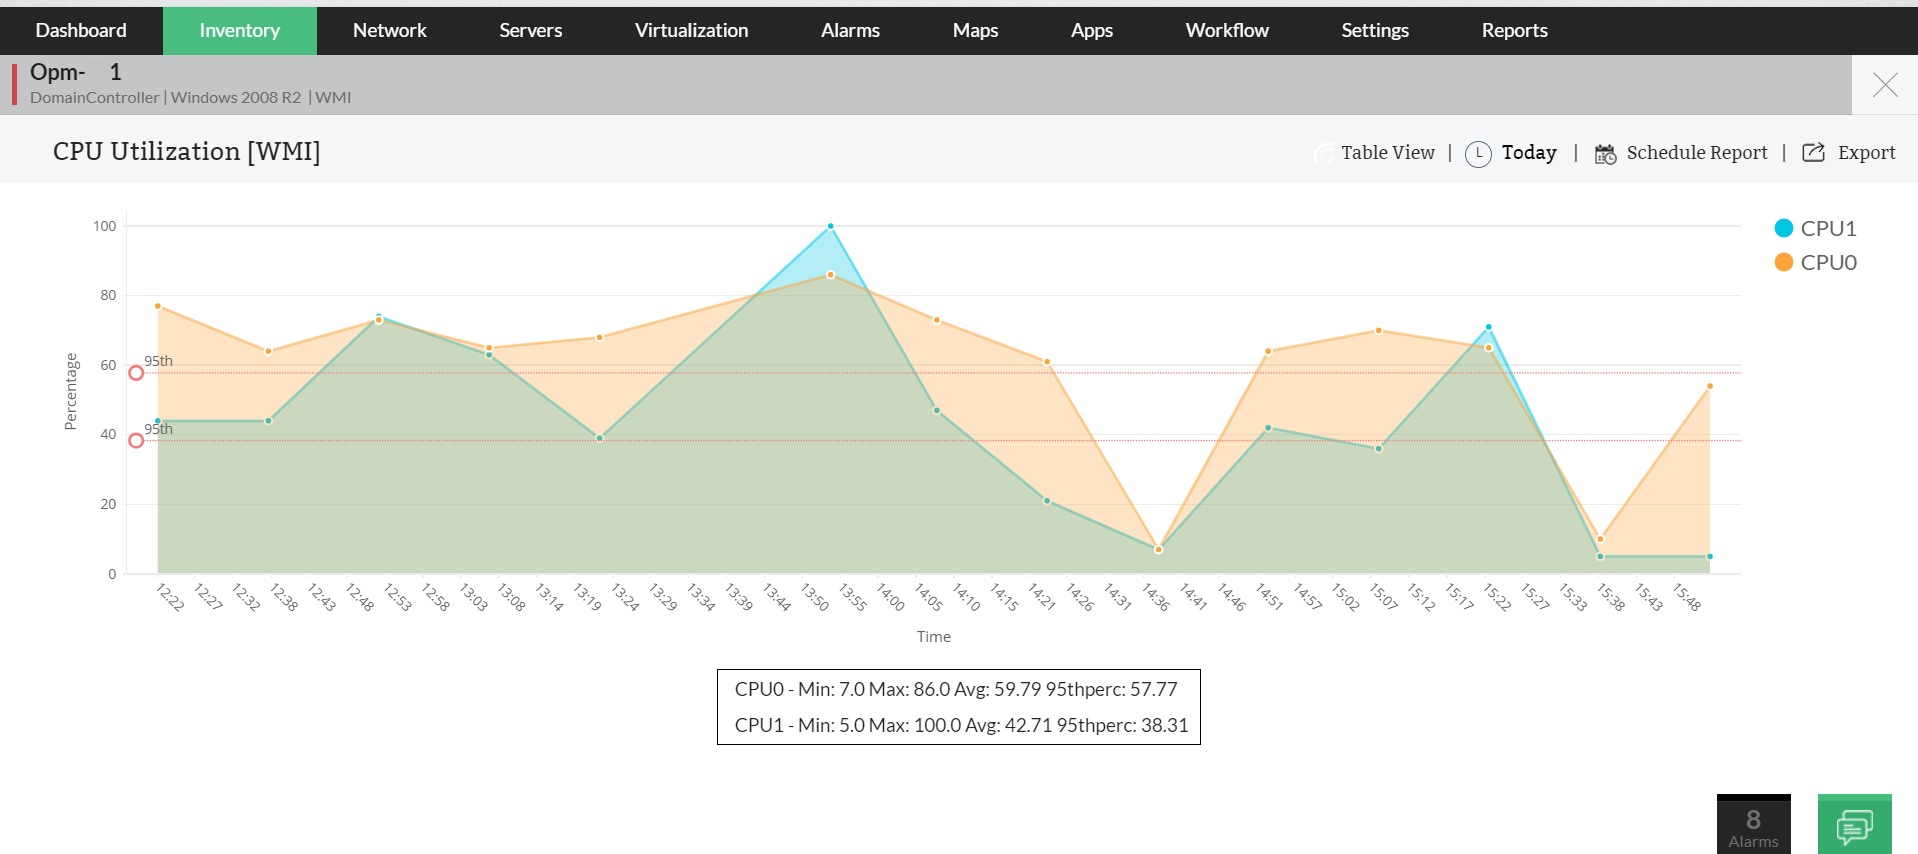
**CPU monitor's utilization graph** for a quad-core CPU.
Discover more of OpManager's [Server Monitoring](https://www.manageengine.com/network-monitoring/server-monitoring.html) capabilities
[VMware monitoring](https://www.manageengine.com/network-monitoring/vmware-monitoring.html) | [Service monitoring](https://www.manageengine.com/network-monitoring/service-monitoring.html) | [Process monitoring](https://www.manageengine.com/network-monitoring/process-monitoring.html) | [Windows services monitoring](https://www.manageengine.com/network-monitoring/windows-service-monitoring.html) | [Eventlog monitoring](https://www.manageengine.com/network-monitoring/eventlog-monitoring.html) | [URL monitoring](https://www.manageengine.com/network-monitoring/url-monitoring.html)
## Monitor over 25 different Memory, Disk, and CPU metrics across Servers
- Add more memory, disk or CPU monitors for other resource metrics based on the server need.
- Quickly find out what is causing application slowness despite normal resource utilization. The actual metric at fault could be the % processor time, the queue length, or a critical memory monitoring metric (maybe a fast eroding available physical memory) that is impacting the application performance!
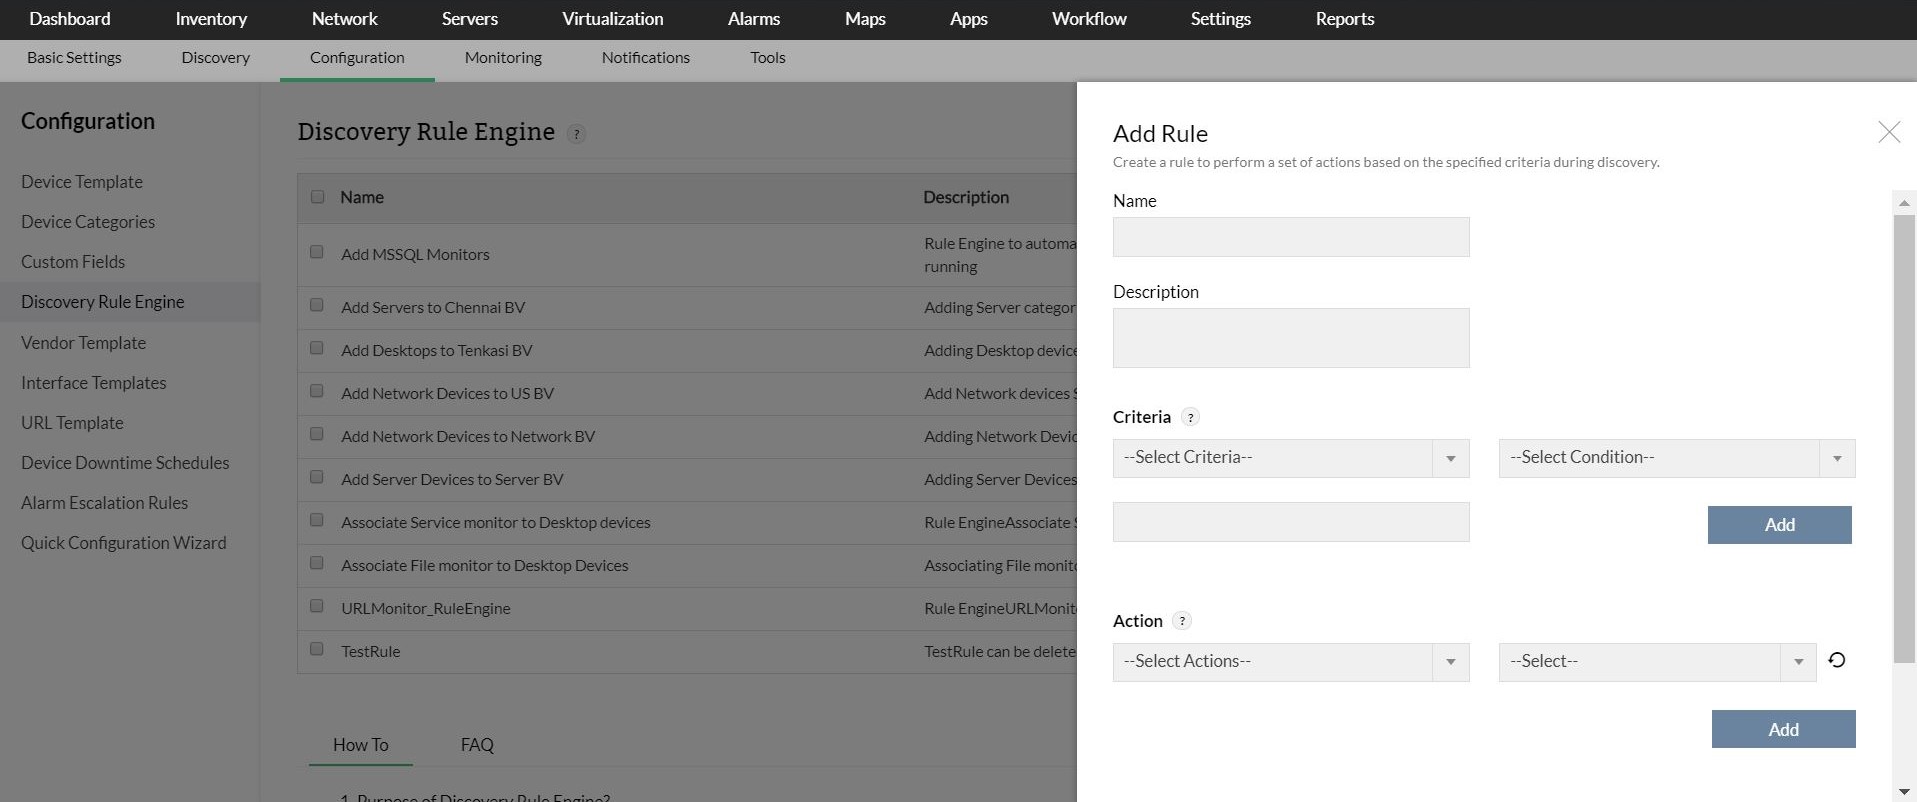
- Define more custom monitors (with options to apply expressions) for these resources using WMI scripts or CLI commands, or by simply querying the relevant SNMP variables.
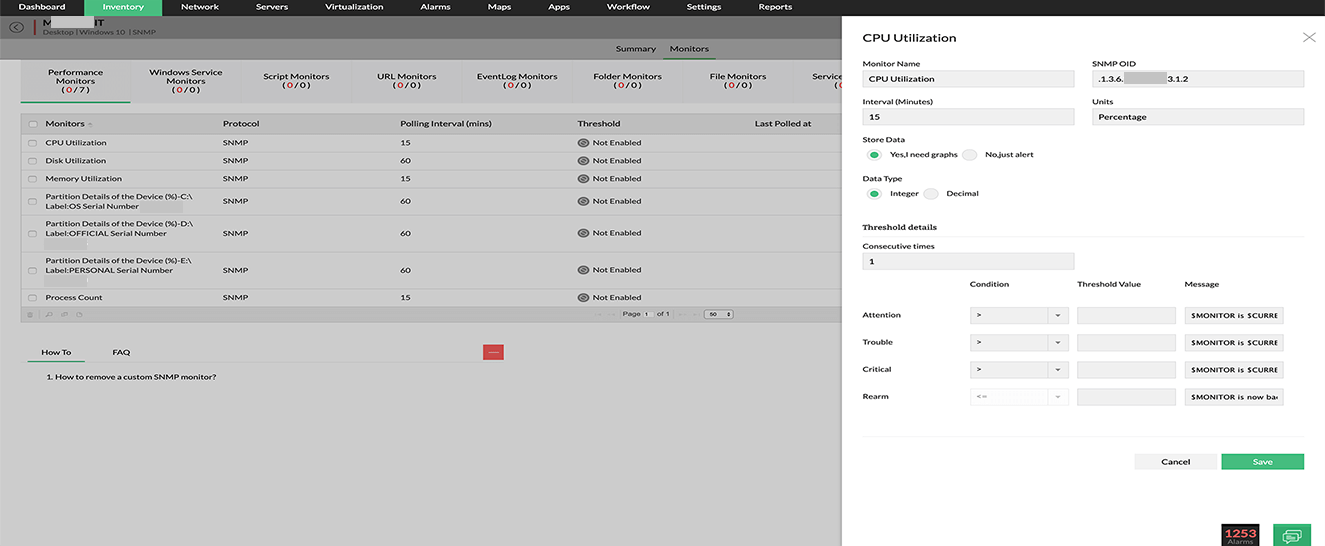
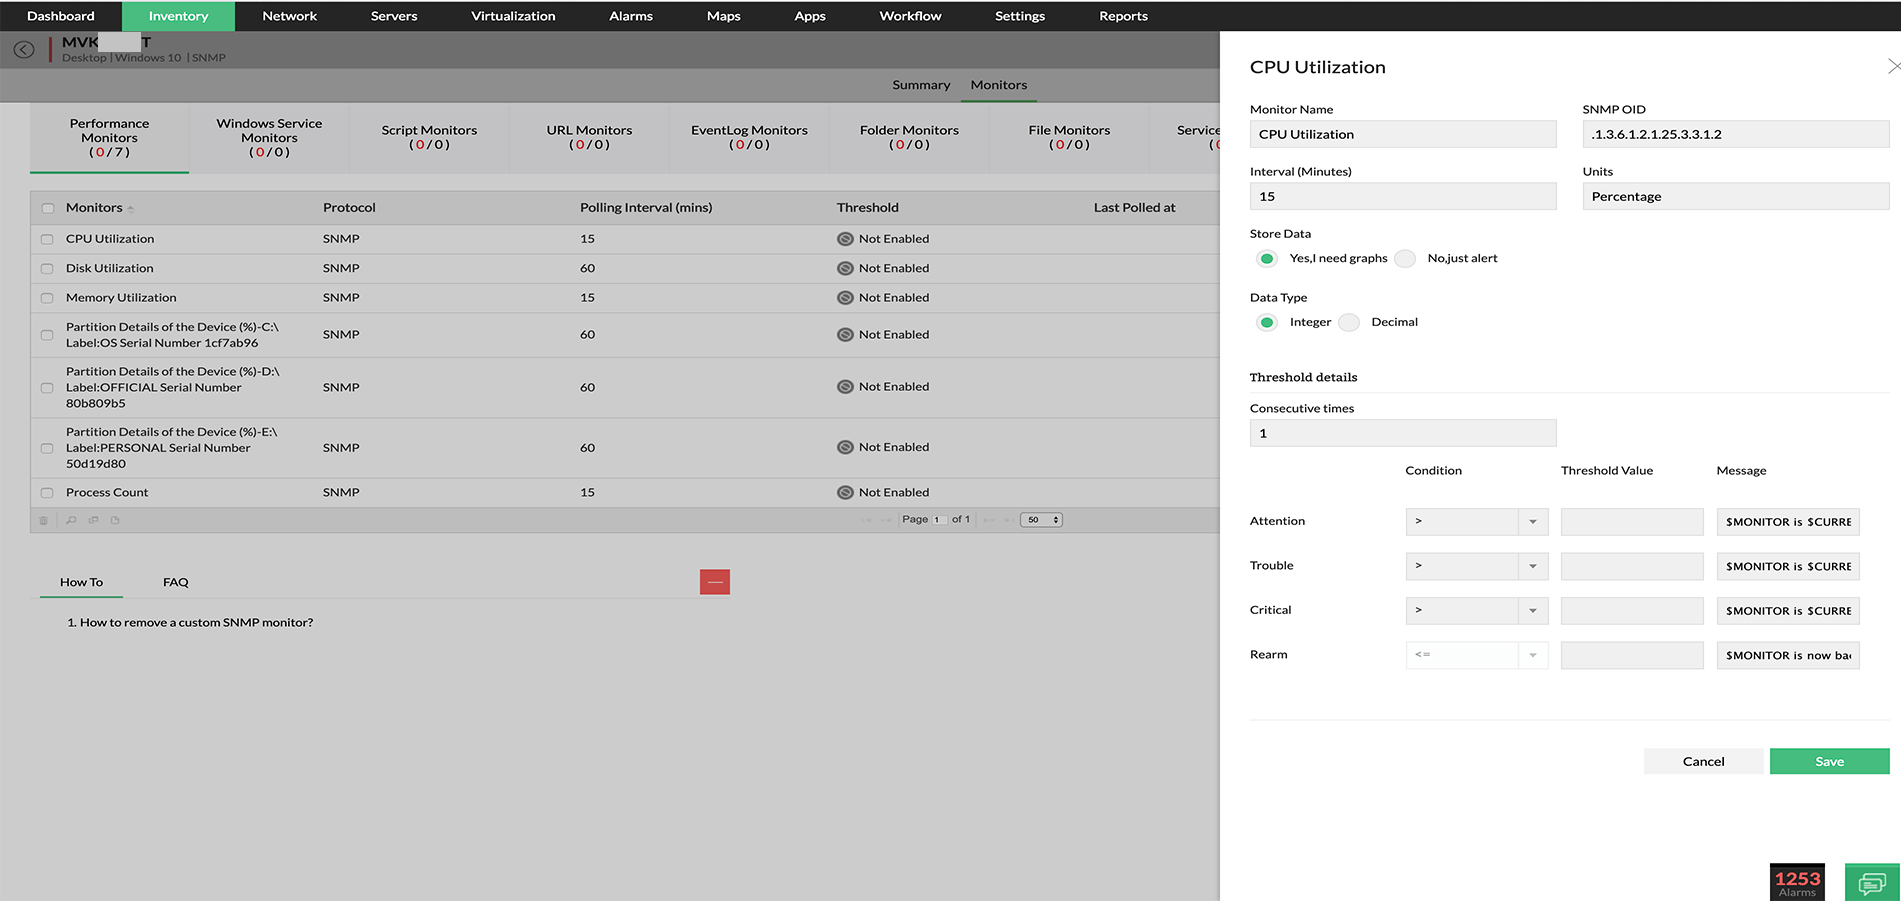
Screenshot showing creation of a **custom SNMP monitor** for CPU utilization.
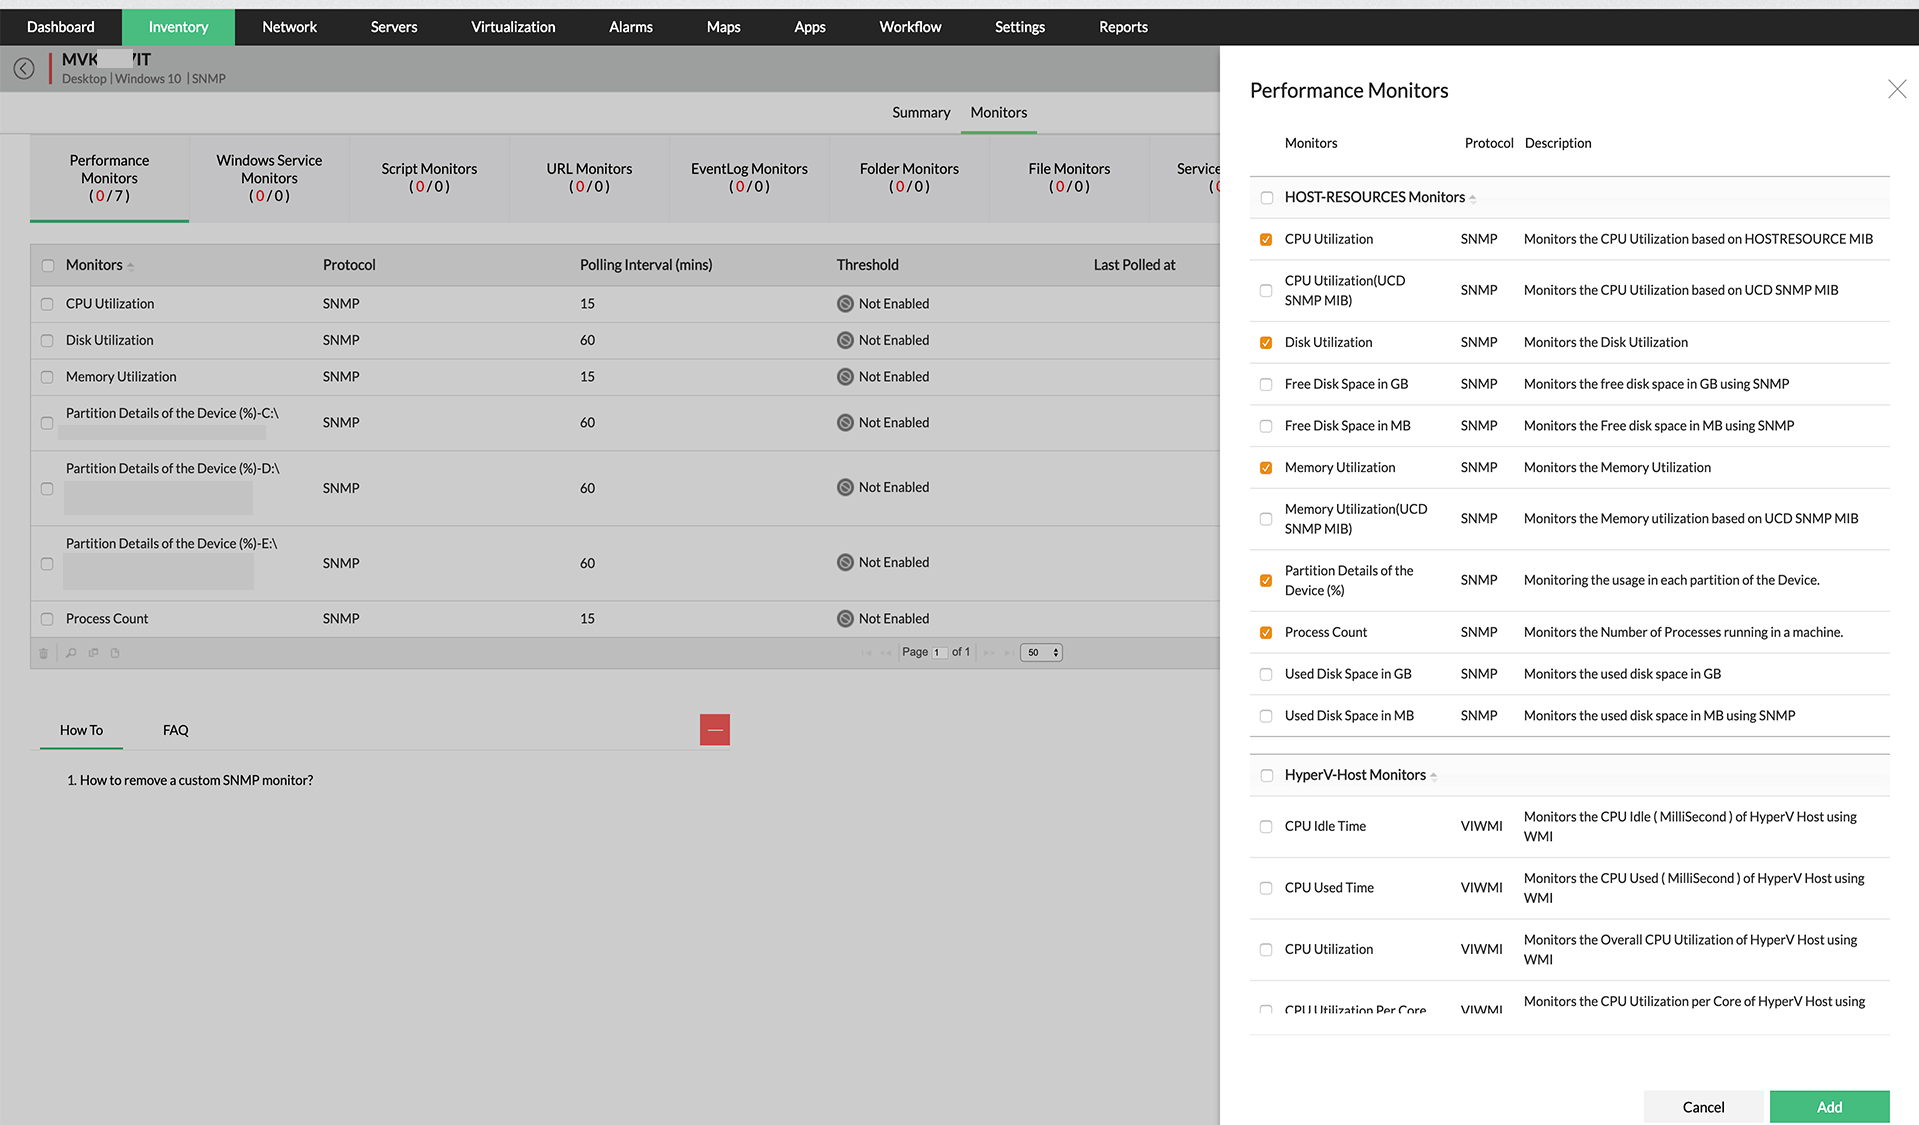
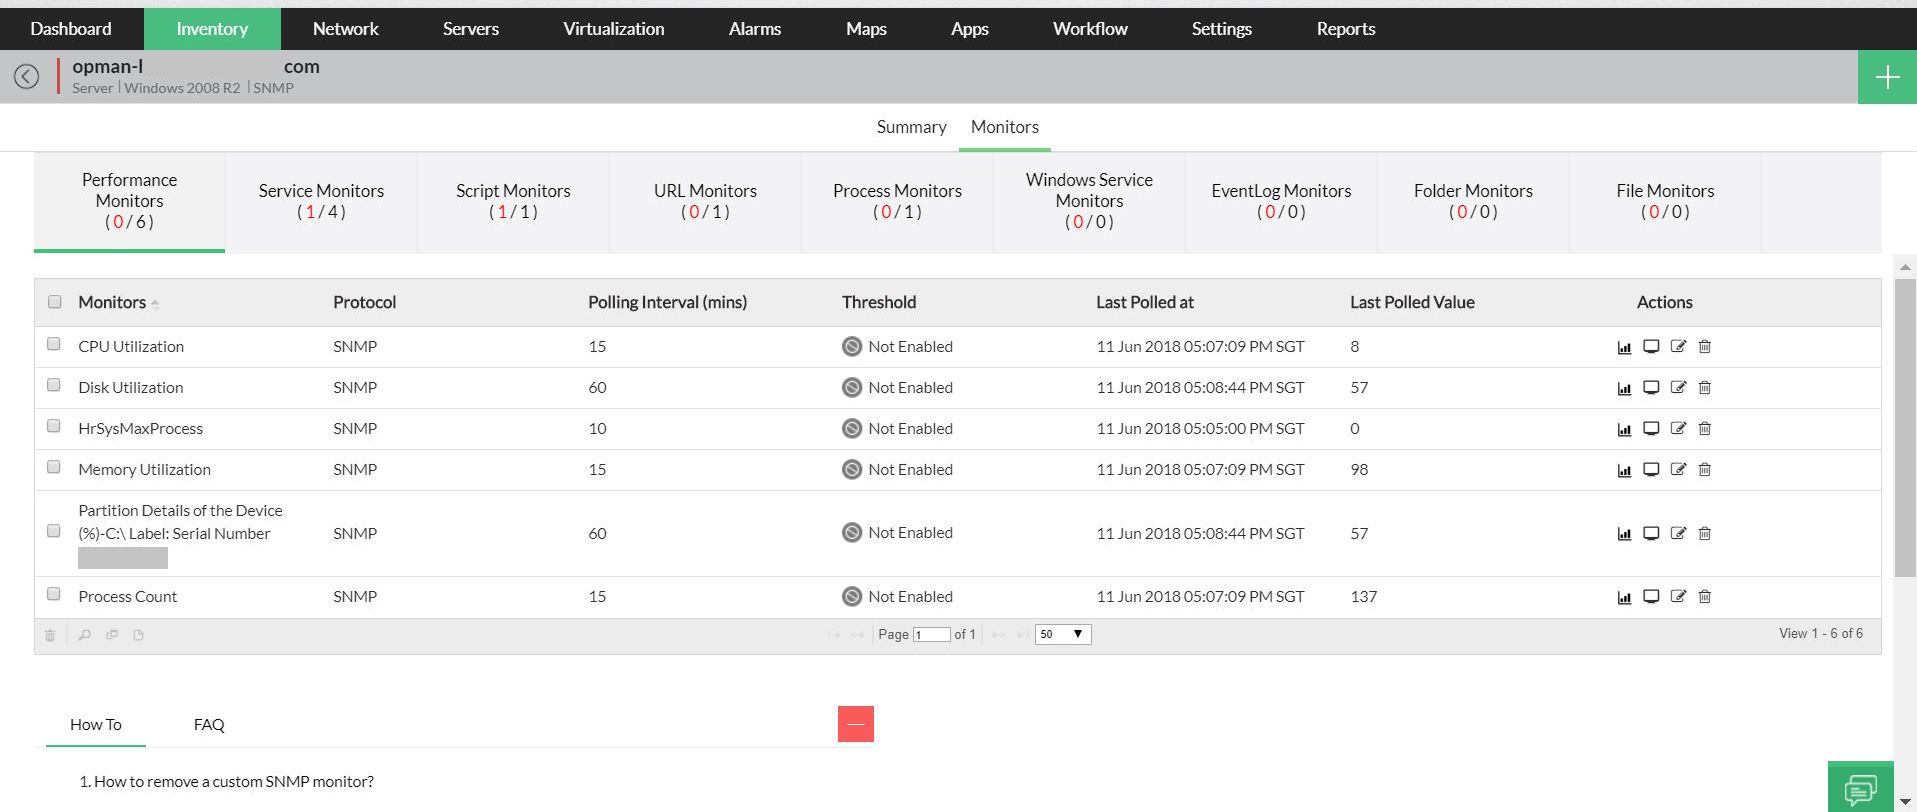
A collection of different **host resource performance monitors** from the server snapshot page.
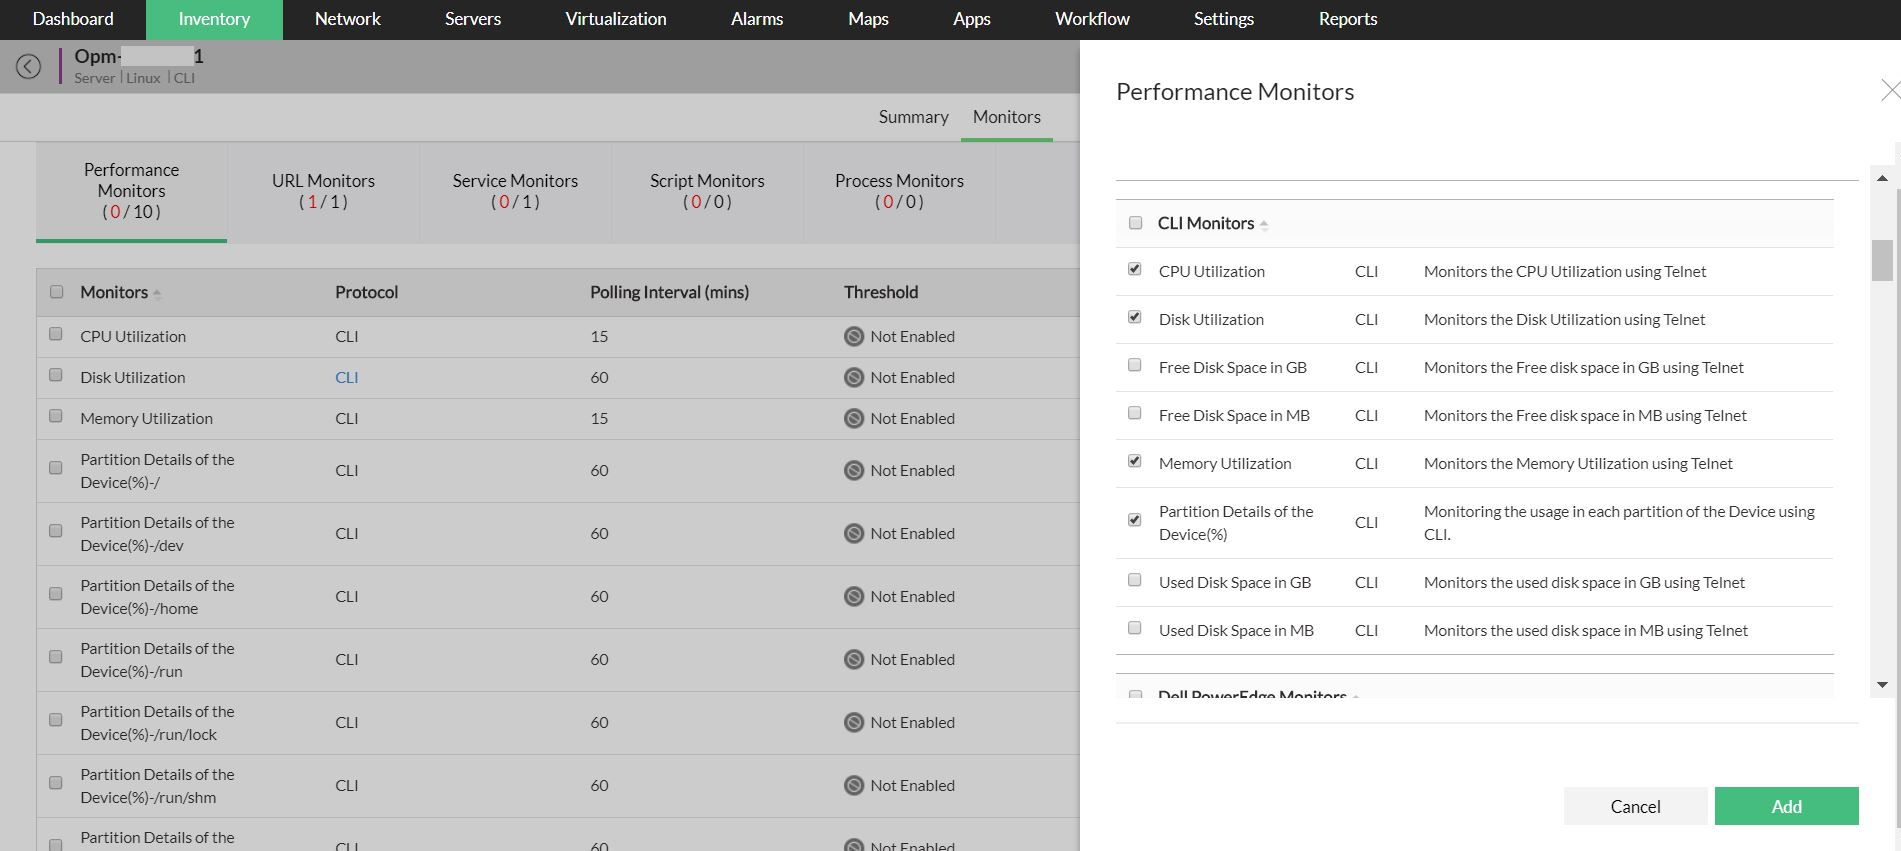
The list of Command Line Interface (CLI) server performance **monitors for Linux or Unix-based devices**.
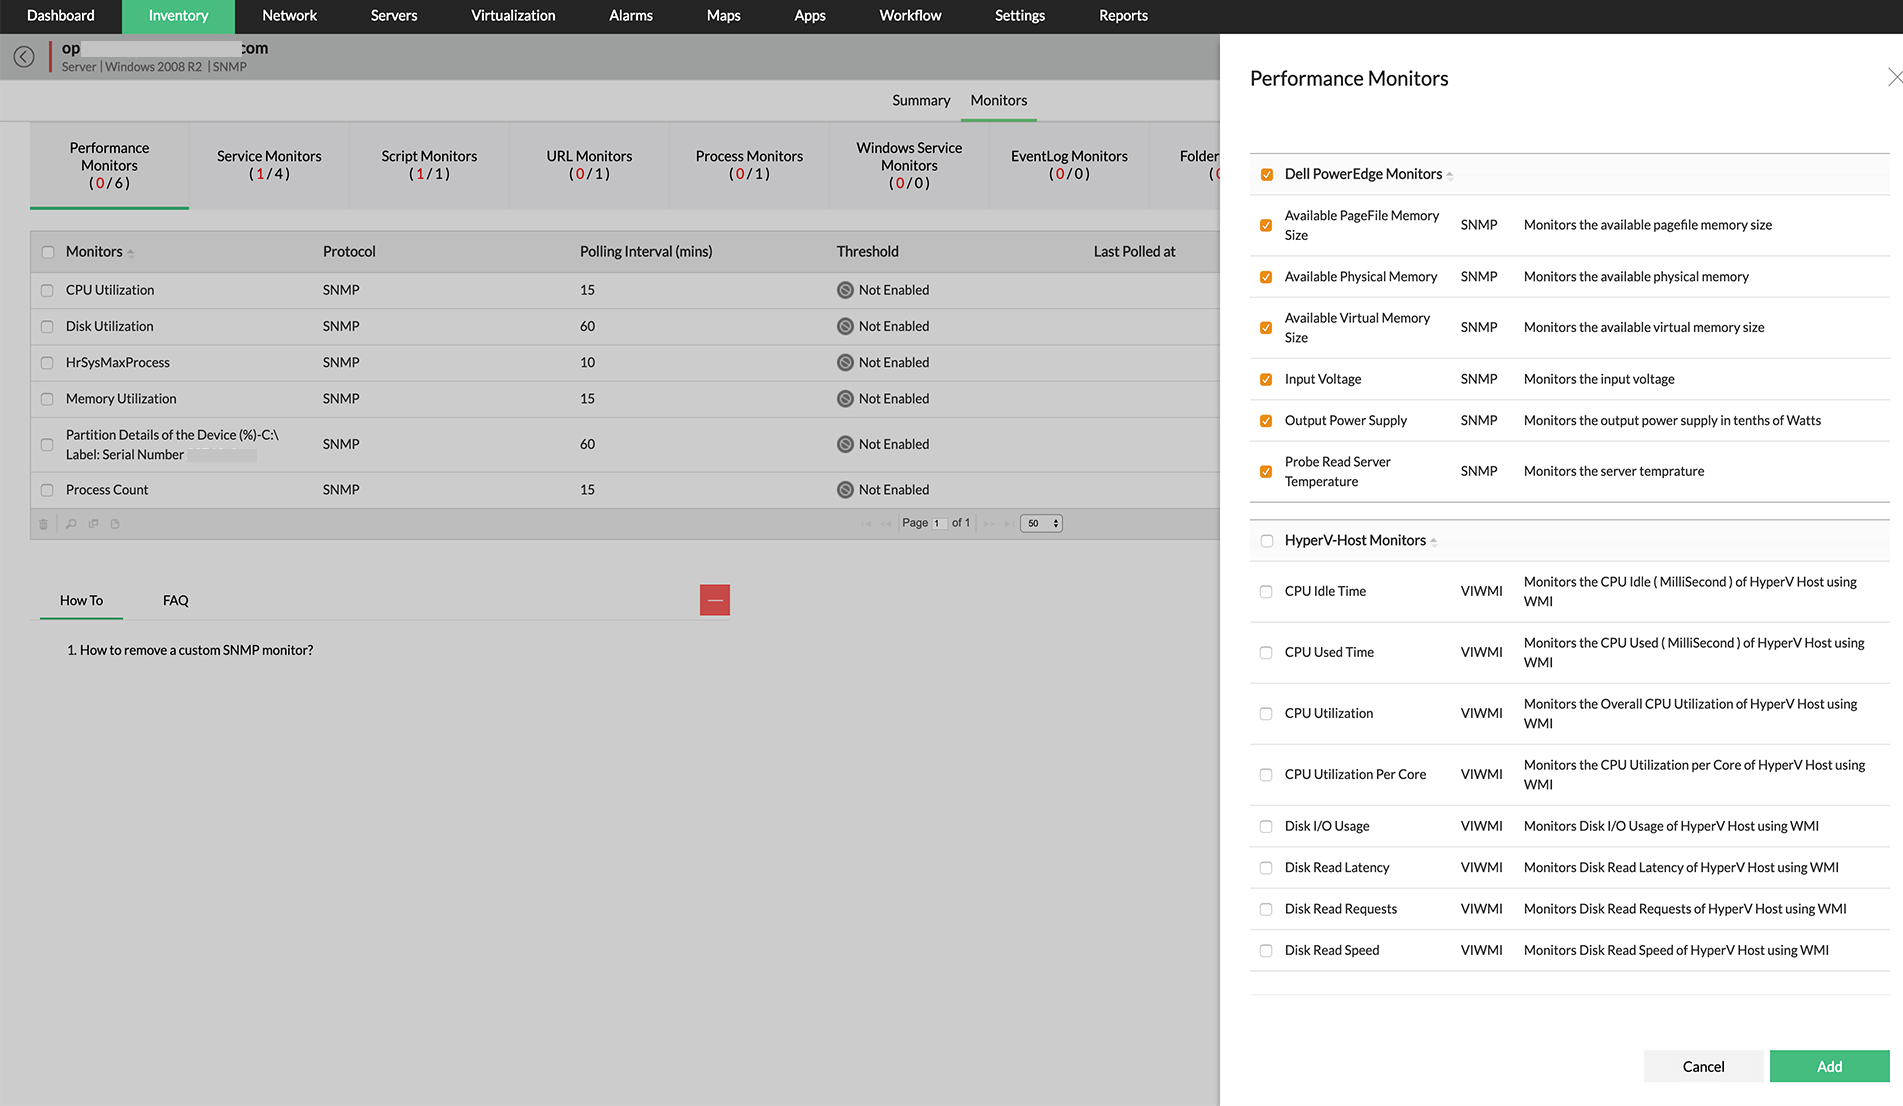
**Vendor specific performance monitors** to monitor disk space/usage and other **disk performance metrics** indepth.
**Monitor all the following metrics and more:**
| [CPU Monitoring](https://www.manageengine.com/network-monitoring/cpu-monitoring.html) | [Memory Monitoring](https://www.manageengine.com/network-monitoring/memory-monitoring.html) | Disk Monitoring |
|---|---|---|
| CPU utilization
CPU socket
CPU speed
[CPU temperature monitor](https://www.manageengine.com/network-monitoring/cpu-temperature-monitoring.html?CPUmemdisk)
Idle Time
Privileged time
Processor Time
User time
Processor Queue
Drive Size
PSU Redundancy | Free Physical Memory
Page Faults
Page Reads
Page Writes
Pages Per Second
Available Page-File Memory Size
Available Physical Memory
Available Virtual Memory | Disk utilization
Disk Reads
Disk writes
Disk out-of-space Count
Disk Partitions-wise monitors
Disk Queue Length
Free Disk Space in GB
Free Disk Space ion MB
Used Disk Space in GB
Used Disk Space in MB |
### CPU Metrics
- CPU utilization
- CPU socket
- CPU speed
- Idle Time
- Privileged time
- Processor Time
- User time
- Processor Queue
- Drive Size
- PSU Redundancy
### Memory Metrics
- Free Physical Memory
- Page Faults
- Page Reads
- Page Writes
- Pages Per Second
- Available Page-File Memory Size
- Available Physical Memory
- Available Virtual Memory
### Disk Metrics
- Disk utilization
- Disk Reads
- Disk writes
- Disk out-of-space Count
- Disk Partitions-wise monitors
- Disk Queue Length
- Free Disk Space in GB
- Free Disk Space ion MB
- Used Disk Space in GB
- Used Disk Space in MB
## Stay ahead of the problem with threshold based alerts for each resource monitor
- Specify thresholds and be notified when the processor time hits the limit, or when the disk space is being used up more than acceptable levels!
- Configure an increasing or decreasing threshold like in the case of available free memory or available disk space.
- Add more intelligence to threshold configuration by specifying the number of violations allowed before actually triggering an alert. Effect bulk threshold configuration too!
- Avert false alerts by specifying a re-arm value to clear an alert!
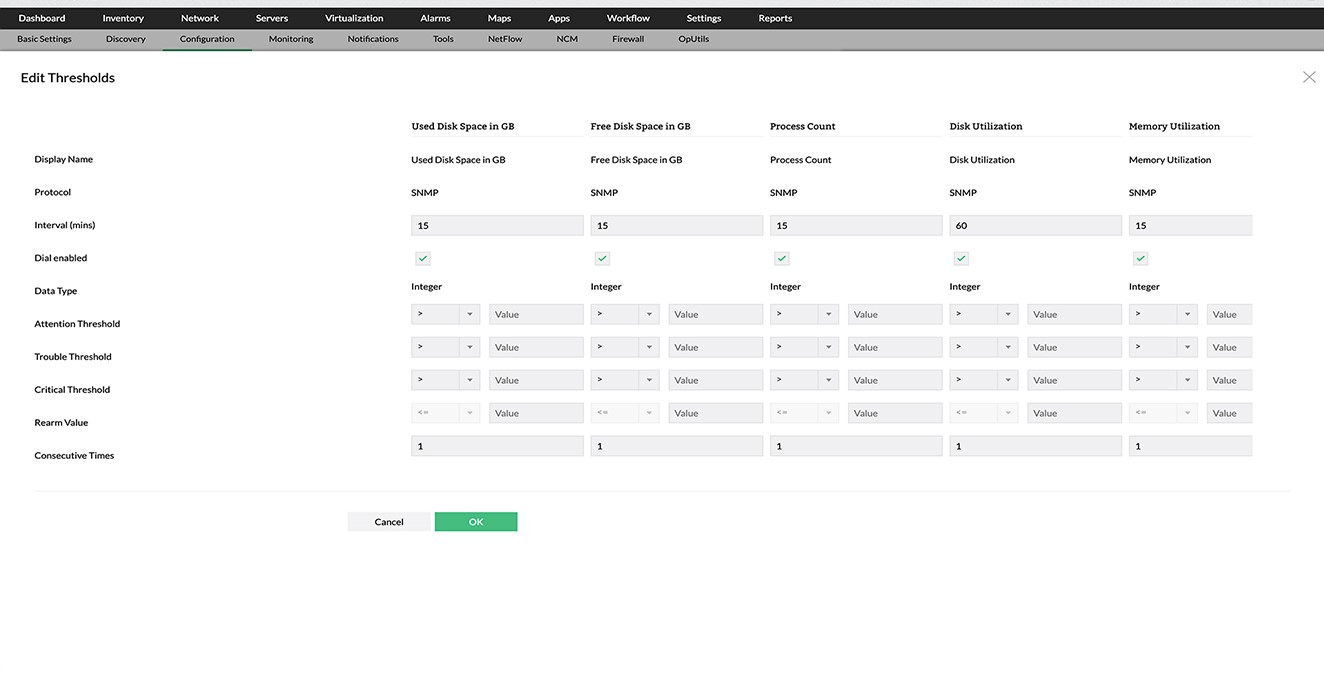
**Edit thresholds for all the server performance monitors** from a single screen.
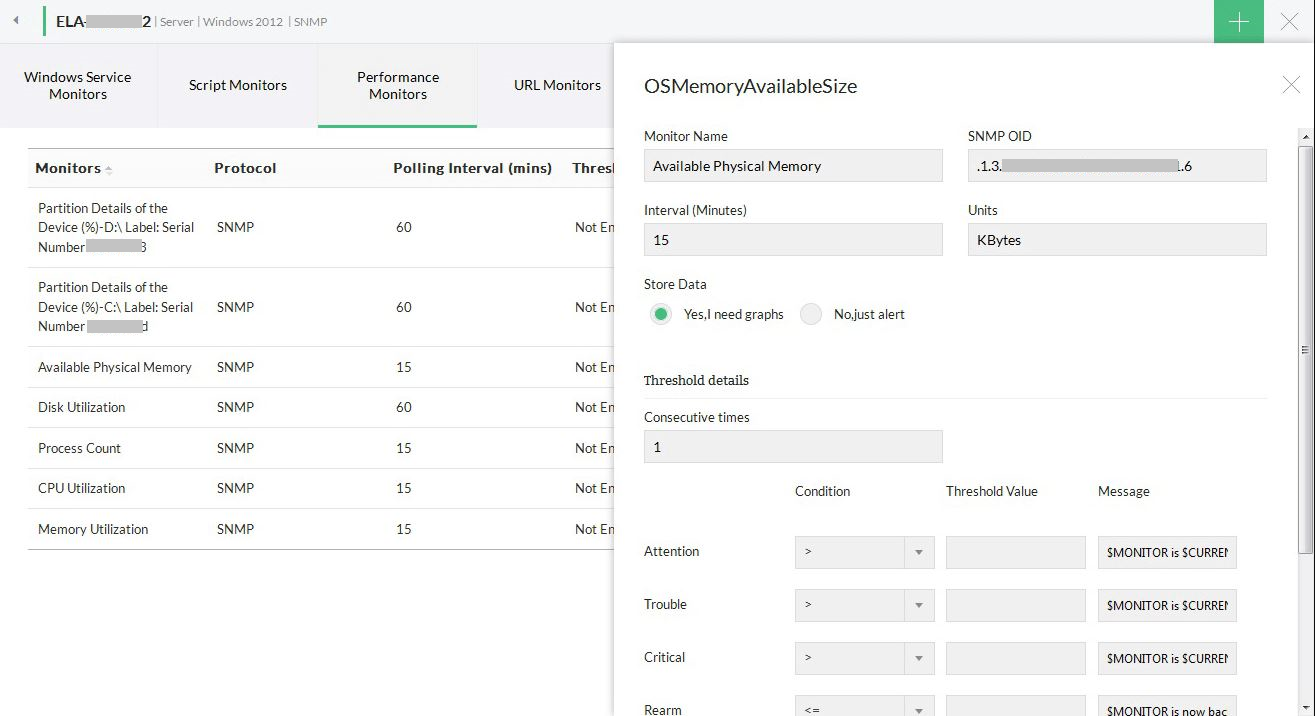
Editing the Available physical memory monitor, options to test the monitor, **configure thresholds** & other **advanced performance management** features.
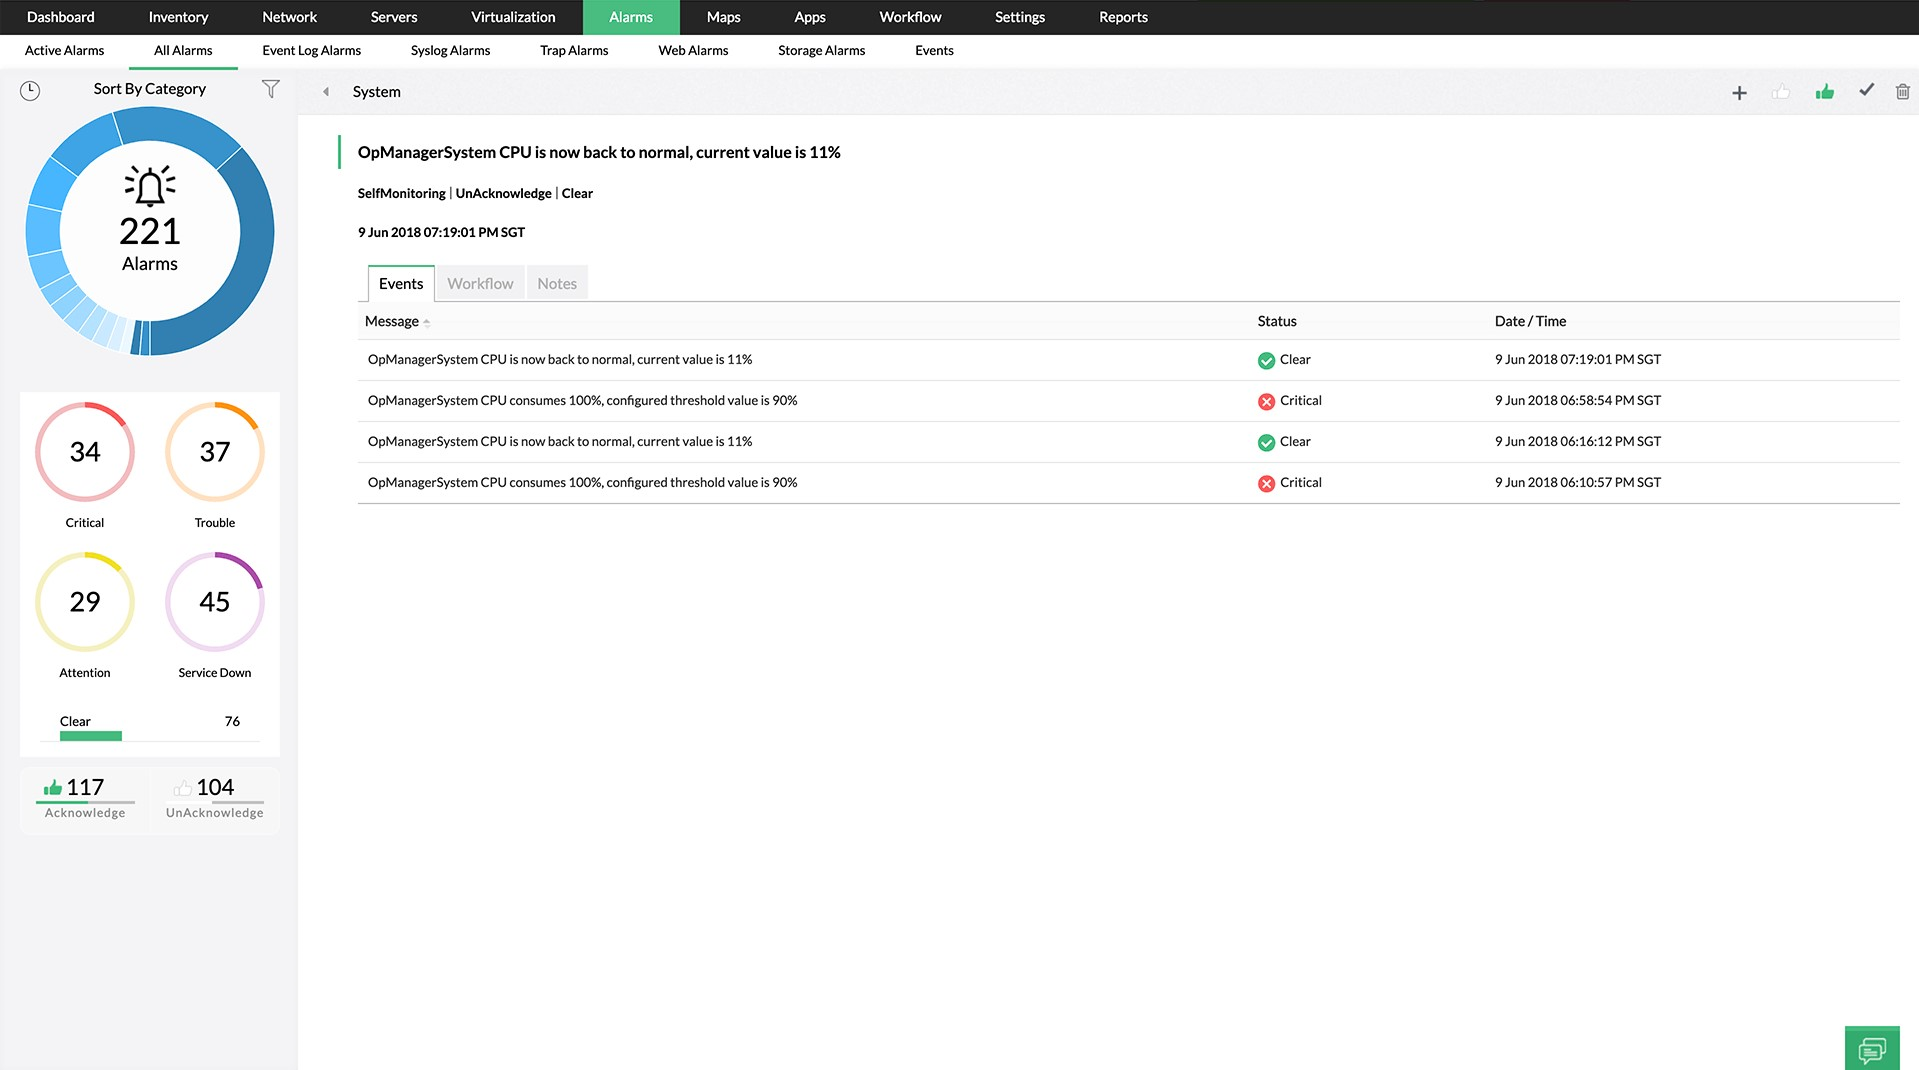
A memory **threshold violated alarm, fault actions and event history** details.
## Troubleshoot and resolve resource faults quickly using diagnostic tools
- Troubleshoot instantly using process diagnostics to check the process-wise resource utilization and terminate an offending process if required.
- Quickly assess the performance by looking at the real-time utilization reports and decide on the course of action.
- Take a quick look at the [process monitors](https://www.manageengine.com/network-monitoring/process-monitoring.html) on a server to check the CPU and memory used up by a process at one go.
- Configure system log monitoring rules and be notified of system events (Windows Event logs or Syslogs) for any of these resource failures. For instance, a system event for a RAID failure.
With **real-time process monitoring,** our CPU monitor and detailed memory monitoring will let you know how much CPU and memory is occupied by each critical process.
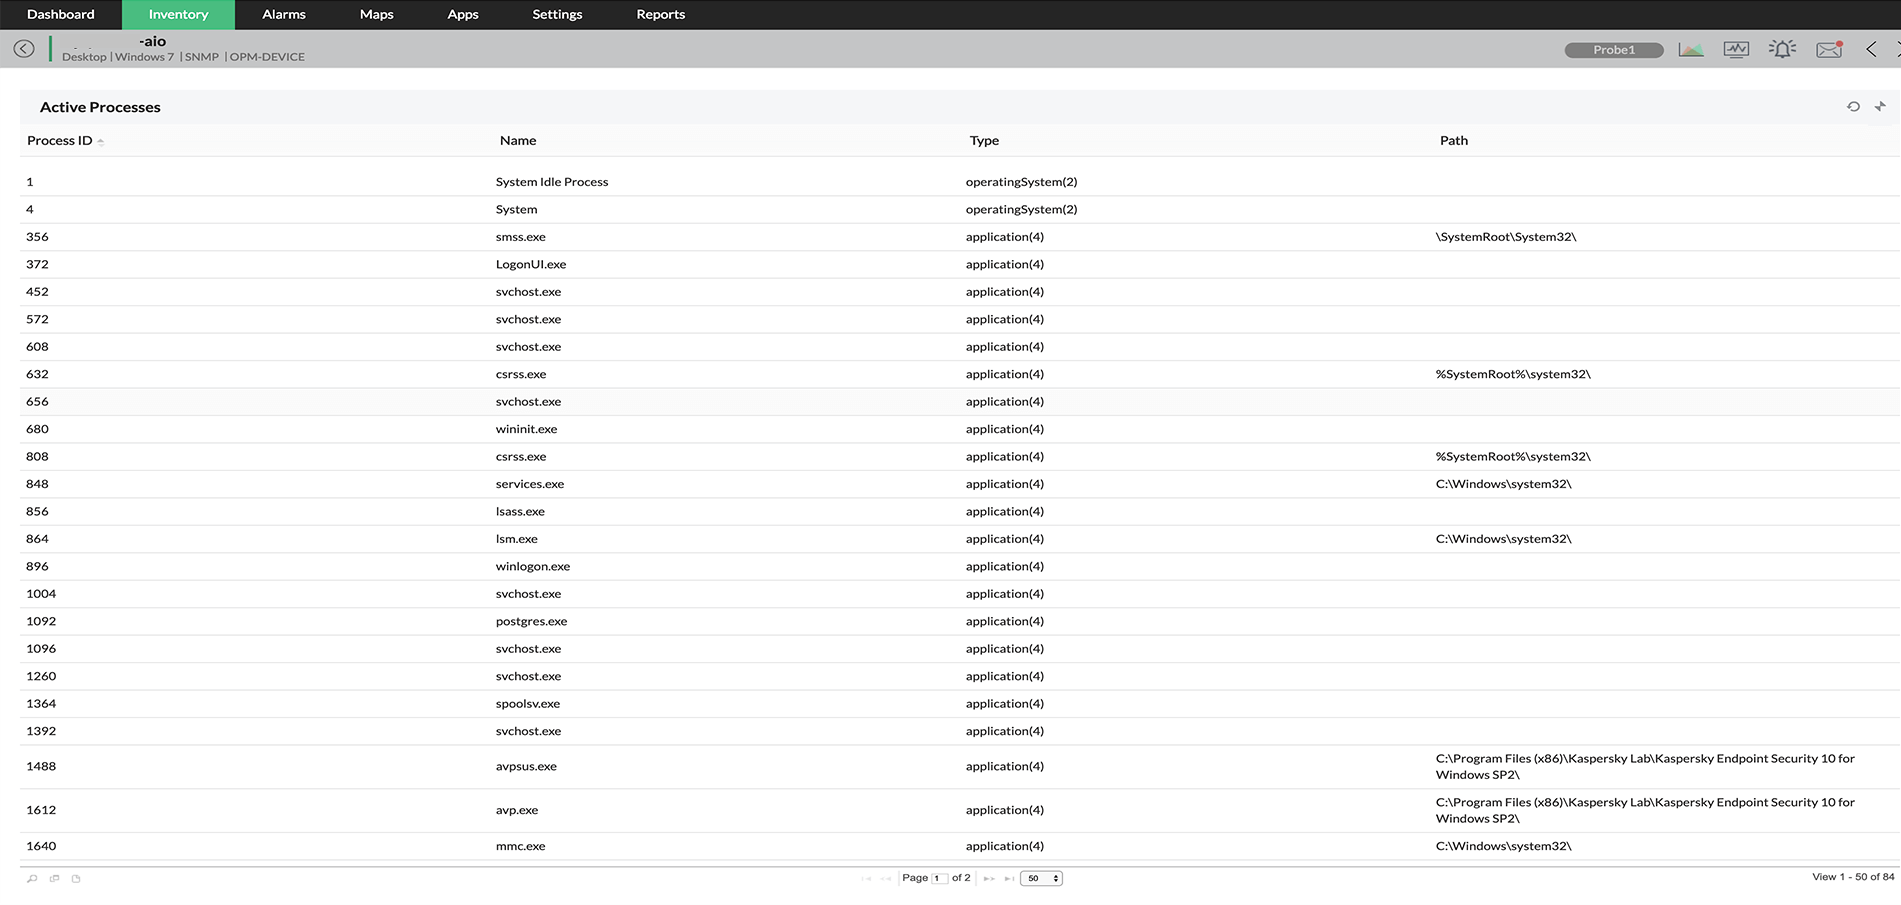
A handy tool to **know the top 10 processes occupying CPU or Memory**, with options to **terminate a process remotely**.
Adding a new **Windows Event log rule** for RAID events in a server.
## Analyze CPU, Disk, Memory performance using the granular reports and act on the findings
- Drill down the reports from the dial graphs to see the detailed performance statistics for the required time window.
- Watch the 95th percentile reading on the reports and adjust the thresholds based on trend.
- Quickly pull out the performance reports for last 30 days or last 7 days and assess the need for a resource upgrade or analyze the trend.
- Assess the health of CPU, memory, disk utilization, and Process Count at the device level using the 'At-a-glance' report.
- At any given time, see the CPU, demory, and disk performance problems on top N servers using the Server Health report.
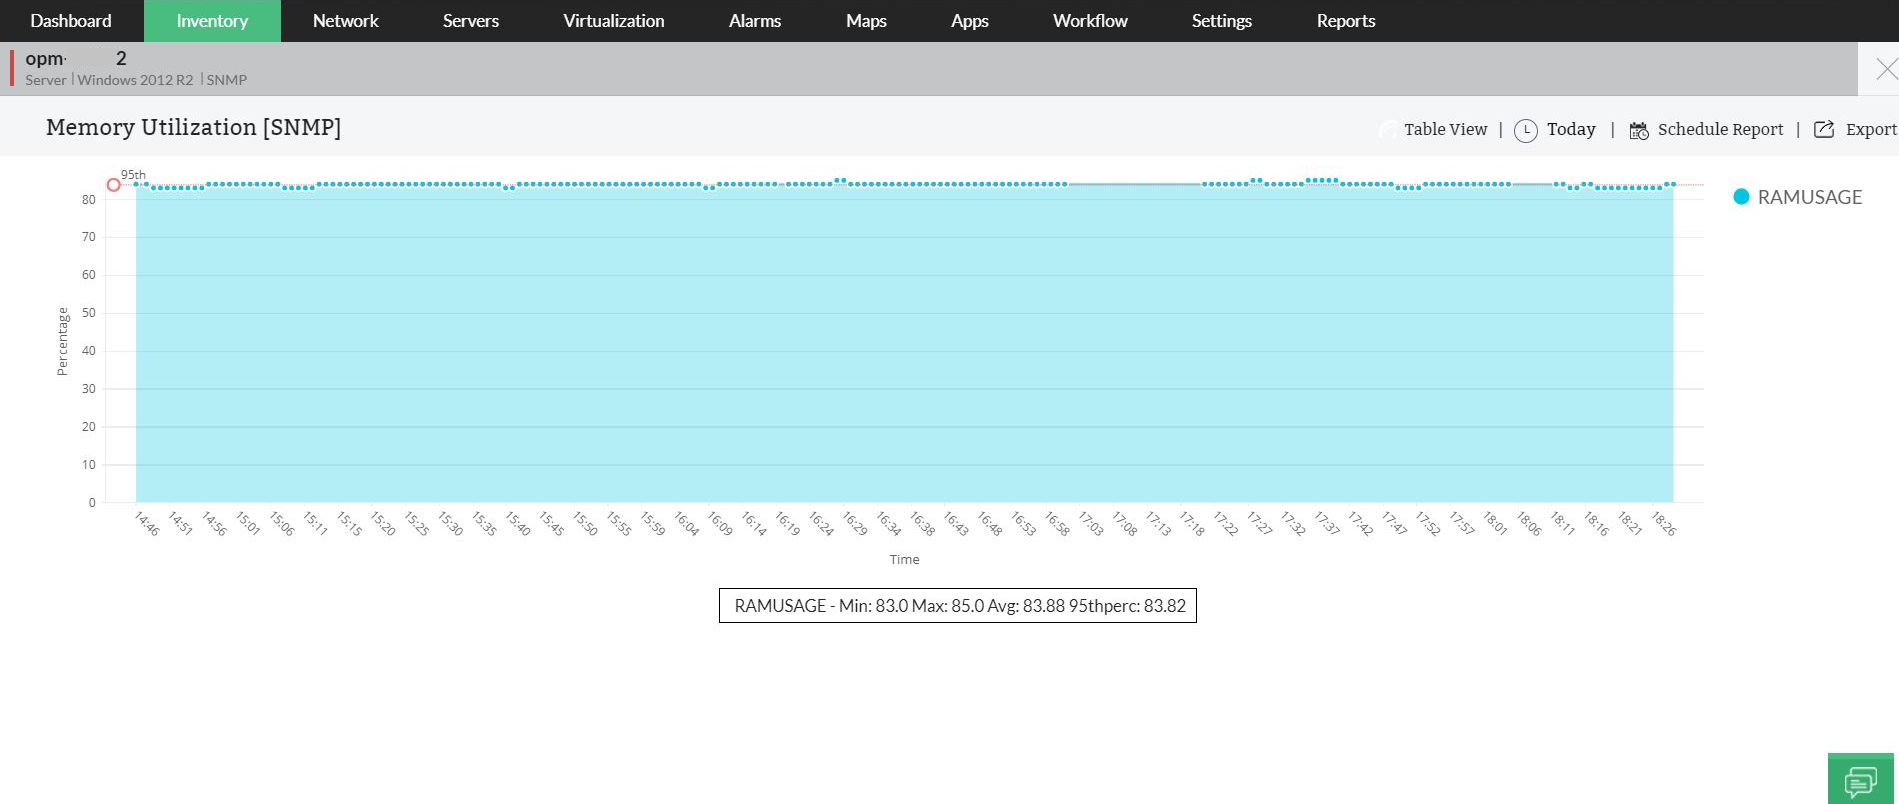
A graphical **report on memory utilization** and performance with **95th percentile, minimum, maximum and average performance stats**.
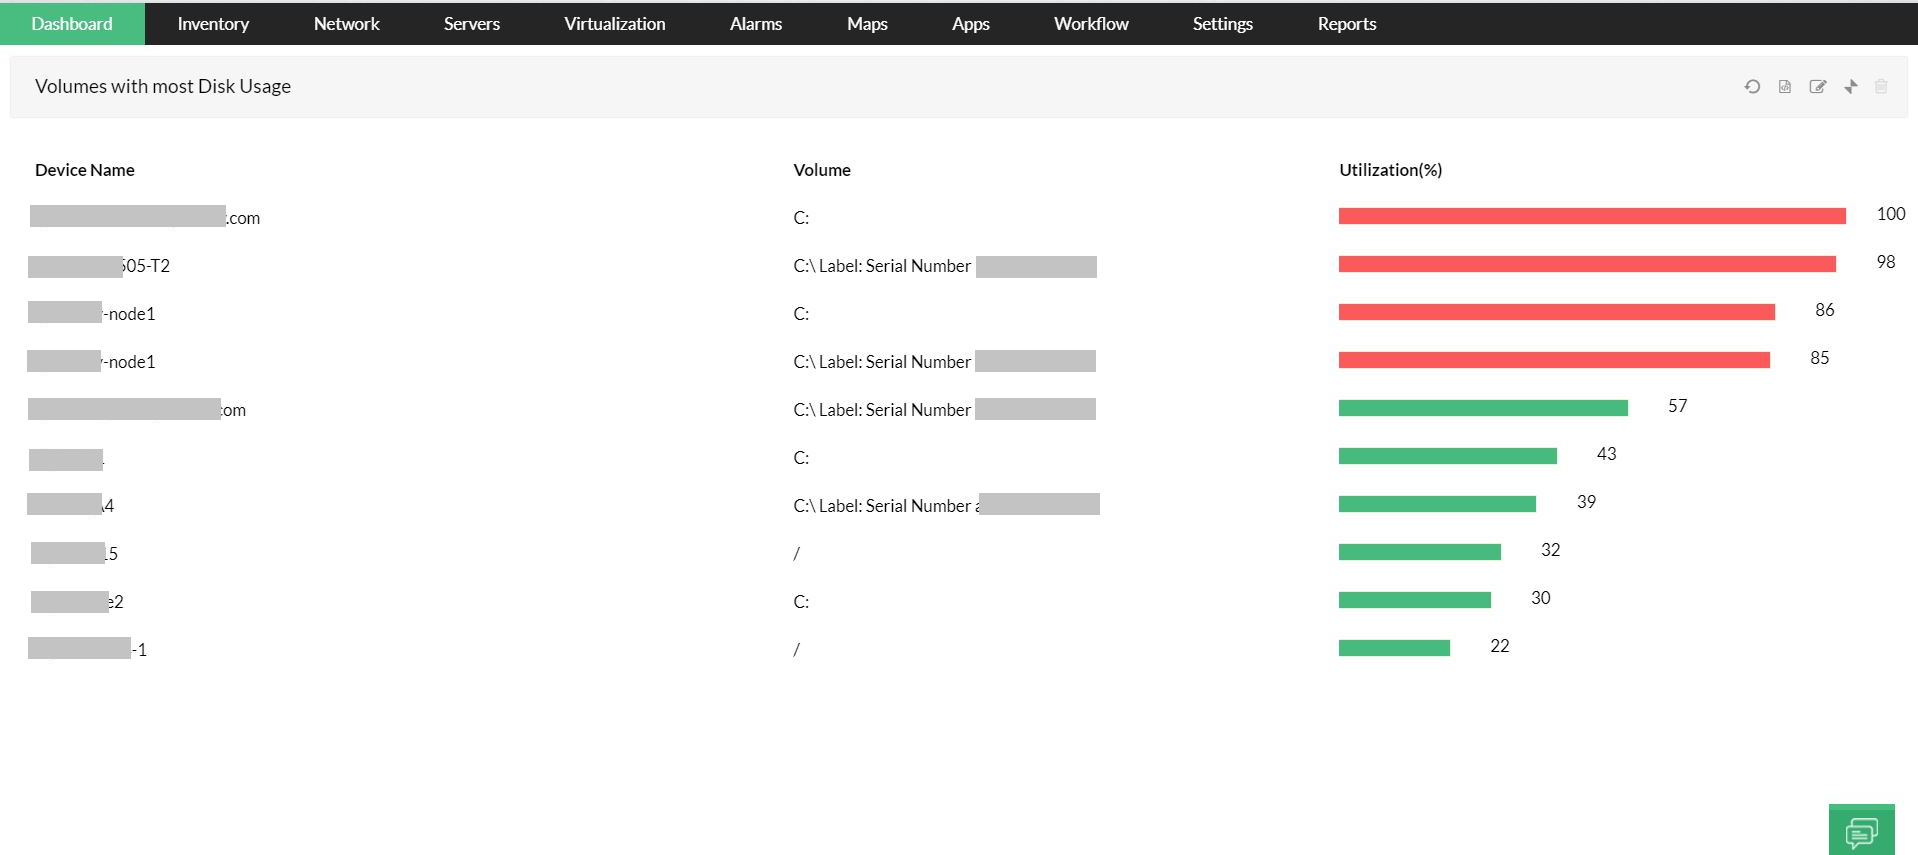
**Report on volumes with high disk utilization**, options to edit the report setting, **Export the reports** to different formats (PDF, XLS), **Email or print**.
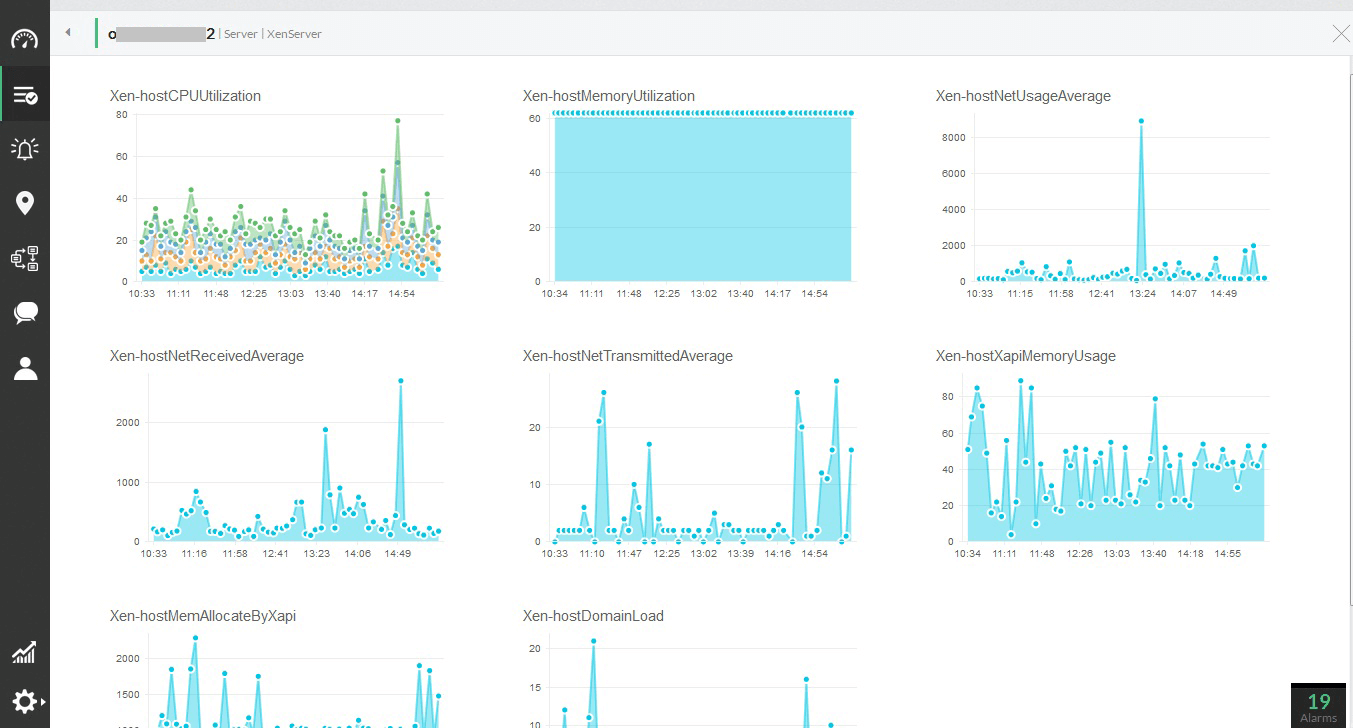
A single report to know the **performance of a particular server,** includes **server traffic information** as well.
## Help and Support:
- Learn how to [Monitor CPU, Memory and Disk Using SNMP](https://www.manageengine.com/network-monitoring/help/host-resource-monitoring.html).
- Add [Custom Monitors](https://www.manageengine.com/network-monitoring/help/adding-custom-monitors.html) to suit your requirement and needs.
## Need Features? Tell Us
If you want to see additional server [CPU monitoring](https://www.manageengine.com/network-monitoring/cpu-monitoring.html), memory and disk monitoring features implemented in OpManager, we would love to hear. [Click here to continue](https://www.manageengine.com/network-monitoring/roadmap.html).