Adaptive Thresholds in OpManager

Adaptive thresholds enable users to optimize the efficiency of alerts by dynamically modifying threshold values for critical monitors using OpManager's Machine Learning-based predictive algorithms. It eliminates the need for manual intervention by analyzing data patterns and adjusting thresholds to minimize false alerts while ensuring that critical issues are detected.
Over time, it learns to recognize hourly, daily, weekly, and even monthly cycles and automatically adapts thresholds to match these recurring patterns. This ensures that predictable fluctuations, such as daily traffic spikes, weekly maintenance activities, or month-end processing loads, do not generate unnecessary alerts while still highlighting genuine anomalies.
How OpManager's Adaptive Thresholds work?
Once Adaptive Thresholds is enabled, OpManager collects the necessary performance data from all the monitors and feeds them into its advanced predictive algorithms. This data is collected over a minimum period of 14 days.
- The algorithms analyze the recorded data and generate relevant threshold values, with every value and pattern taken into consideration.
- Once OpManager has at least 14 days of data for the selected monitor(s), it finalizes the data pattern and starts applying forecast threshold values to those monitor(s).
- When enabling Adaptive Thresholds, OpManager collects what are called "deviation values" from the user. These determine how much the polled value can vary before an alert should be raised.
- There are three deviation values, one for each severity level: Attention, Trouble, and Critical. These values can be configured in either percentages or fixed values, and in either increasing or decreasing order.
Dynamic Adaptation
Traditionally, OpManager uses the last 14 days of data to start generating alerts. This might cause a minor delay with raising alerts when the Adaptive Threshold feature is enabled for the first time. But as OpManager is used over a longer period it gathers enough historical data to detect and adapt to recurring weekly and monthly patterns. This enables OpManager to automatically adjust thresholds for activities that occur on a regular schedule, such as weekly maintenance windows or end-of-month transaction spikes.
- OpManager adapts thresholds dynamically for hourly and daily variations, such as higher CPU usage during peak business hours or reduced activity during non-business hours.
- If recurring activities occur weekly, such as scheduled maintenance every Friday night or increased CPU utilization on Monday afternoons, OpManager adapts the threshold accordingly for that specific time window.
- With longer data collection, OpManager detects monthly operational spikes and adjusts thresholds automatically.
Example: For enterprises, network usage often varies throughout the week, with lower activity during weekends and higher loads on Monday mornings. Initially, these fluctuations might trigger false alerts as anomalies. After observing this historic data, OpManager automatically adapts and adjusts the thresholds to match these predictable changes.
How are thresholds calculated in Adaptive Threshold mode?
For each hour, OpManager's predictive algorithms provide Forecast value based on previously observed data patterns and behavior, and the deviation values configured by the user are applied based on that value. For example, consider the following deviation values.
Kindly note that the deviation can either be described in terms of values or in terms of percentage. Let us consider this with an example.
| Attention | Trouble | Critical |
|---|---|---|
| 5 | 8 | 15 |
We can configure the deviation value either by values or percentages, as described below.
1. Deviation in terms of value: If the forecast value for the CPU utilization of a device is 34 for the first hour of the day (0:00 - 1.00), then the corresponding value for raising an alert with severity "Attention" would be 34+5=39 (Forecast + Attention deviation). Similarly, Trouble and Critical values are also calculated every hour. The calculated values for 5 consecutive hours for different forecast values would be as follows:
| Hour of time | Forecast value | Attention value | Trouble value | Critical value |
|---|---|---|---|---|
| 0:00 - 1:00 | 34 | 39 | 42 | 49 |
| 1:00 - 2:00 | 36 | 41 | 44 | 51 |
| 2:00 - 3:00 | 44 | 49 | 52 | 59 |
| 3:00 - 4:00 | 58 | 63 | 66 | 73 |
| 4:00 - 5:00 | 54 | 59 | 62 | 69 |
2. Deviation in terms of percentage: If the forecast value for the CPU utilization of a device is 34 for the first hour of the day (0:00 - 1.00), then the corresponding value for raising an alert with severity "Attention" would be 34+(5% of 34)=36 (Forecast value + Attention deviation percentage of forecast value). Similarly, Trouble and Critical values are also calculated every hour. The calculated values for 5 consecutive hours for different forecast values would be as follows:
| Hour of time | Forecast value | Attention value | Trouble value | Critical value |
|---|---|---|---|---|
| 0:00 - 1:00 | 34 | 36 | 37 | 39 |
| 1:00 - 2:00 | 36 | 38 | 39 | 41 |
| 2:00 - 3:00 | 44 | 46 | 48 | 51 |
| 3:00 - 4:00 | 58 | 61 | 63 | 67 |
| 4:00 - 5:00 | 54 | 57 | 58 | 62 |
3. Advanced Configuration: In addition to deviation values, OpManager offers the following options to tailor alert behavior.
Suppress limits: Configure a value below which alerts will be automatically suppressed, preventing unnecessary alarms for minor deviations.
Example: If the configured adaptive threshold for CPU utilization is set to 50, and you configure a suppress limit of 52, any actual value below 52 will not trigger an alert.
Static limits: Define a fixed upper thresholds that, when crossed, will always trigger an alert regardless of the configured adaptive threshold values.
Example: If you set a static upper limit of 90 for CPU utilization, an alert will be triggered immediately when the usage reaches or exceeds 90, even if the adaptive threshold value is higher.
To configure:
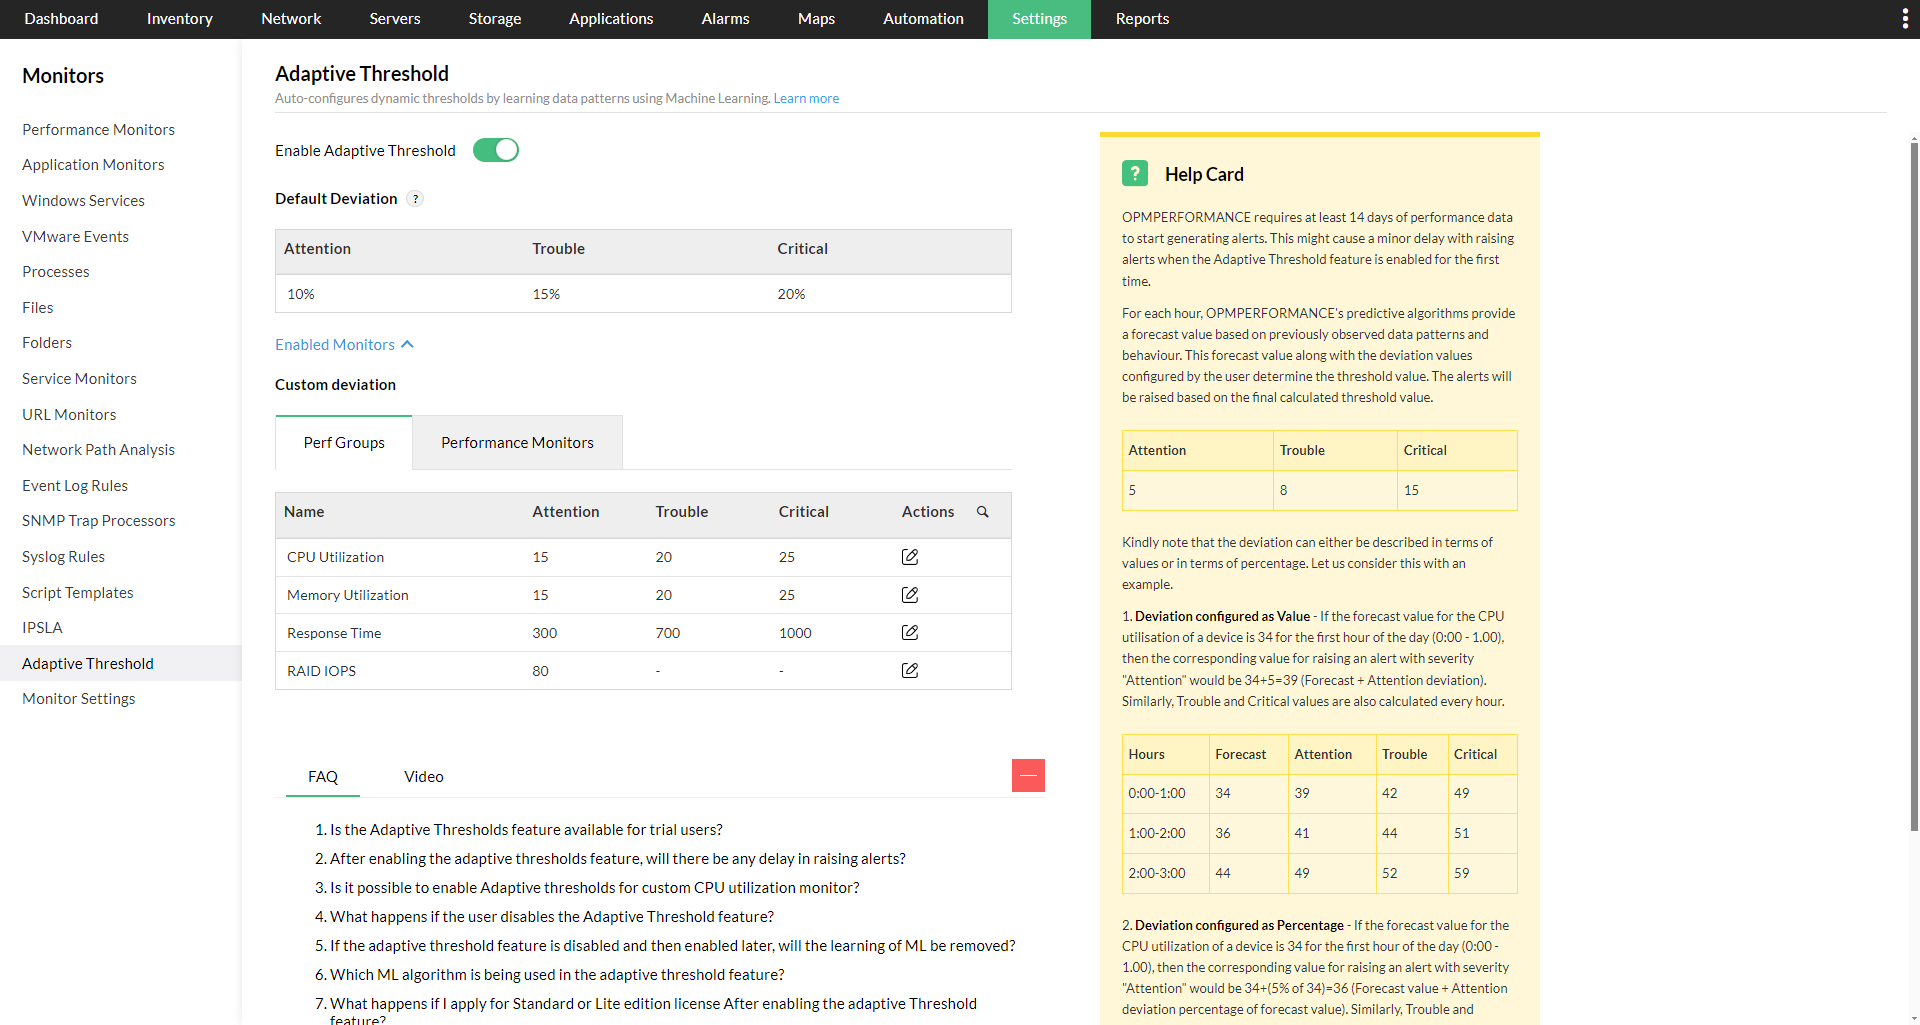
- Navigate to Settings > Monitoring > Adaptive Threshold.
- Select the Enabled Monitors option.
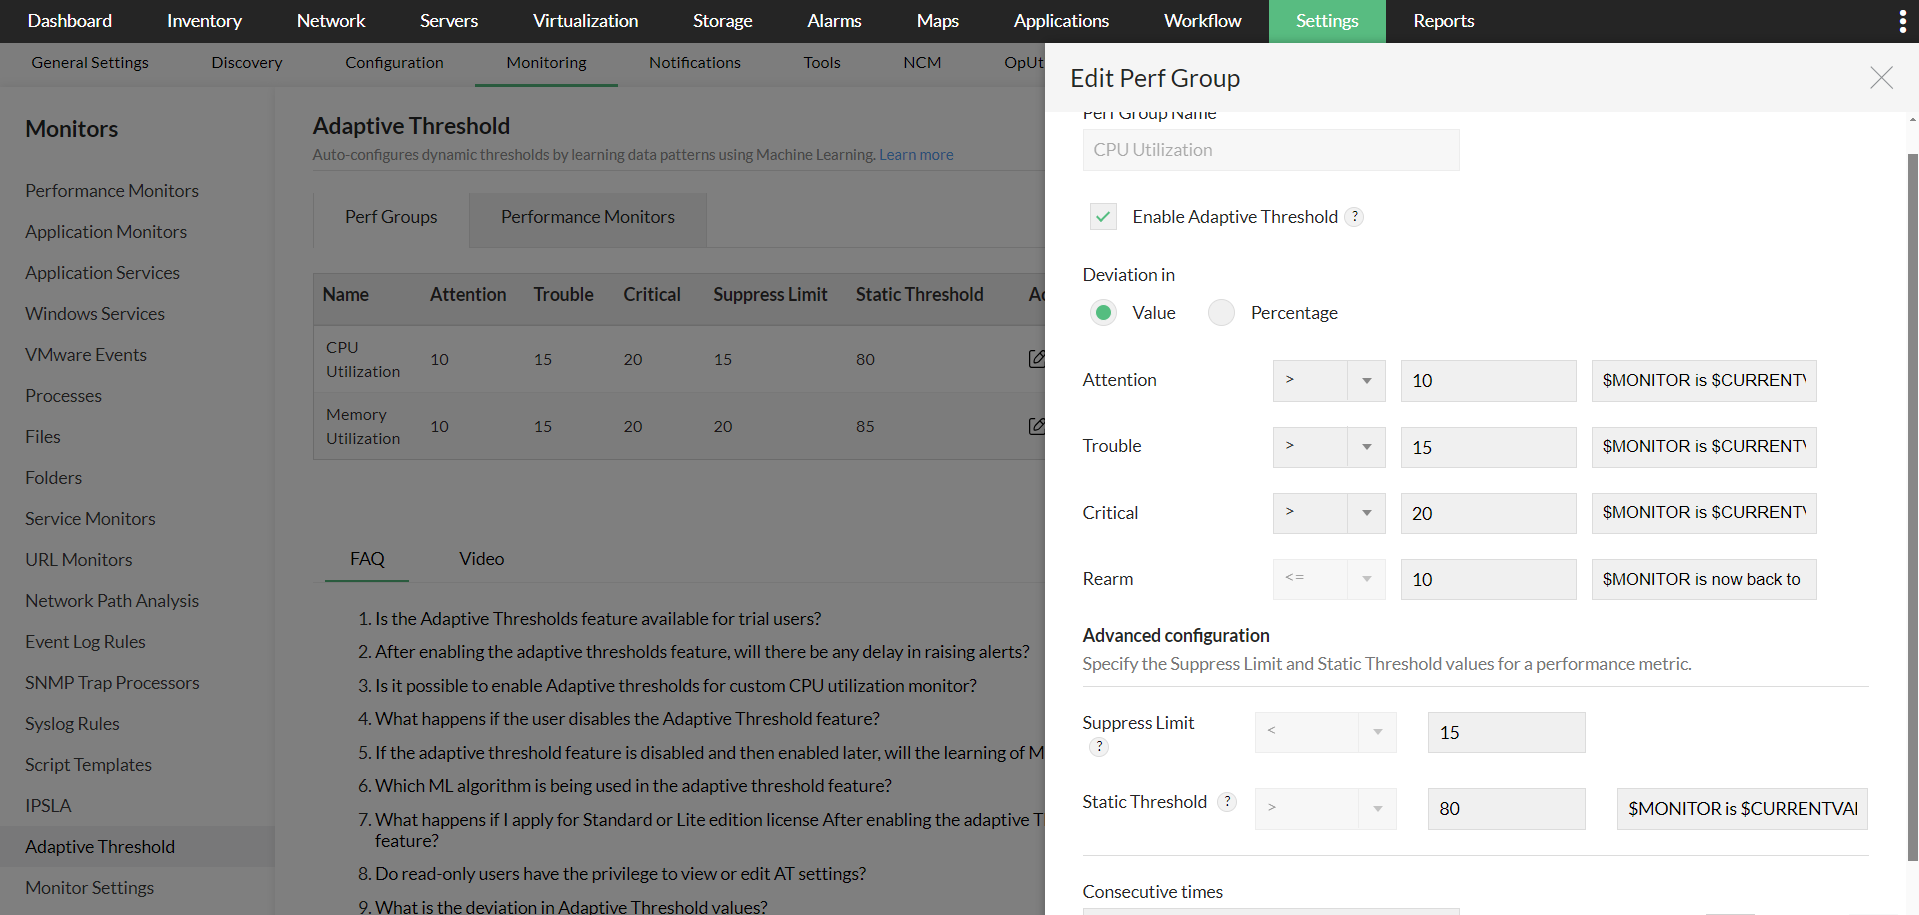
- Click the Edit icon located under the Action column corresponding to the desired monitor or performance group.
- Set the required Suppress Limits, Static Limits, and Deviation Values.
Enabling Adaptive Thresholds
Before enabling the Adaptive Thresholds option, note that:
- This feature is currently available for all performance monitors in OpManager.
- OpManager will require a minimum of fourteen days of performance data to successfully establish data patterns and implement a model. If you are adding a new device and want to start monitoring it right away, you can use the manual thresholds during this period.
- Adaptive Thresholds feature has to be first enabled globally for it to be enabled as an option in all the other pages. If it is disabled globally, only manual thresholds can be configured throughout OpManager.
- Also, if adaptive thresholds are enabled from a device template, all the devices that are subsequently discovered with respect to that device template, will have adaptive thresholds enabled for the monitors by deafult.
Adaptive thresholds can be enabled globally across OpManager from Settings -> Monitoring -> Adaptive Threshold. Navigate to this page and enable the "Enable Adaptive Threshold" option. You can also enable adaptive thresholds on an individual level from the respective performance monitor, perf group, or device template, and define the deviation levels in either value or percentage.
Once it has been enabled, it can be controlled on various levels based on your requirements:
- Enabling on a monitor or perf group level across OpManager:
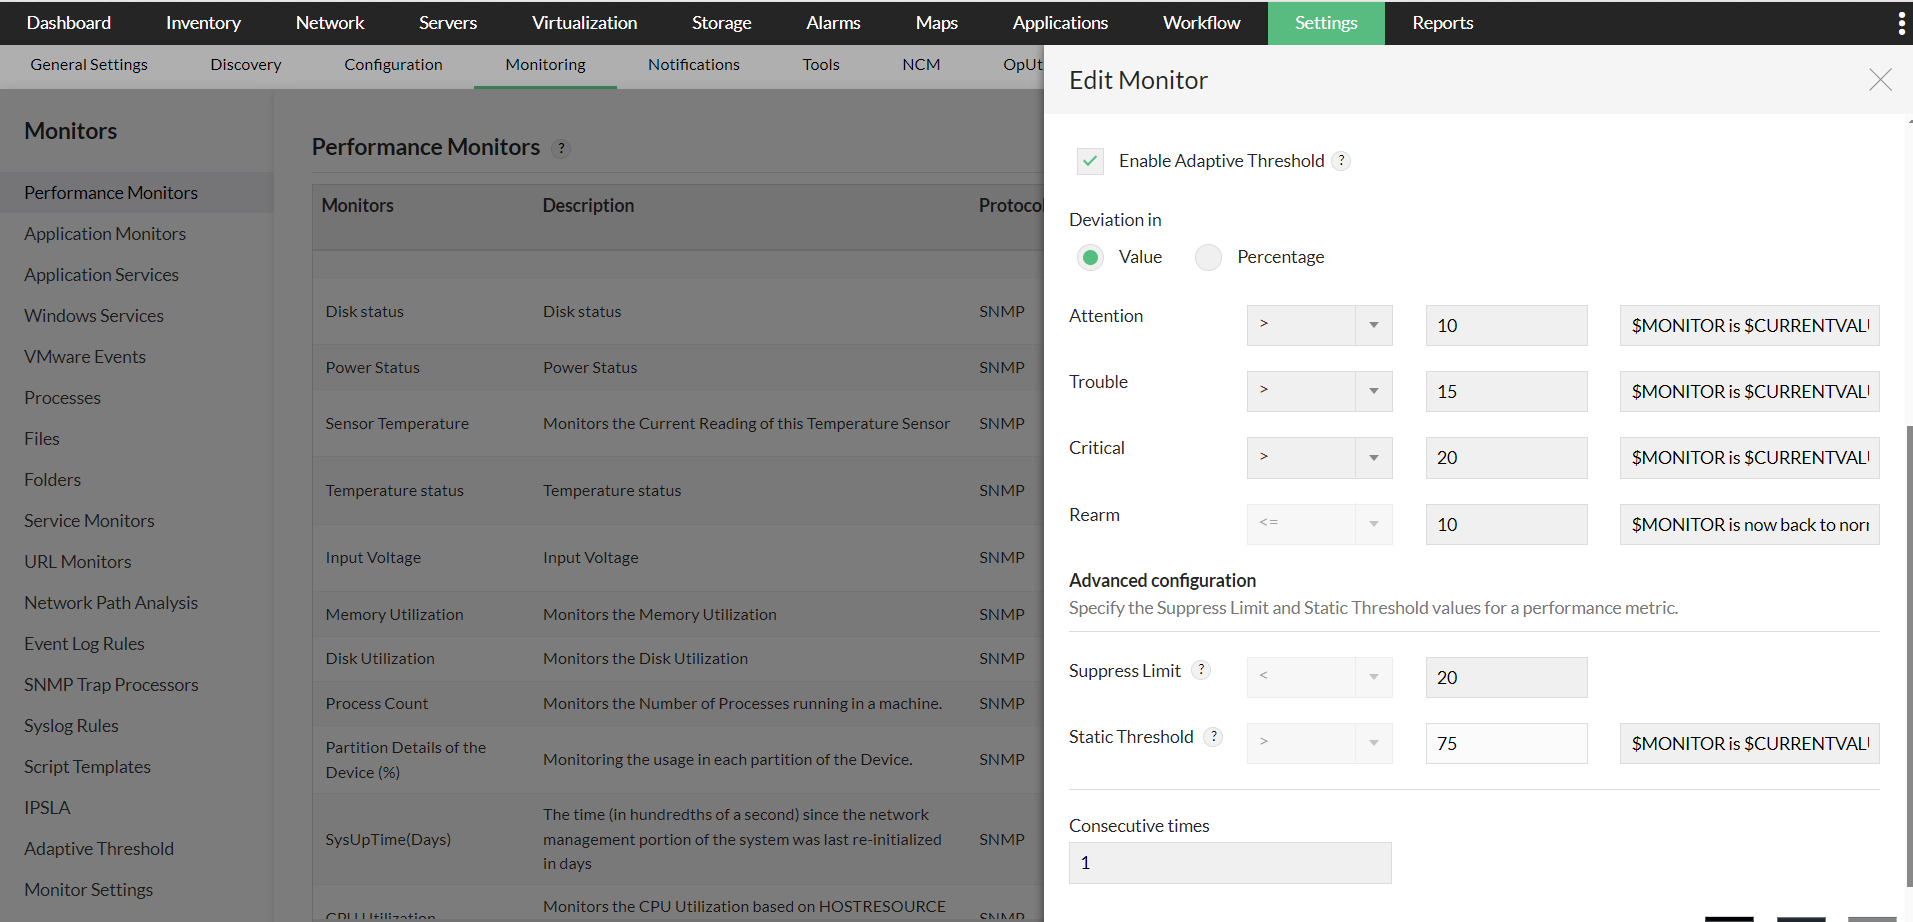
- You can also enable Adaptive Thresholds for a particular monitor used across OpManager. Simply go to the Performance Monitors page under Settings > Monitoring, locate the monitor you wish to enable it for, and click Edit.
- Enable the Adaptive Thresholds option, configure the deviation values and then click OK to save it.
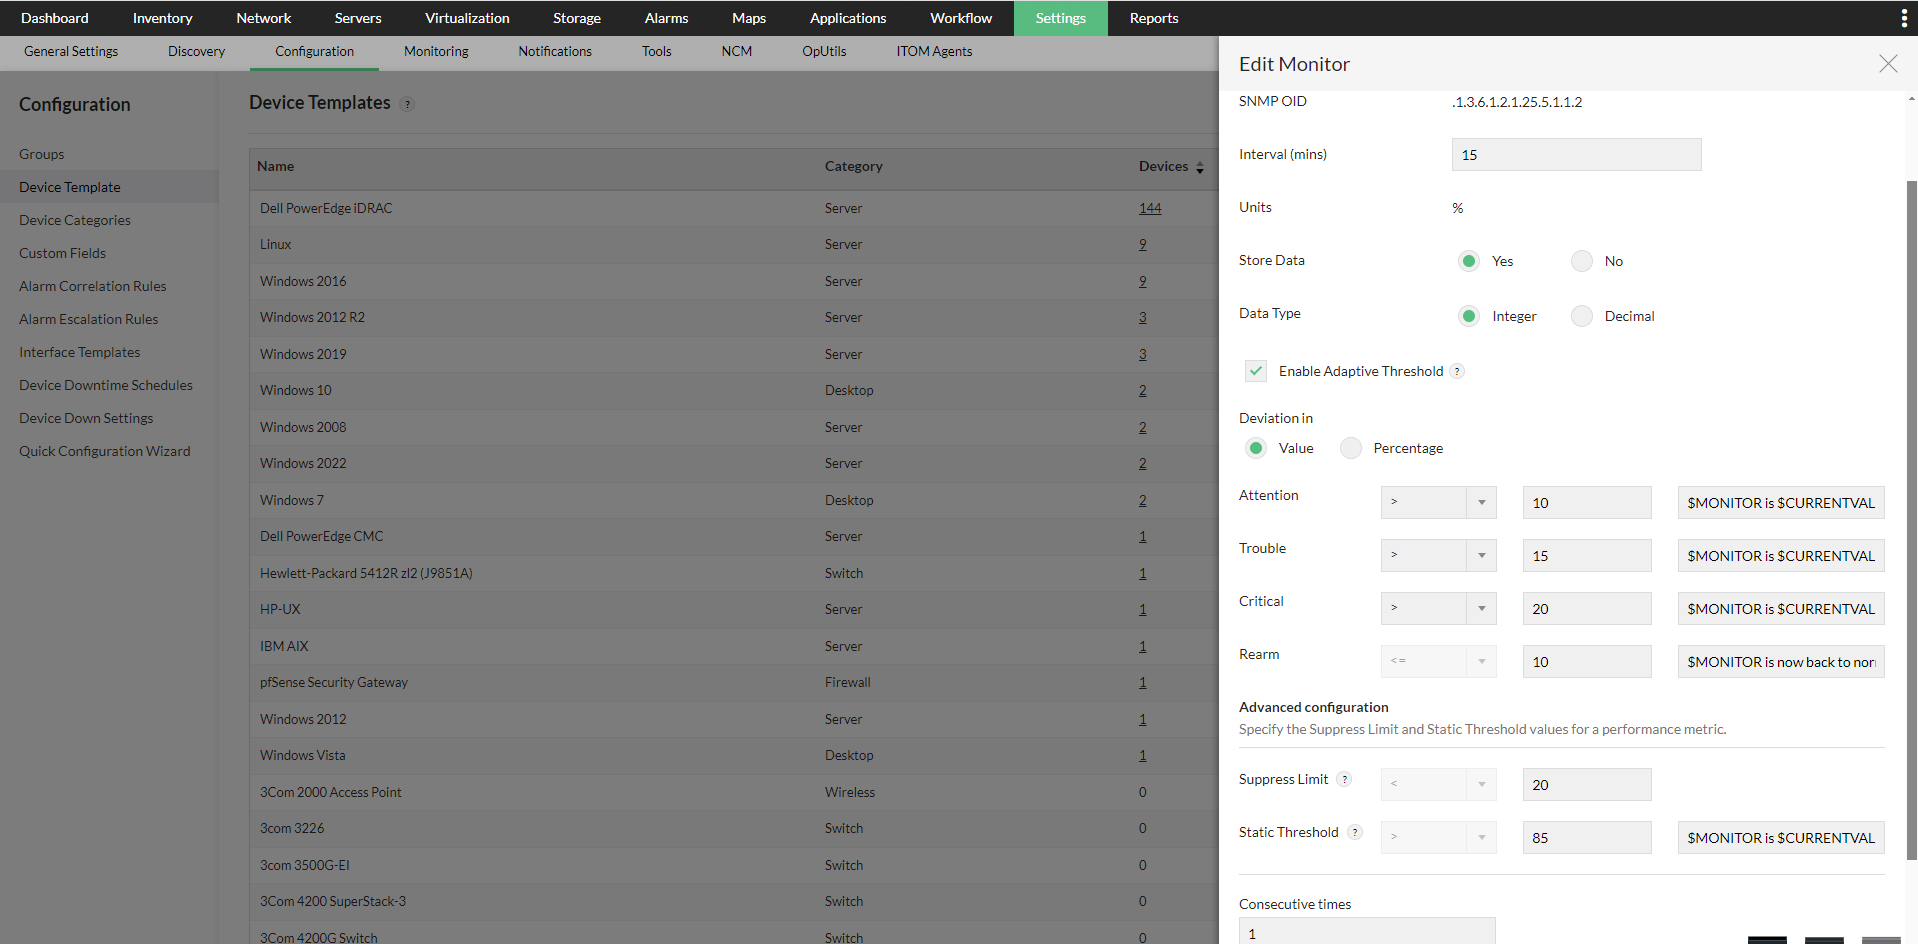
- We can also enable Adaptive Threshold for monitors from Device Templates, in a similar process to configuring on a monitor level as above.
- Go to Settings -> Configuration -> Device Templates, select the suitable template and then you can click on any of the supported monitors to enable Adaptive Thresholds. Configure the deviation values, and once done, click OK to save your changes.
- To directly apply this change to devices under the template, click Save and Associate. You can select the devices you want to apply these changes to and click on Associate and Overwrite to apply these changes.
- If you want to apply this threshold change to devices that will only be discovered in the future, just click 'Save'.
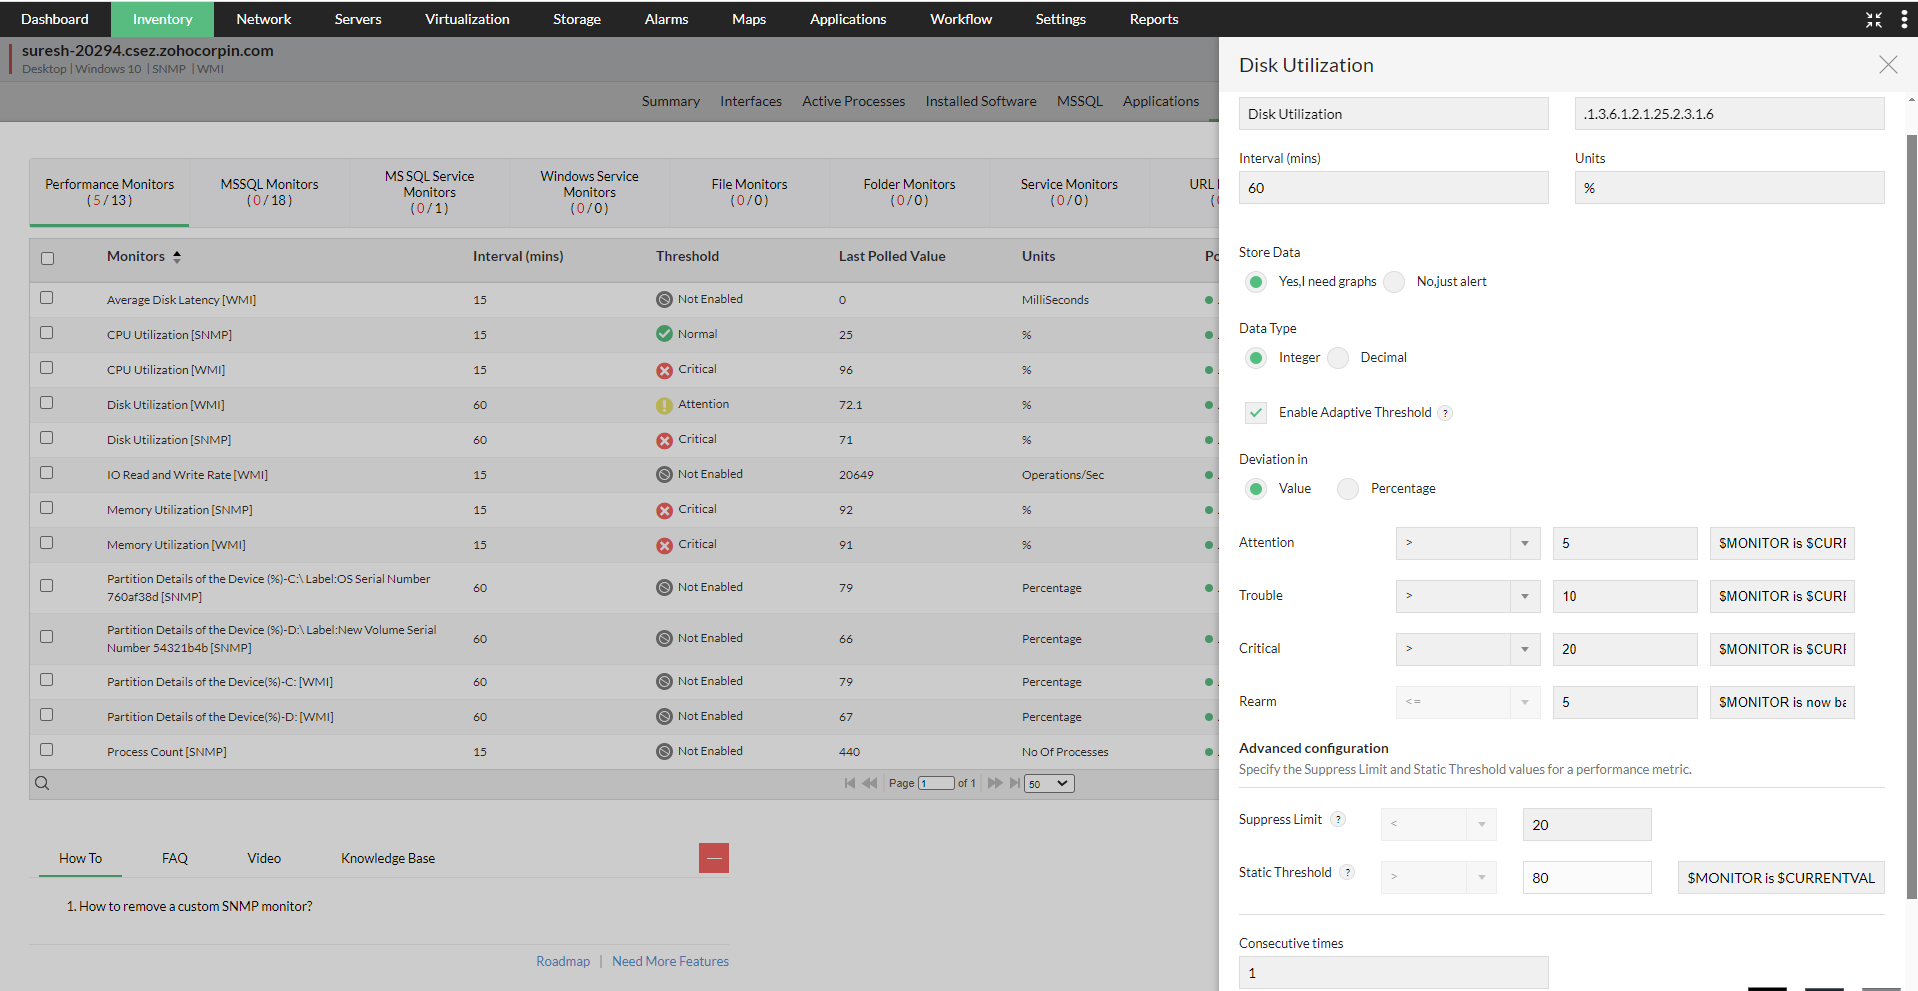
- This method will be useful when Adaptive Thresholds need to be enabled/disabled only for a few devices.
- Simply go to the Device Snapshot page of the device(s), navigate to any of the supported monitors, click Edit and enable the Adaptive Thresholds option.
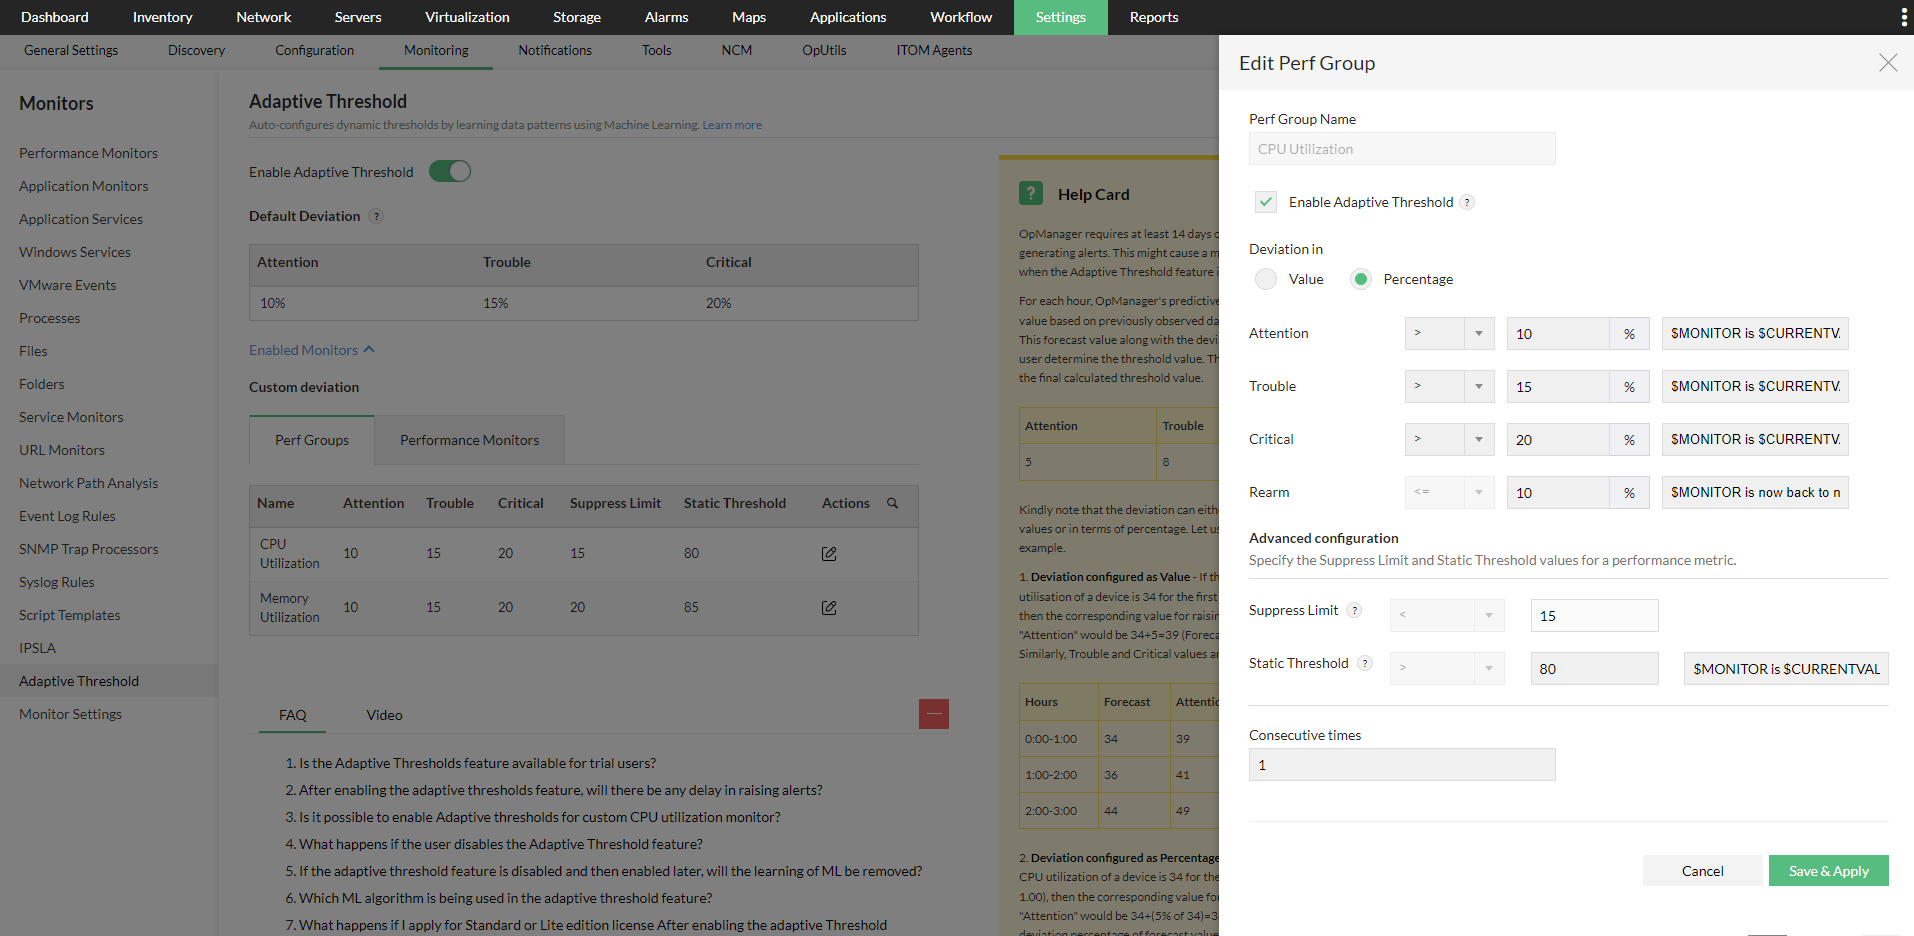
- Select the value or percentage radio buttons under the Deviation in header, and then enter the respective values.
- Click Save to apply the changes to your monitor(s). OpManager will start forecasting threshold values once there is enough data to be used by the algorithms (min. 14 days).