Anomaly Detection in OpManager
OpManager's anomaly detection feature helps track granular deviations across devices that can eventually lead to major network downtime. It allows you to monitor not only threshold breaches but also behavioral changes in devices, referred to as anomalies.
Significance of anomaly detection
Anomaly detection in OpManager aggregates performance data at the device level and updates it every hour. This feature extends to the device groups as well. Unlike Adaptive Thresholds, which predict deviations based on performance trends, anomaly data is refreshed automatically, regardless of the polling interval.
This allows it to capture sudden deviations, such as performance spikes, and pinpoint the exact time of the anomaly. Any changes to device monitors—such as adding new ones or removing existing ones—are also taken into account automatically.
With anomaly detection, you can:
- Export data on device-level performance anomalies.
- Adjust the time period and export anomaly data for longer durations from the dashboard.
- Gain a bird's-eye view of performance monitor anomalies across device groups.
- View anomaly data and trends in a detailed dashboard.
Alarms and dashboard
OpManager collects data from supported performance monitors, including packet loss and response time, and aggregates it for each device. This anomaly data can be viewed in:
- Alarms
- Dashboard
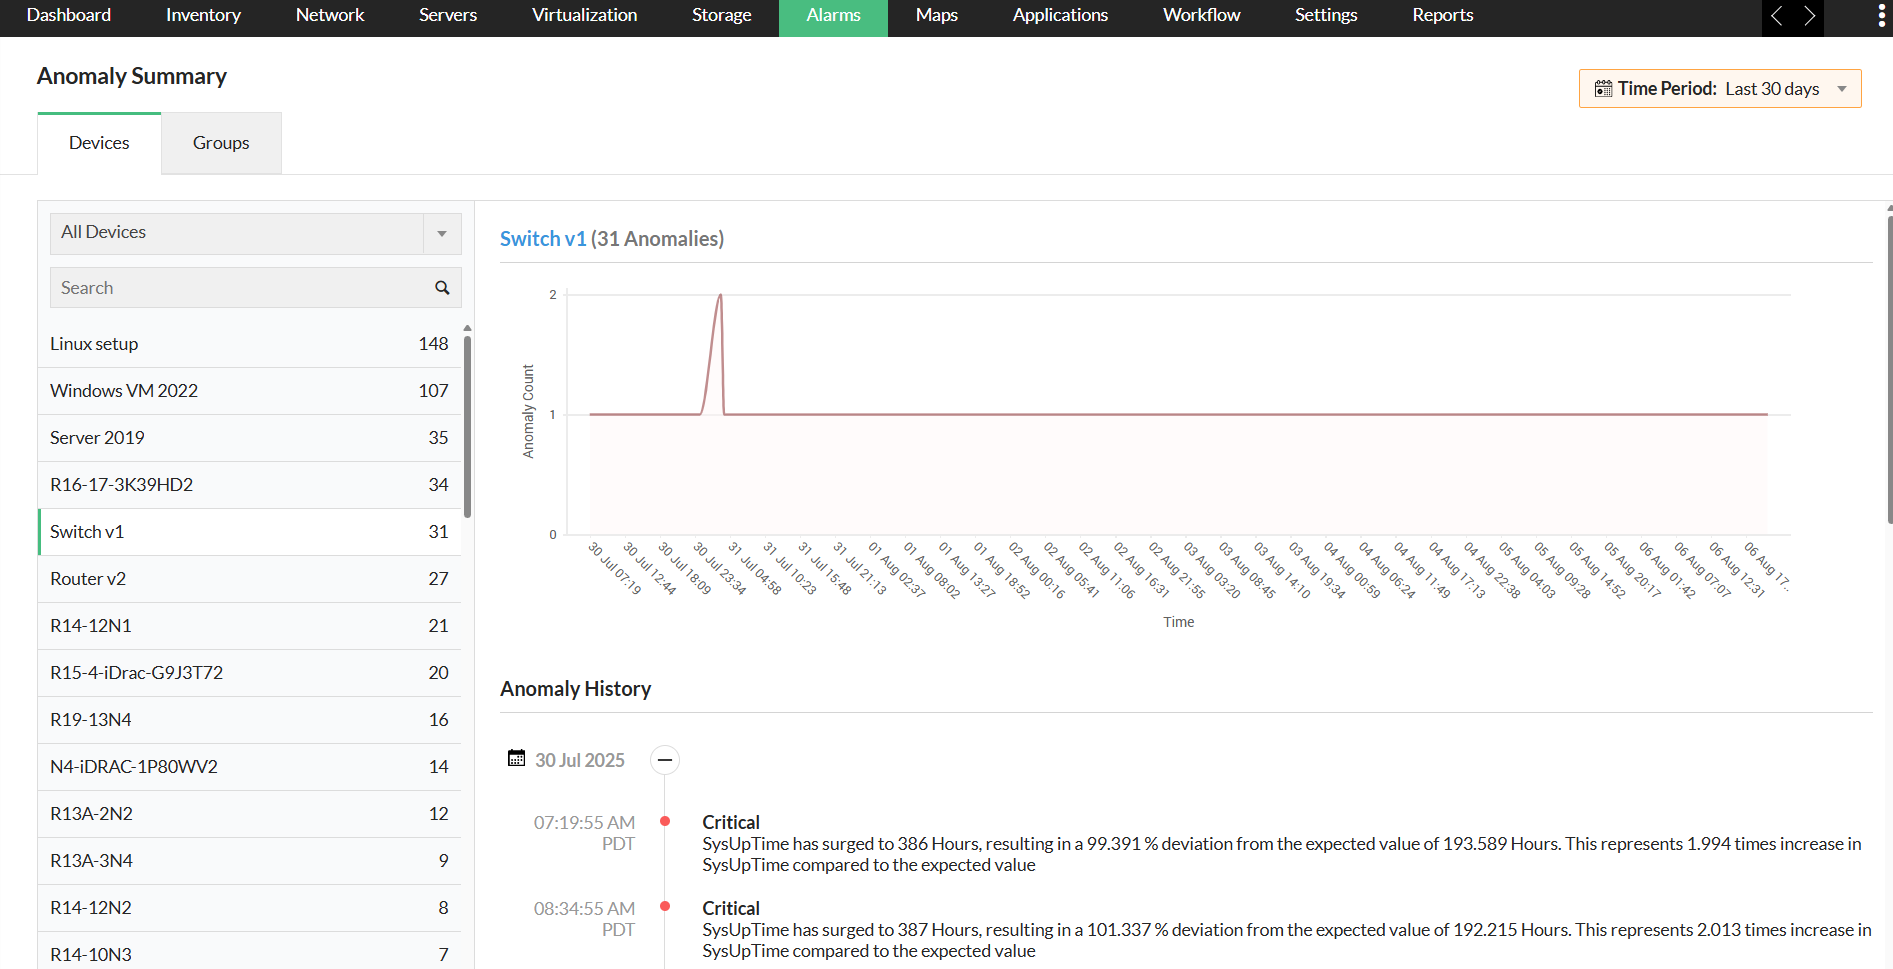
Alarms: To view updates for individual devices or device groups, go to Alarms → Anomalies. The time period of the data can be adjusted, and clicking on a specific point in the graph takes you directly to the corresponding entry in the anomaly history, making it easier to locate and analyze issues.
Dashboard: To access the anomaly dashboard, go to Dashboard → Zia → Anomaly dashboard. The dedicated Anomalies dashboard visually represents anomaly data through graphs and charts, classifying them by severity based on deviation percentage—Attention (20–60%), Trouble (60–90%), or Critical (above 90%). From the Anomalies Summary option, you can navigate directly to the Anomalies section under the Alarms tab for a more detailed view.
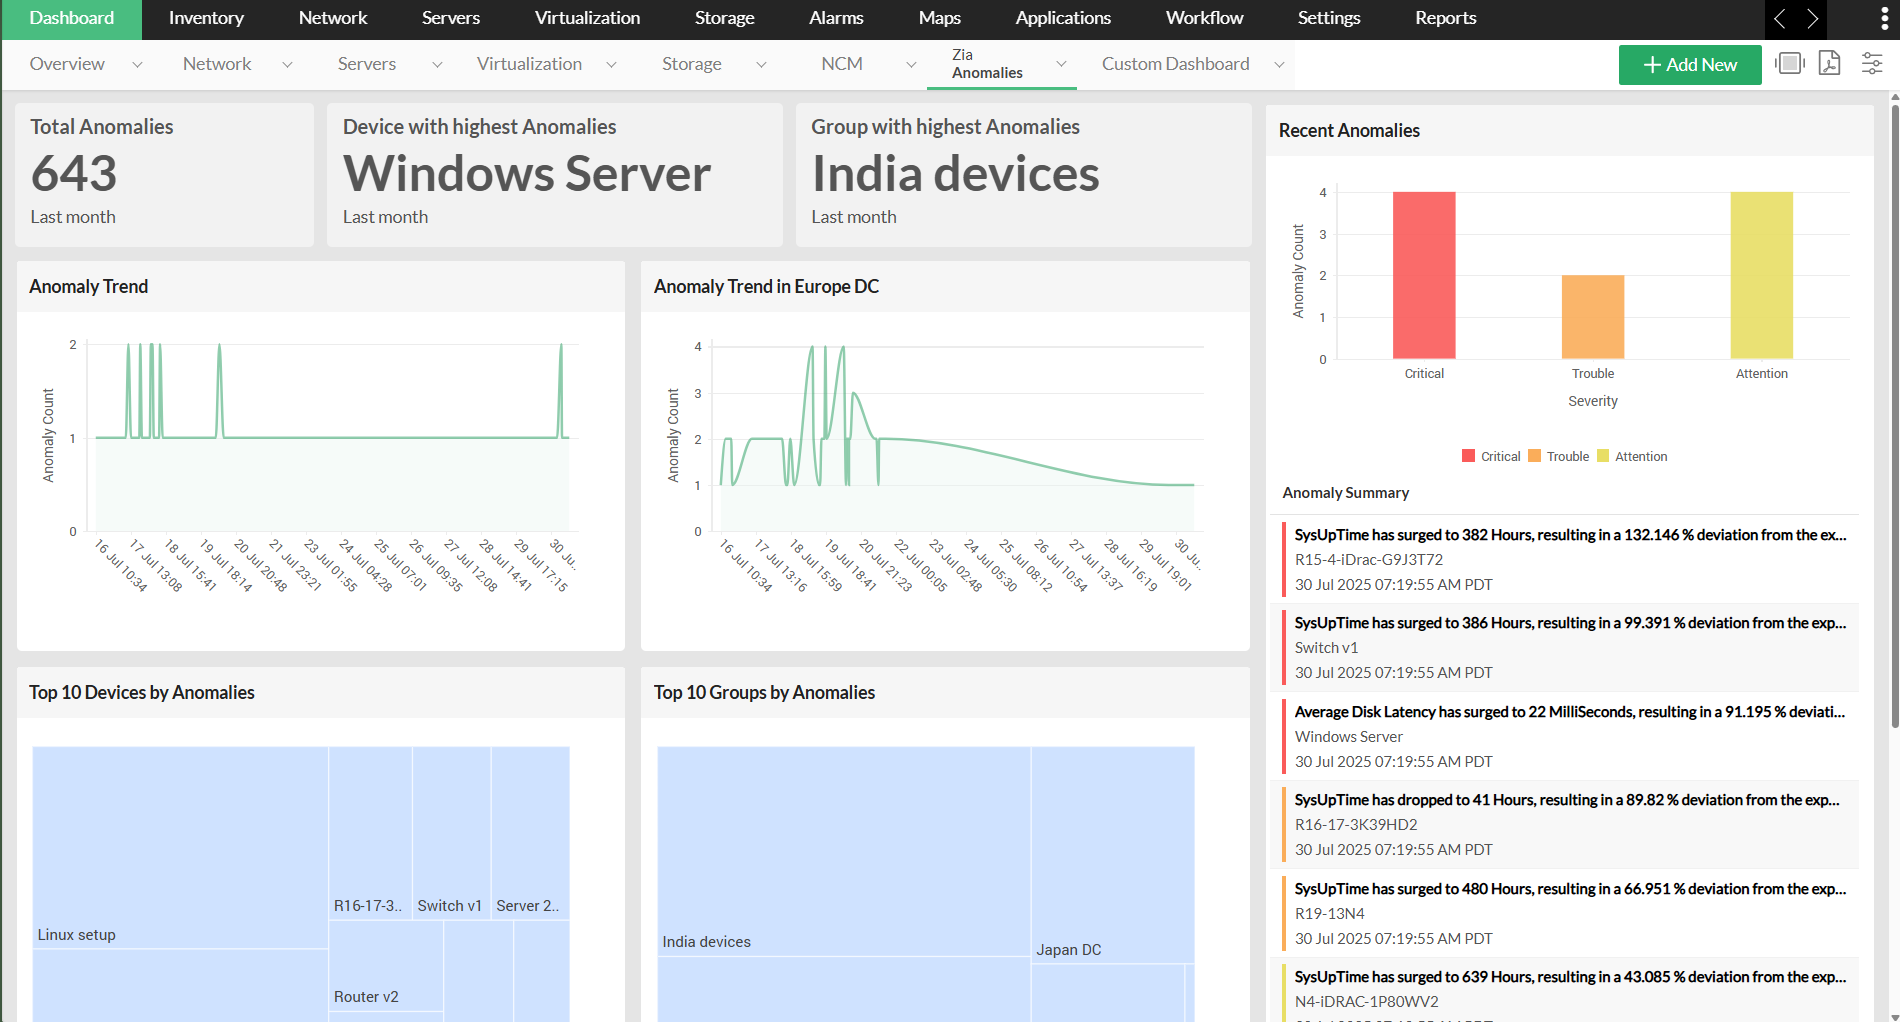
The dashboard displays:
- Overall Anomalies: Displays the total number of anomalies across all devices.
- Recent Anomalies: Shows the expected value of a metric, its real-time value, the deviation, the affected device, and the time of occurrence.
- Devices with Highest Anomalies: Lists devices with the maximum number of anomalies.
- Groups with Highest Anomalies: Lists device groups with the maximum number of anomalies.
- Anomaly Trends: Displays the trend of anomalies over a selected time period.
- Top 10 Anomalies: Shows the top 10 anomalies by device and group.
You can adjust the time period of the anomalies displayed and export their summary directly from the dashboard.