Configuring thresholds for performance monitors
Configuring thresholds enable OpManager to proactively monitor the resources and the services running on the servers and network devices, and raise alerts before they go down or reach the critical condition. OpManager offers multiple threshold levels namely:
- Attention threshold - low severity
- Trouble threshold - medium severity
- Critical threshold - high severity
- Rearm - to rearm the alert after it has been triggered
You can configure multiple thresholds for the monitors that are associated to a single device, and even configure them from a device template in order to apply across multiple devices. Also, if you are going to enable custom dials, the thresholds configured for the monitor will also be applicable for the custom dial, and the color of the dial will change in real time based on the status of that monitor.
- To configure threshold for performance monitors in an individual device
- To configure threshold for performance monitors in an individual interface
- To configure threshold for multiple devices of the same type using Device Template
- To configure threshold for multiple interfaces of the same type using Device Template
- To configure the Performance Monitors page
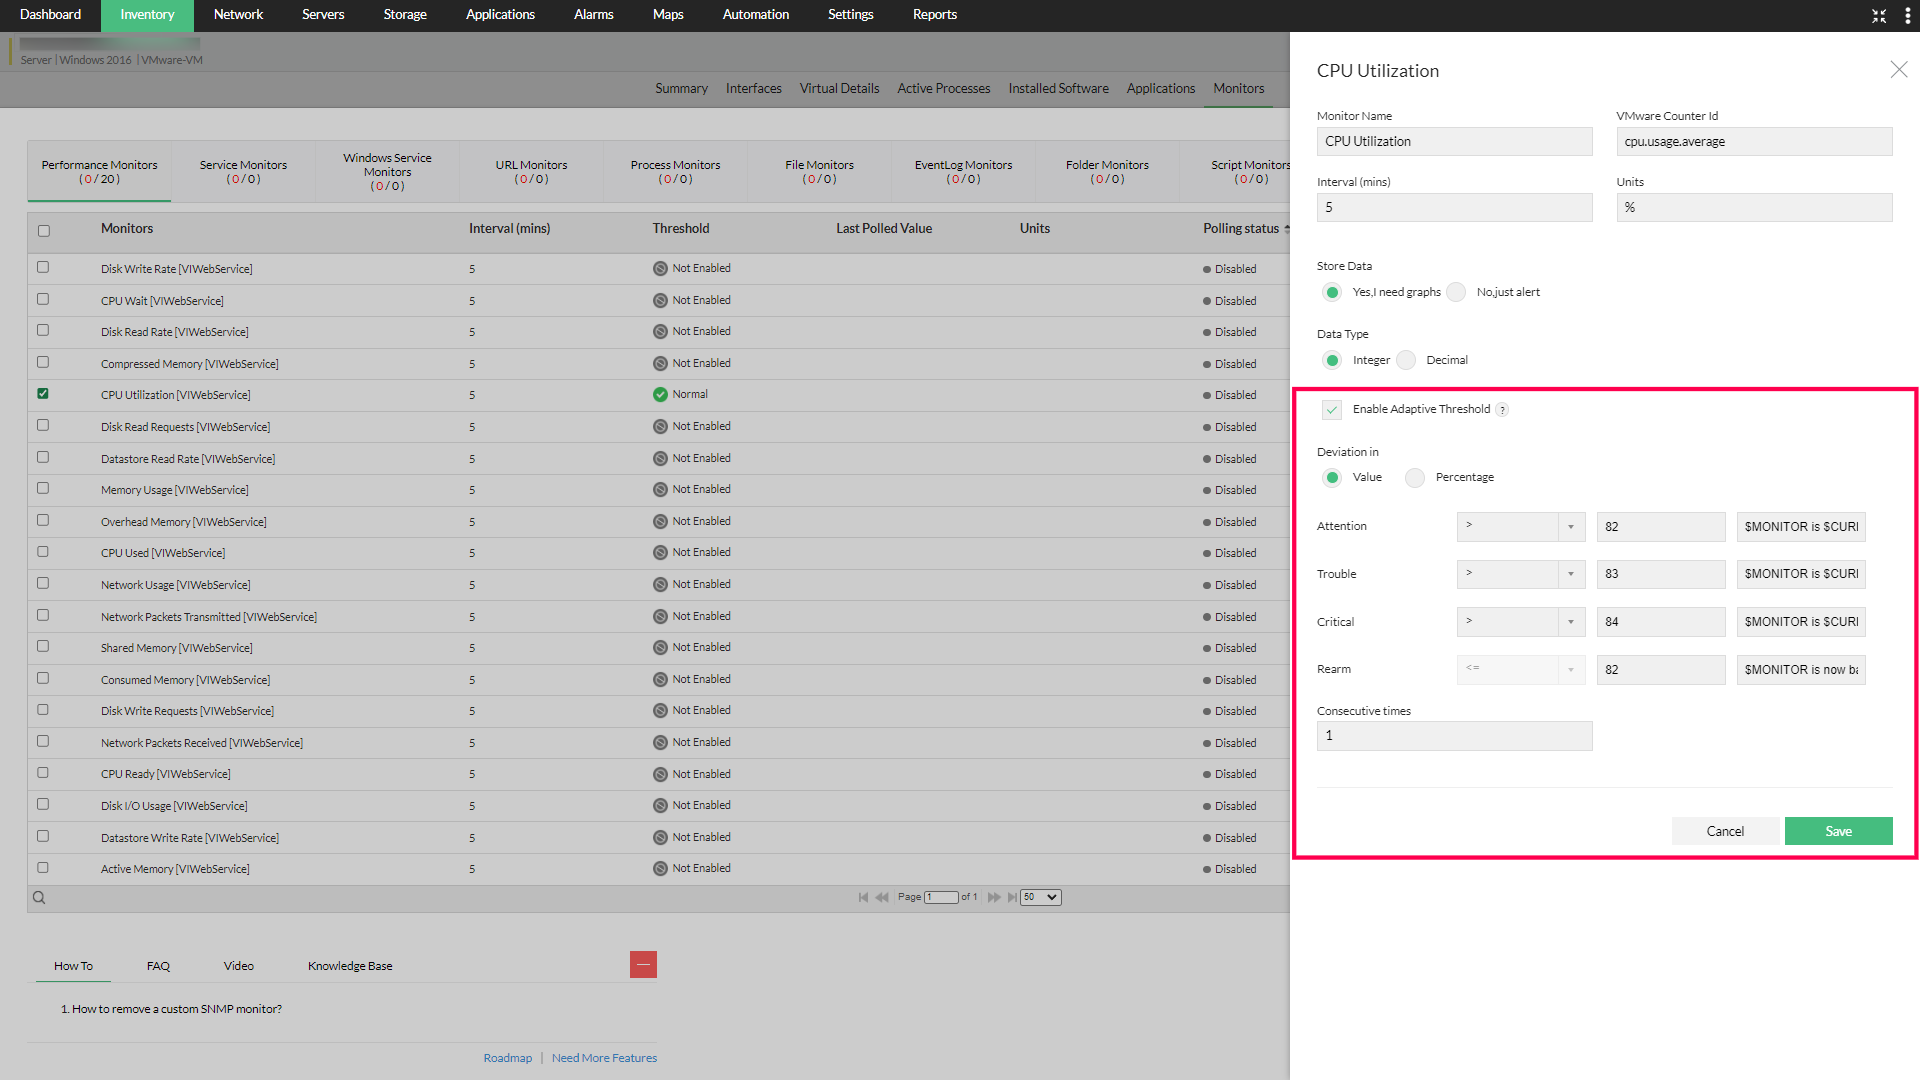
- To configure the Adaptive Thresholds page
Configure threshold for performance monitors in an individual device
- Navigate to Inventory → Devices and then click on a device to open its snapshot page.
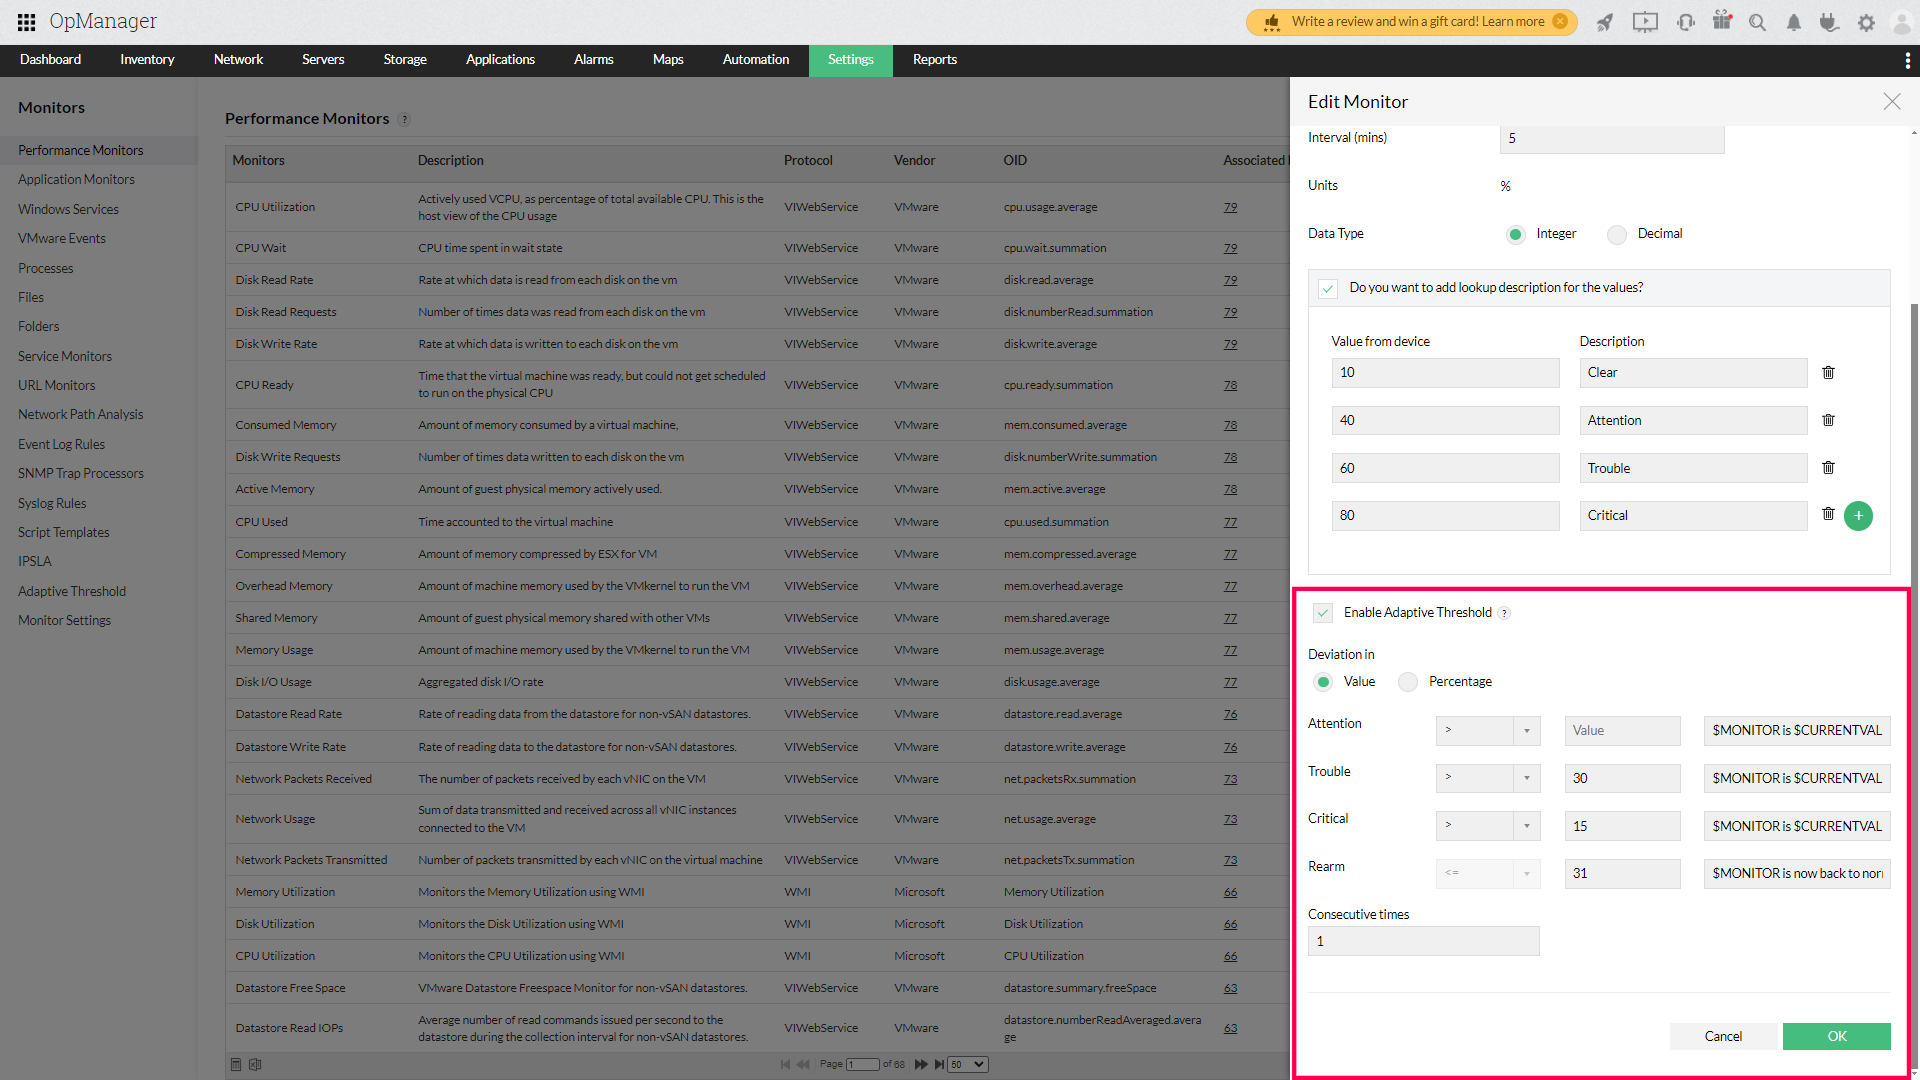
- Click Monitors → Performance Monitors → click on the edit icon corresponding to the monitor for which you want to configure threshold limits. Edit Monitor page opens.
- Ensure that the monitoring Interval is configured.
- Specify the unit for the monitored resource in terms of percentage, MB, KB etc (based on how the parameter is measured).
- Select the condition [>,=, <, or !=] for Attention, Trouble, and Critical severity and enter the value. Alert is raised if the monitored value is greater than, equal to, not equal to, or lesser than (which ever is selected ) the threshold value.Also, for = operator, you can provide multiple values using pipe '|' as the separator. Ex: 1|2|3
- Enter the Rearm Value. Rearm is the value that determines when the monitor is reverted back to 'Normal' status.
Example: The Warning threshold condition for a memory monitor is selected as greater than [>] and the threshold value is configured as 75. If the value of the monitor oscillates between 72, 80 and 73 for three successive polls, an alert is not raised for the poll with value '80' but the admin might still wish to receive an alert for it.
To avoid this, you can set the Rearm value at a considerably wide interval (say 70 in this situation) to make sure the status returns to 'Normal' only when the value goes below this threshold.Note that if you set the thresholds' conditions using '>' criteria, then the rearm value can only be set using '<=' and vice versa.
- In the Consecutive Times field enter the value of how many consecutive times the thresholds (Attention, Trouble and Critical) can be violated to generate the alert.
- Click on Save.
Configure threshold for performance monitors in an individual interface
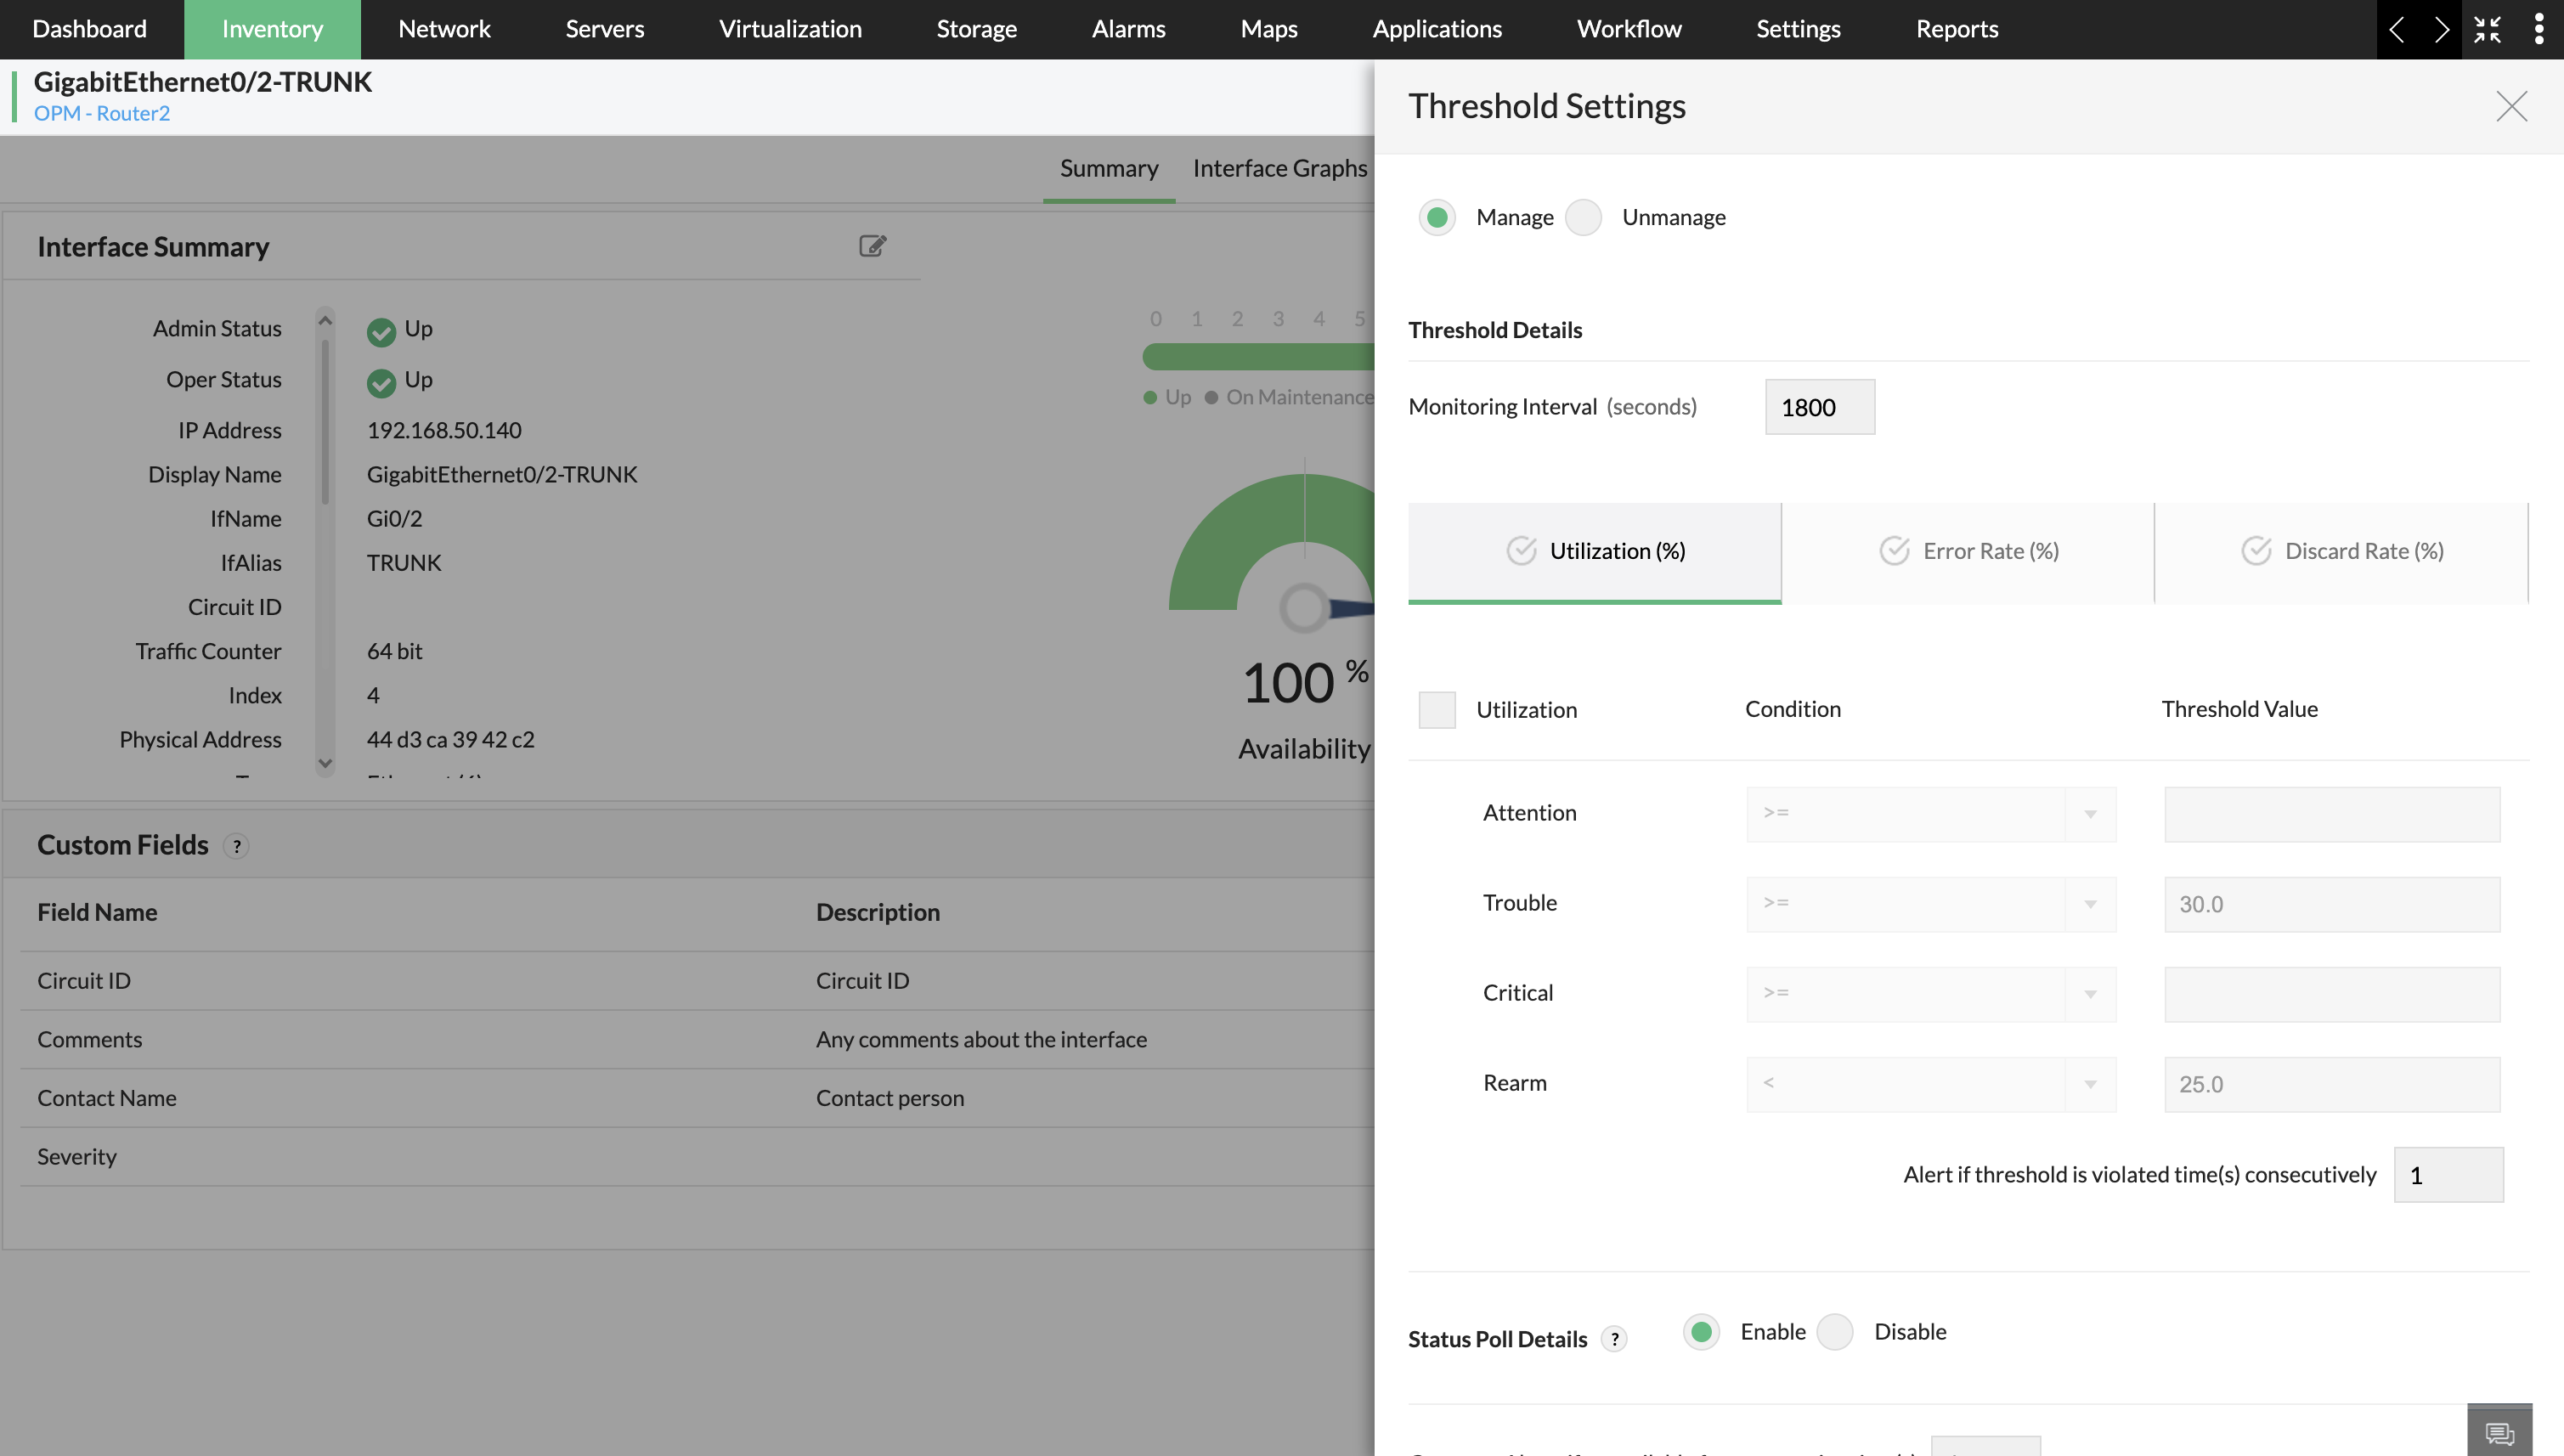
- Navigate to Inventory → Interfaces or go through Inventory → Device → Interfaces and select the desired interface (e.g., GigabitEthernet0/2-TRUNK).
- On the Interface Snapshot page, click the menu icon (⋮) at the top-right corner.
- Select Threshold Settings from the dropdown to open the configuration panel on the right.
- Configure thresholds based on your preferred Severity (Attention, Trouble, Critical) along with its Rearm value.
- Configure Threshold Settings →
- Click on one of the metric tabs: Utilization (%), Error Rate (%), or Discard Rate (%).
- Set Threshold Values →
- Under each selected tab, enter values for Attention, Trouble, Critical, and Rearm.
- For example, under Utilization (%), set thresholds like
Trouble ≥ 30andRearm < 25.
- In the field below, specify how many consecutive violations should trigger an alert.
- Enable or Disable Polling:
- Scroll to the bottom and choose to Enable or DisableStatus Poll Details to activate or deactivate monitoring for the interface.
- Save Changes: Once all configurations are done, click Save to apply the settings.
Configure threshold for multiple devices of same type using Device Template
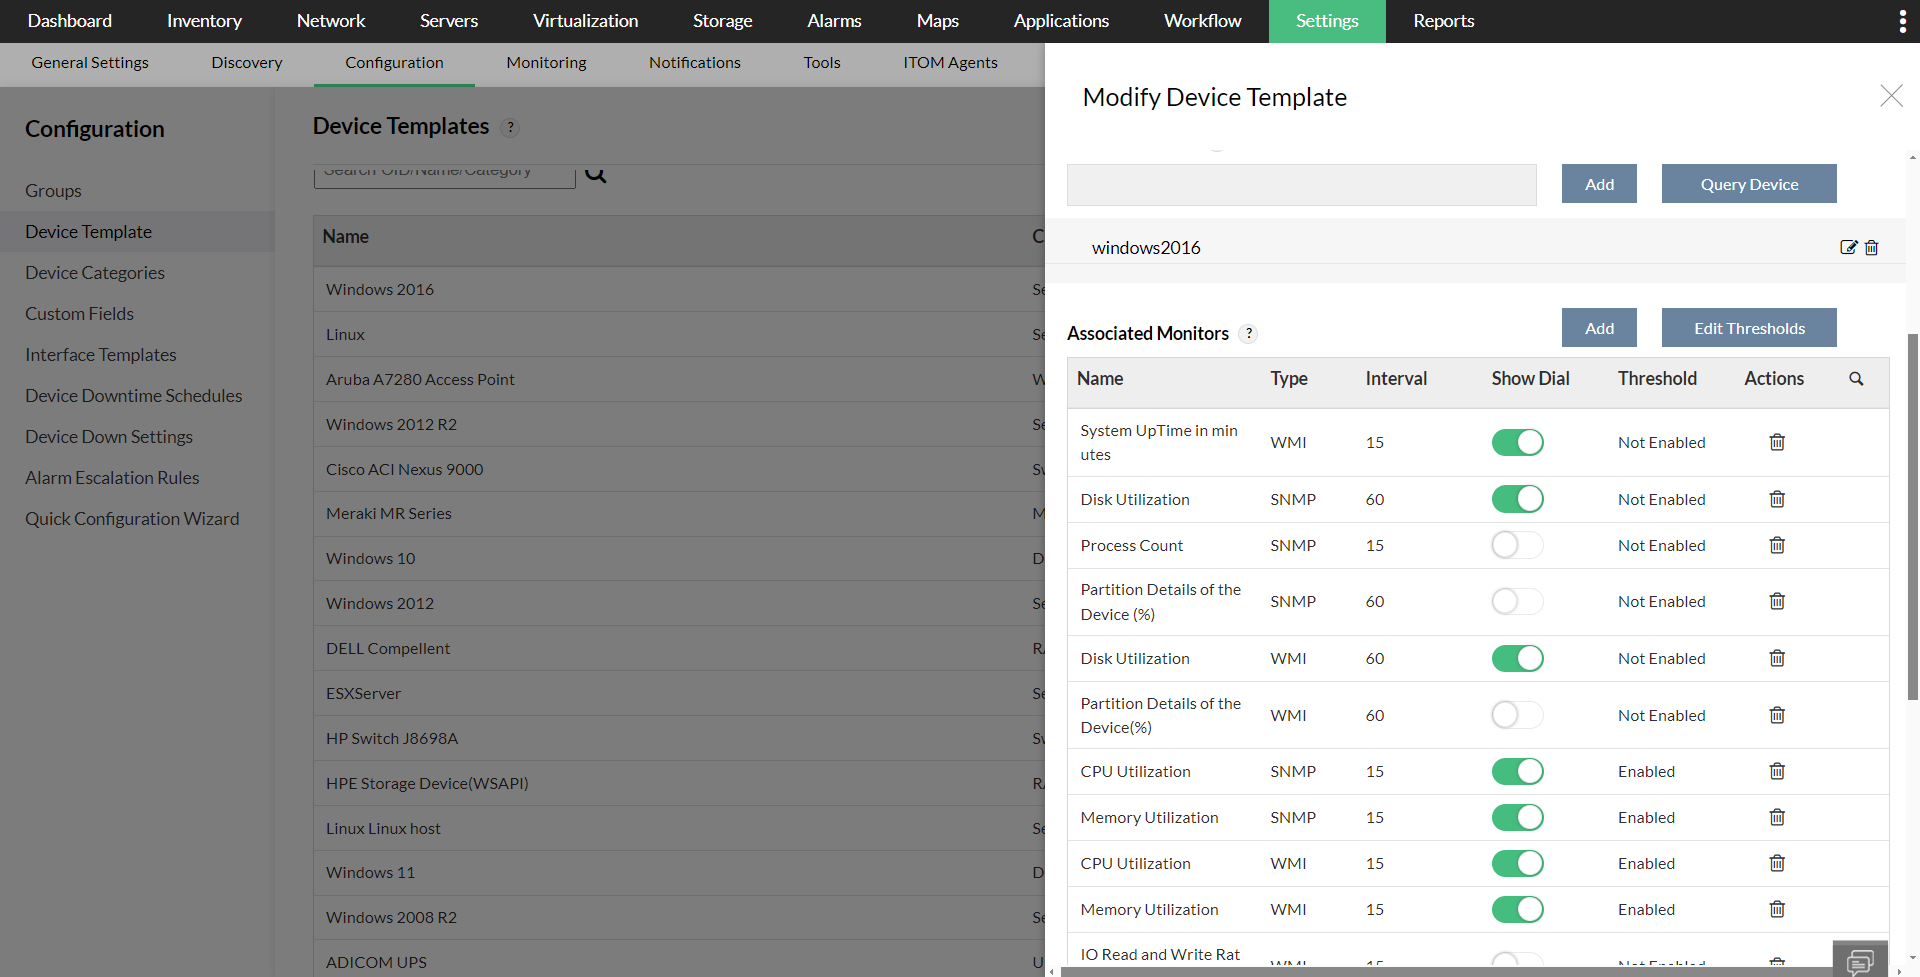
- Go to Settings → Configuration → Device Templates and select the template in which you want to configure the threshold.
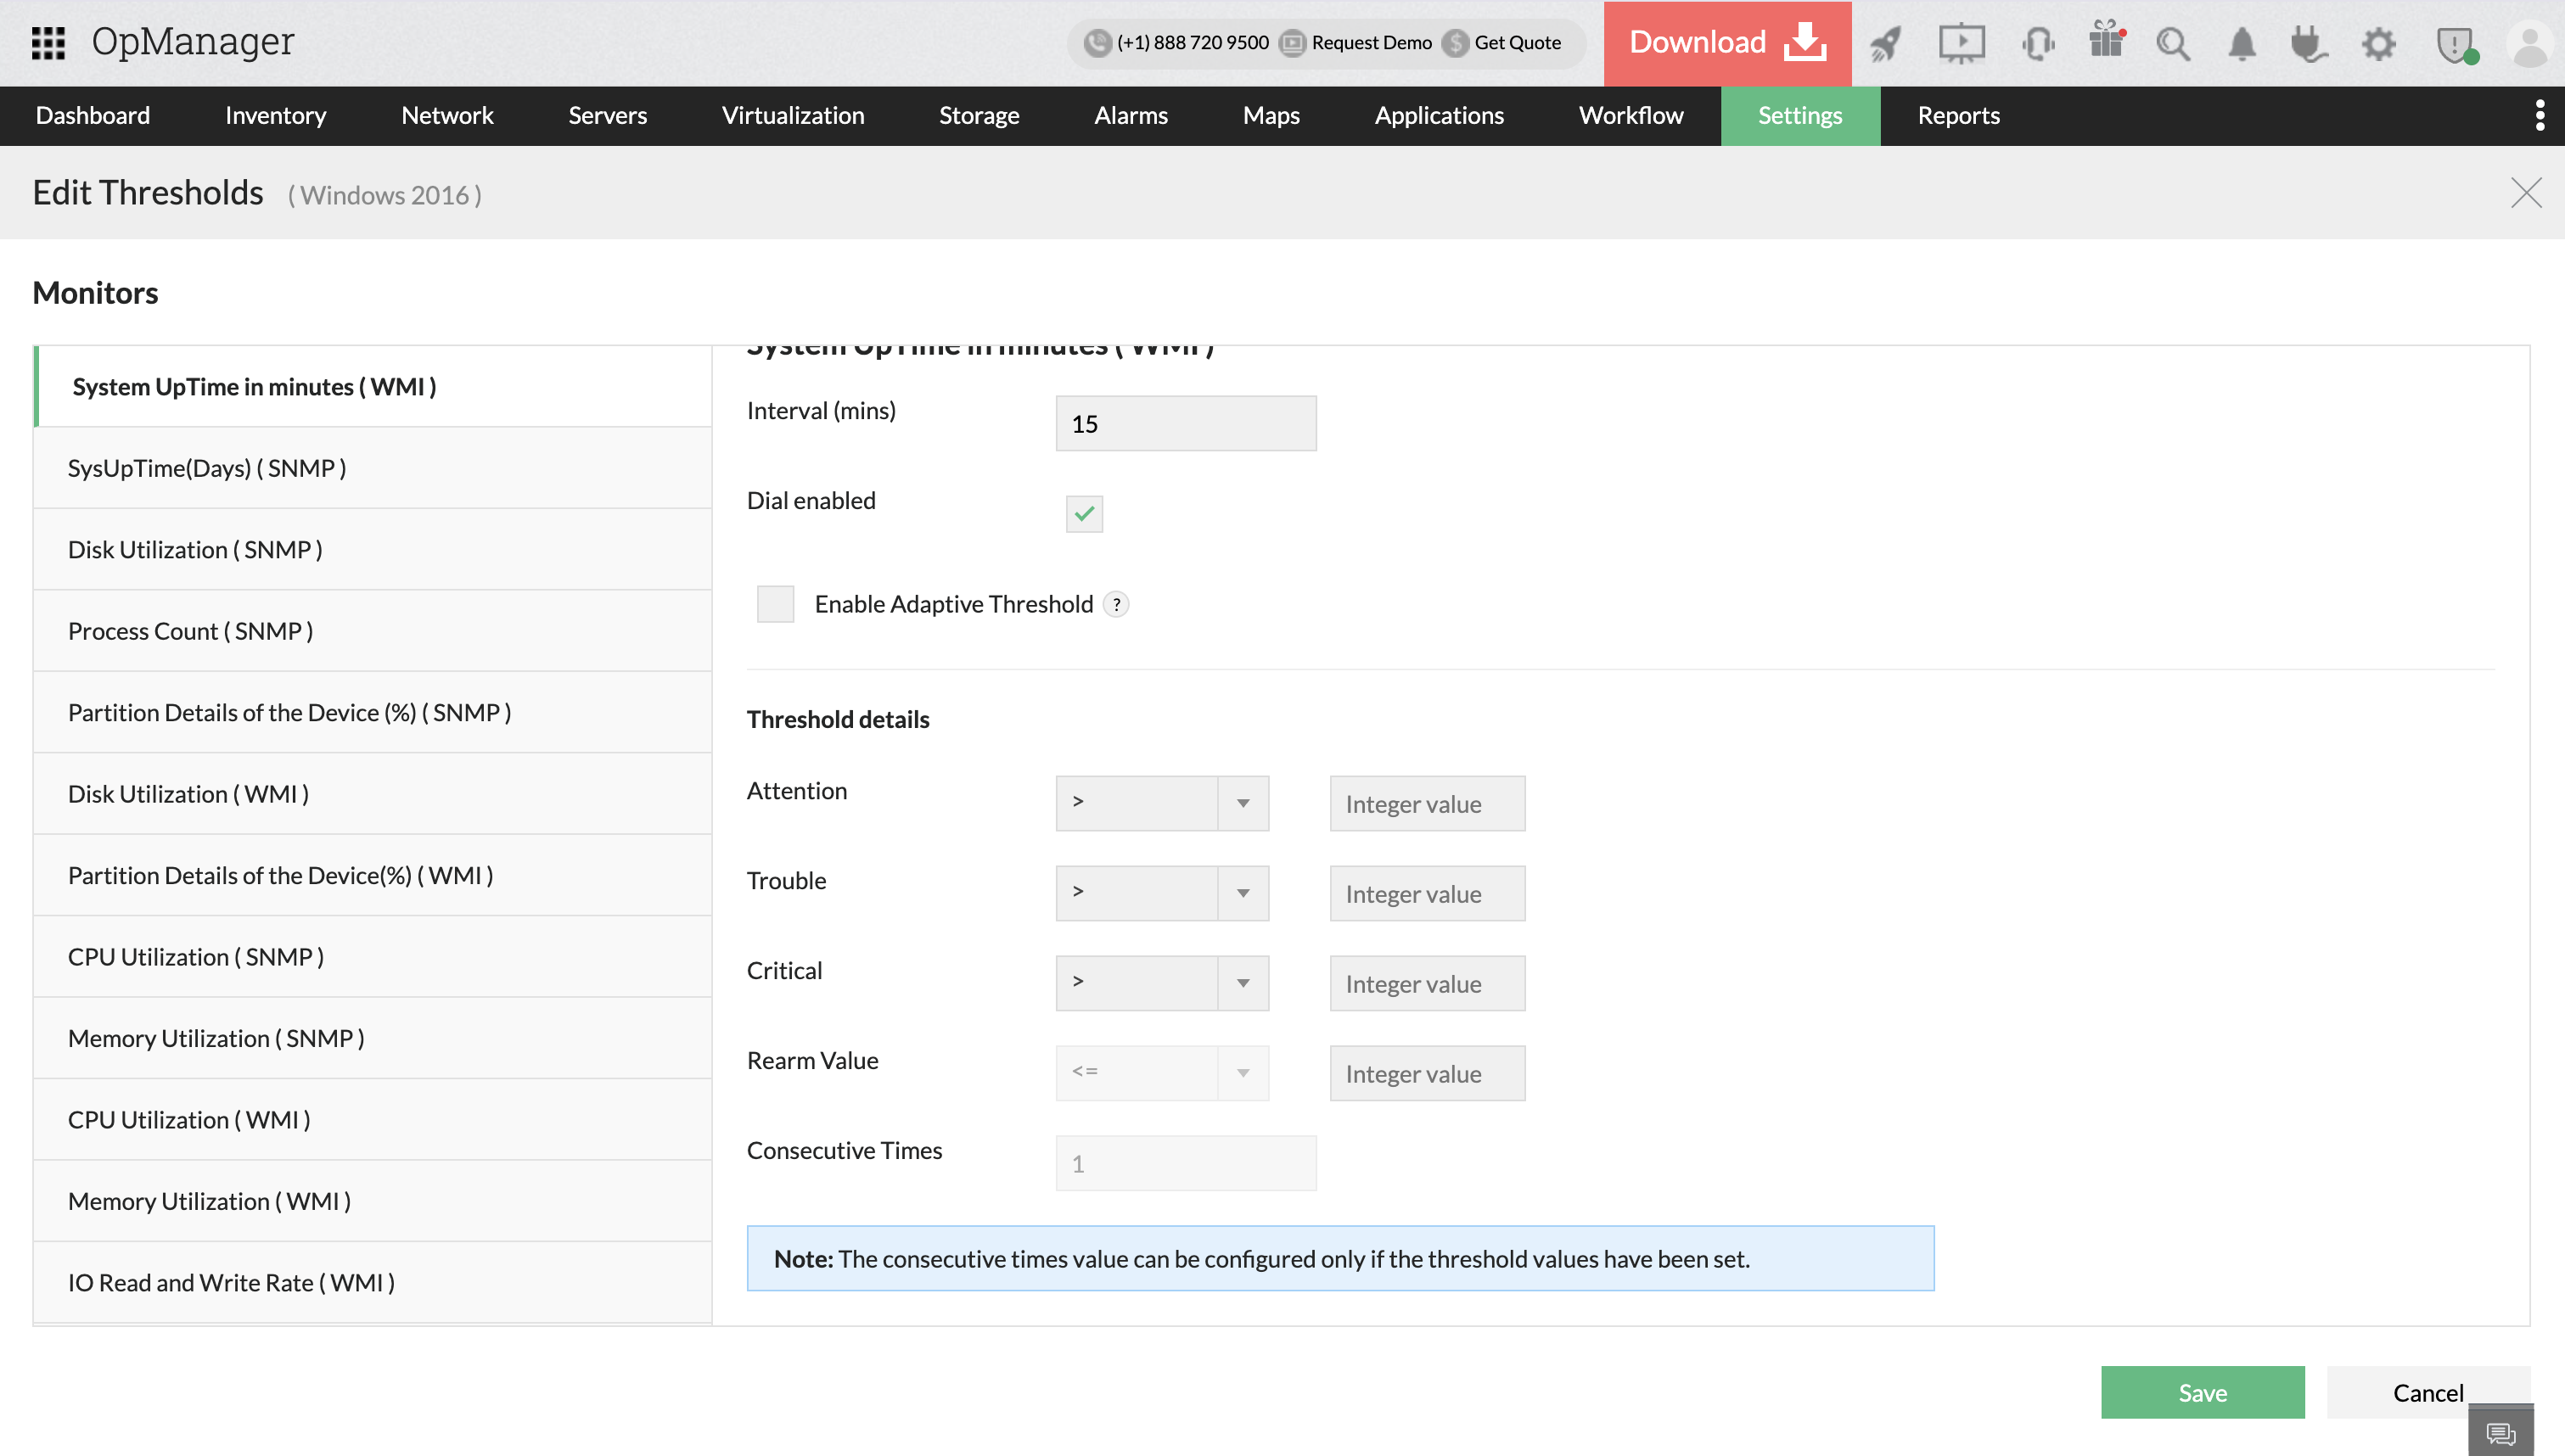
- Under Monitors column, all the monitors that are currently associated with the devices are listed. If you want toadd additional default or custom monitors. Click on EditThresholds button. Edit Thresholds page opens.
- Click here to know more about adding additional default or custom monitors.
- Configure thresholds based on your preferred Severity (Attention, Trouble, Critical) along with its Rearm value.
- Click on OK.
Configure threshold for multiple interfaces of same type using Interface Template
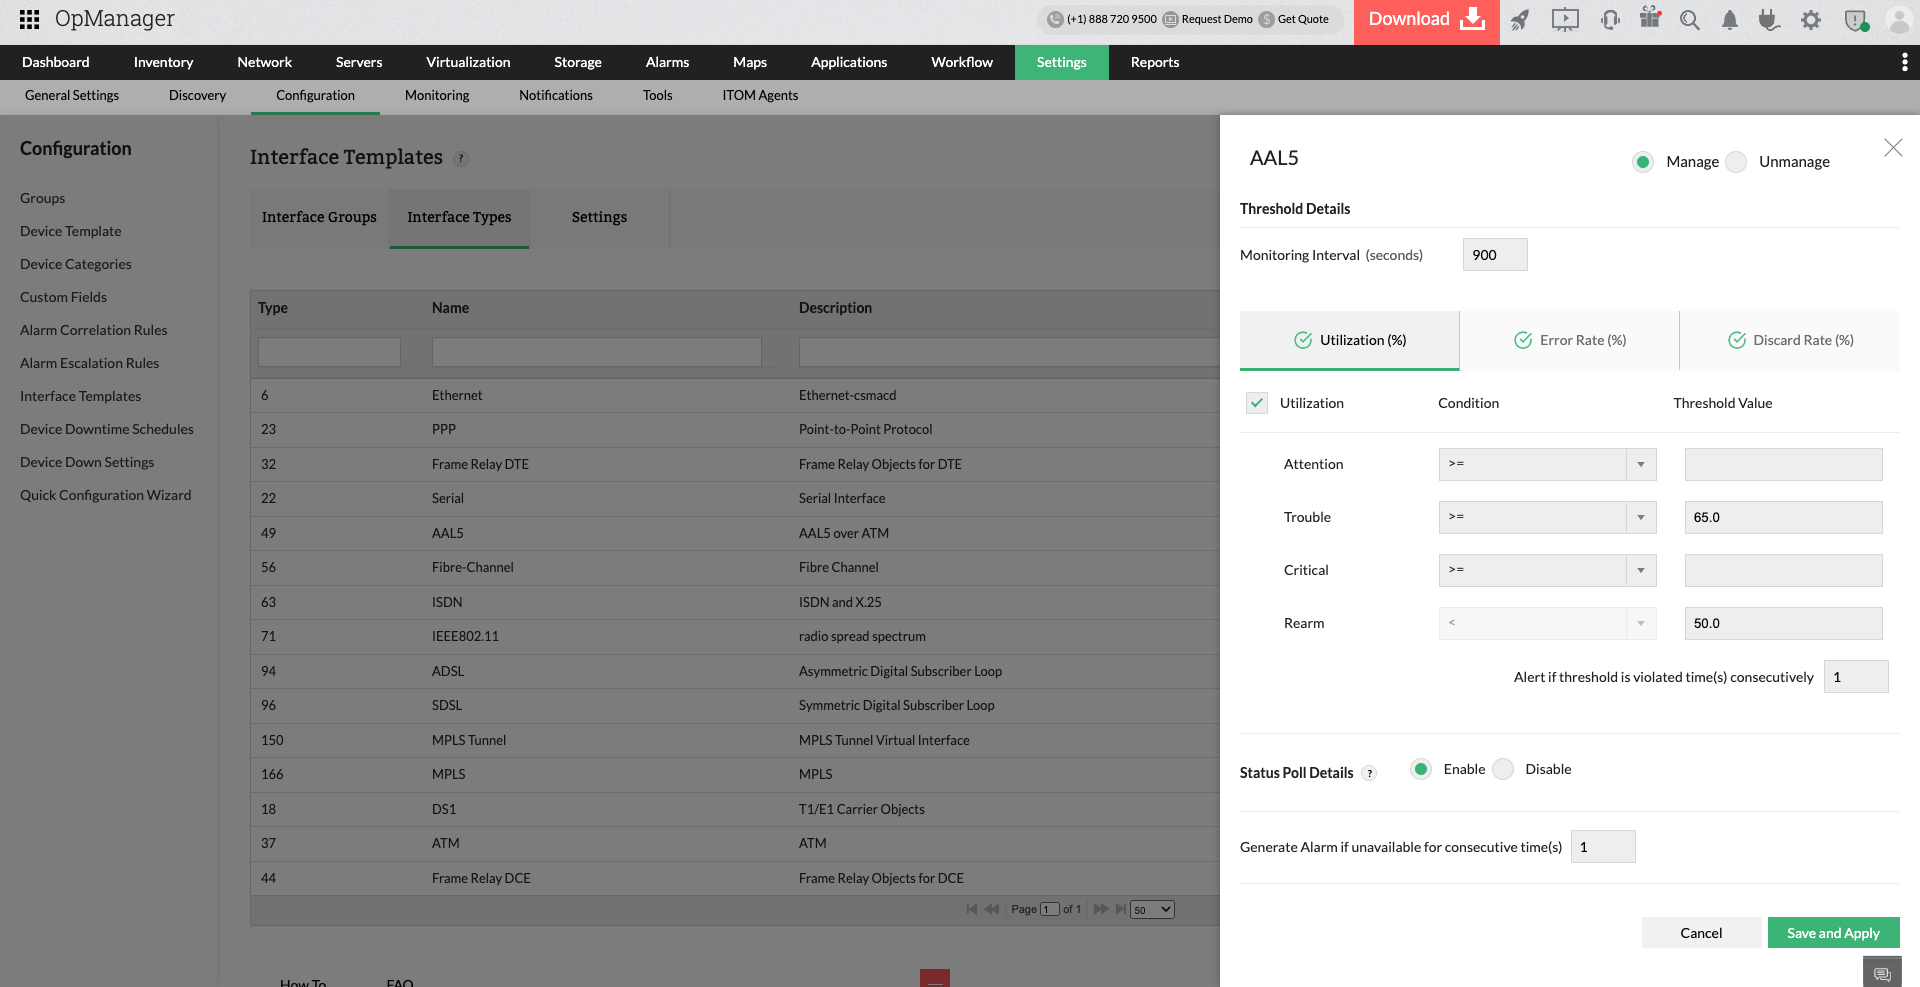
- Navigate to Settings → Configuration → Interface Templates and click on the Interface Types tab.
- Click on the interface name (e.g., ethernet) to open its Threshold Details on the right pane.
- Configure Threshold Settings → you will see three main tabs: Utilization (%), Error Rate (%), and Discard Rate (%). Select the appropriate tab you want to configure.
- Configure thresholds based on your preferred Severity (Attention, Trouble, Critical) along with its Rearm value. For example, in Utilization (%), you can configure thresholds for when alerts should be triggered based on usage.
- Enable all monitors to take effect in the associated interfaces.
- Enable or Disable Polling: At the bottom, choose to Enable or DisableStatus Poll Details and configure how many times the alarm should be triggered if the threshold is violated.
- Save and Apply Changes: Once all settings are configured, click Save and Apply to commit the changes.
Apply thresholds in bulk using Interface Groups to configure thresholds across different interface types.
Configuring thresholds from the Performance Monitors page:
- Go to Settings → Monitoring → Performance monitors and click the 'Edit' icon next to the monitor of your choice.
- Change the threshold values as required and click 'Save'.
- Once it's done, click the 'Associate' button next to the monitor to associate it to the necessary devices.
- To associate monitors in bulk, click on the associate icon at the top right corner of the page, and select the monitors you want to associate with devices.
- Lookup values customize the display of collected performance monitor values by assigning user-defined text labels for easier interpretation and reporting.
Configure from the Adaptive Thresholds page:
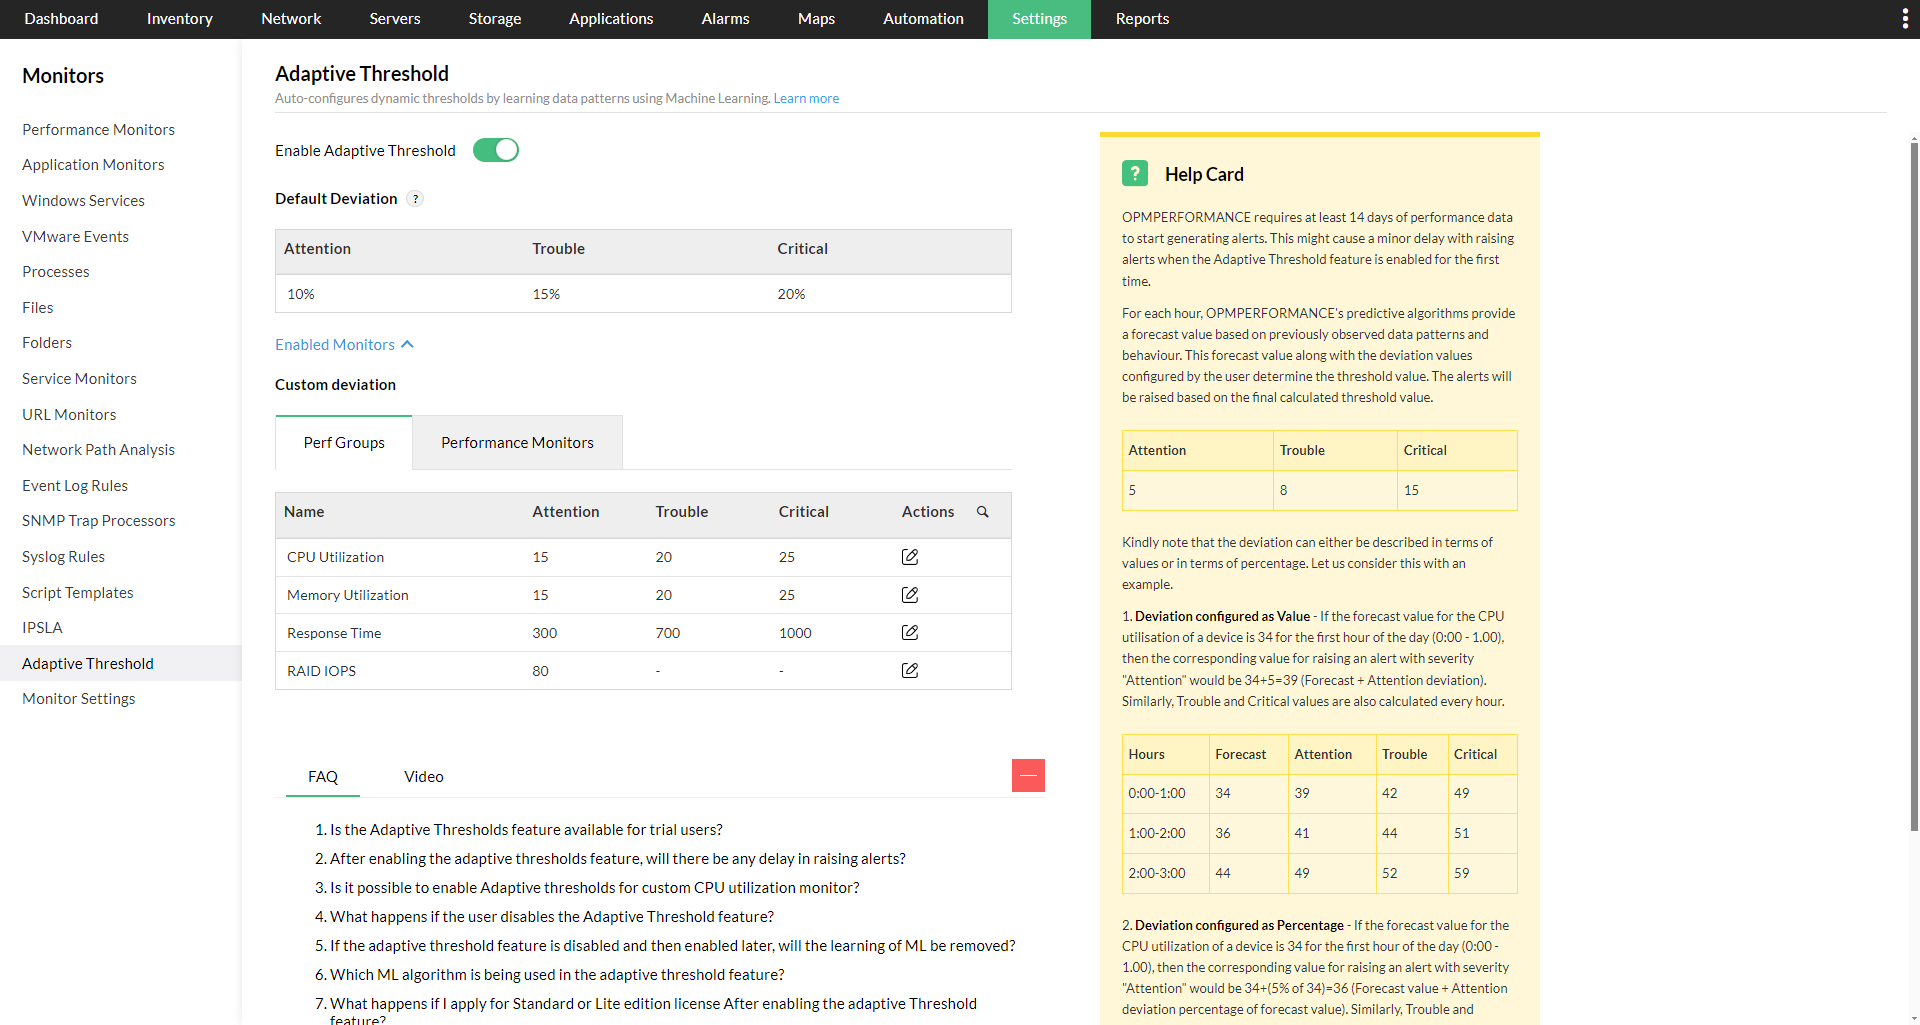
Adaptive Thresholds in OpManager automatically adjust performance limits based on historical trends and usage patterns.This helps minimize false alerts by recognizing normal variations in device behavior over time.
- Go to Settings → Monitoring → Adaptive Threshold.
- Enable the "Enable Adaptive Threshold" radio button.
- Configure the deviation values from the below table under the actions column, for both perf groups and performance monitors.
- Click on "Save".
Learn more about Adaptive Thresholds.
