# Log File Monitoring
Every application prints status messages, error messages, and other critical information in its log. It is very tedious to skim through all these bulky log files to understand application performance. To manage such mission critical applications in real time, monitoring their log files is necessary. OpManager offers agent-based log file monitoring for real-time fault and performance management.
[](https://www.youtube-nocookie.com/embed/Vjn97o5sWQc)
## How does log file monitoring work?
The monitoring agent installed in the end machine, monitors the log files continuously for the required string (It may even be in regex format). Once that string, or the mentioned regex matching string format, is identified, it immediately notifies the OpManager server, which in-turn raises an alarm based on the polling interval specified for that file monitor.
## Steps to Add a Log File Monitor
**Prerequisites:** Log file monitoring can only be done on agent-monitored devices. Ensure that the agent has been installed before adding the log file monitor.
You can add a log file monitor in two ways:
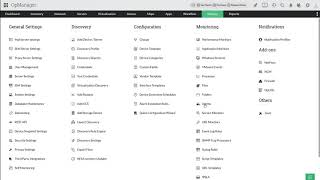
- **Through File Templates:** Go to **Settings → Monitoring → Files → Add a New Template**.
- **Via Device Snapshot Page:** Go to **Inventory → Devices**, click on a device, and navigate to **Monitors → File Monitor → Add New Monitor**.
Once in the configuration screen, follow these steps:
1. Enter a template name and a path to the file.
2. Set the polling interval so that alarms can be raised.
3. Under the **File contains** field, enter the search string (whole sequence of words or a particular word) or a regular expression format based string.
4. Select the **Match Case** check box if you want the search to be case-sensitive.
5. Enter the number of consecutive times of the log print for which you want to raise the alarm.
6. Click **Save**, or **Save & Associate** to immediately associate it with the required devices.
**Note:** An additional **Test Monitor** option is available on the Device Snapshot Page, which allows you to test the file path to ensure that the file is available.
### Configuring DateTime Pattern Recognition
If the log files you want to monitor carry **date-stamped names** to identify the creation of a new file each day, you can configure DateTime Pattern recognition to automatically track the correct file according to a corresponding date, reducing time spent on manual configuration. To do this,
- Check the **Use Pattern** box before entering the file path in step 1.
- The following additional fields will appear:
1. Enter the file path, replacing the date and time portion of the file name with `${FileNamePattern}`.
Example: `file_${FileNamePattern}.txt` for `file_20260430.txt`
2. Enter the corresponding Date Time Pattern in the **File Name Pattern** field.
Example: `$YYYY$MM$DD` for `file_20260430.txt`
- Then, continue with steps 3—6 above to complete the configuration.
**Note:** Only the Year, Month, and Date sections of the Date Time Pattern are validated. Once a DateTime Pattern monitor has been configured, the file path cannot be modified; however, the Date Time Pattern itself is amenable to changes.
## Regex Pattern Guidelines
Under the **File contains** field, you can enter the search string as a whole sequence of words, a particular word, or as a regular expression (regex) format string. Regex input must be a plain expression without delimiters or flags. Ensure that you have tested your regex internally before configuring it in OpManager.
| Correct version | Incorrect version |
|---|---|
| `File\d*\.(txt|log)$` | `/File\d*\.(txt|log)$/` |
| `File\d*\.(txt|log)$` | `/^File\d*\.(txt|log)$/gm` |
| `((Destination).*(Suspend))` | `/.*[Destination].*[suspend]/gi` |
| `[error|critical]` | `/[error|critical]/` |
| `^.*Exception.*$` | `/^.*Exception.*$/gm` |
## Behaviour Reference
| Scenario | What OpManager does |
|---|---|
| File monitoring interval is modified mid-cycle | The match string that appeared in the current polling span (old monitoring interval) will be ignored and the alert will not be generated. The alert will be raised as usual based on the new monitoring interval from the next poll.
For instance,
- Consider the file monitoring interval is 5 mins, starting at 10.00 AM.
- Search string appears in the monitored log file at 10.02 AM (which will be raised as an alert at 10.05 AM).
- File monitoring interval is modified as 10 mins at 10.03 AM.
In the above case, the agent will **ignore the search string which appeared at 10.02 AM.** It starts a new monitoring cycle from 10.03 AM based on the new monitoring interval (10 mins). |
| A log file monitor is added and the agent is mapped to a device | A marker is set at the very end of that log file. OpManager will only monitor strings that are input after this point, and ignores all instances of the same string that were present before the monitor was mapped to the device.
This also applies to poll intervals, where OpManager sets a marker in the monitored file after each poll interval. **Only the content after the most recent poll is checked** for the search string, to avoid redundant alerts. |
| Search string appears multiple times within a single poll interval | OpManager does not take into consideration the number of instances of the string found; it only checks if the provided search string is present in the log file or not. For example, if a search string "A" is found 10 times in the log file content in a poll interval of 15 minutes, OpManager raises **only one alert** for this log file monitor and not 10 alerts. |
## Supported Patterns
| Pattern | Meaning | Example Value |
|---|---|---|
| $YYYY | 4-digit Year | 2026 |
| $YY | 2-digit Year | 26 |
| $MM | 2-digit Month Number | 04 |
| $MMM | Short Month Name | Apr |
| $MMMM | Full Month Name | April |
| $DD | 2-digit Day of Month | 28 |
| $D | Day of Month (single/double digit) | 28 |
| $HH | 2-digit Hour (24-hour format) | 09 |
| $H | Hour (24-hour format, single/double digit) | 9 |
| $mm | 2-digit Minutes | 05 |
| $m | Minutes (single/double digit) | 5 |
| $ss | 2-digit Seconds | 07 |
| $s | Seconds (single/double digit) | 7 |
| $SSS | Milliseconds (3 digits) | 123 |
## Scheduler behavior for date-based log file monitoring
Once a DateTime-patterned log file monitor is configured, it verifies that the specified file exists in the configured folder. If a unique file matching the DateTime pattern is found, the monitor begins tracking all content subsequently written to that file. If no file is found or multiple matching files are found, the monitor retries every minute until a unique file is identified.
Each day at 12:00 AM, a global scheduler looks for the current date's file. If found, monitoring switches to the new file immediately. If not found or multiple matching files are found, the scheduler retries until 12:05 AM. An alert is raised at 12:05 AM if a unique file cannot be identified.
**Example:** Assume the configured log file naming pattern is `file_YYYYMMDD.txt`. On 2026-04-30, the scheduler looks for `file_20260430.txt`.
- If exactly one matching file is found, monitoring starts immediately at 12:00 AM.
- If the file is not found or multiple matching files are found, the scheduler retries every minute until 12:05 AM.
- If a unique file is still not identified by 12:05 AM, an alert is raised.
- If multiple files are found by 12.05am, a single alert is raised, and polling is paused until a single, unique file is identified.
