# Monitoring VMware ESX servers
All the discovered hosts, VMs and datastores are mapped in the **'VMware'** section in the **Virtualization** menu. Click on **Virtualization** to access the dashboard page, which provides a quick glance of your critical resources such as CPU, Memory, Network & Disk that are under pressure. Though ideal resource utilization is the key benefit we get from virtualization, it can lead to other problems because it is shared among the servers. Even if a single system has a resource crunch, it hugely affects the performance of the other systems running on the same host. Quickly identifying and fixing the resource utilization problems is therefore vital for a business to run smooth.
OpManager [monitor VMware](https://www.manageengine.com/network-monitoring/vmware-monitoring.html?help-mon-vmware-esx) devices and shows the top hosts and VMs by resource utilization and the recent alarms raised. Click on the host / VM / Datastore name to see its snapshot page (Navigate to **Inventory -> Devices** and then click on a device to view its snapshot page). The Virtualization Dashboard page refreshes automatically every 5 minutes to reflect the latest collected statistics.
Listed below are a few of the various types of top resource utilization widgets that can help you to quickly identify any over utilized resource. These widgets give a quick glance on systems which are the top consumers of CPU, Memory, Network, Disk I/O and Disk Space and much more.
| Top VMs | Top Hosts |
|---|---|
| 1. Top CPU Consumers
2. Top CPU Ready Consumers
3. Top Memory Consumers
4. Top Swap Memory Consumers
5. Top Disk I/O Consumers
6. Top Network Consumers | 1. Top CPU Consumers
2. Top Memory Consumers
3. Top Swap Memory Consumers
4. Top Network Consumers
5. Top Disk I/O Consumers
6. Top Disk Space Consumers |
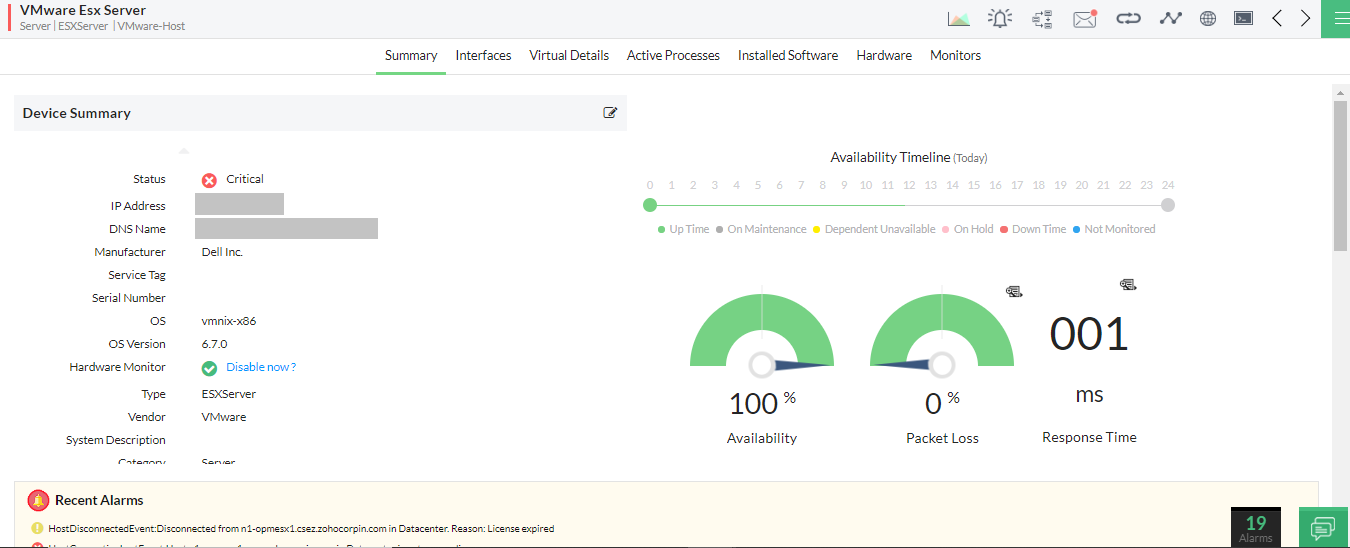
## Snapshot page of a ESX Server Host
Snapshot page of a host provides a summary of the current statistics, recent alarms, configuration details such as hardware status, VMs inventory, resource allocation for each VM, Network Adapters, HBA list and Datastores.
### Host Details and Performance Charts
In this section you can find the Host details like IP Address, Vendor of Host, CPU Cores etc. on the left side. The right side gives a quick glance on performance data like CPU Utilization, Memory Utilization, Disk I/O Usage etc., collected during the last poll. These values are collected periodically at a pre-defined interval (in minutes). These data help you determine the current performance of the Host.
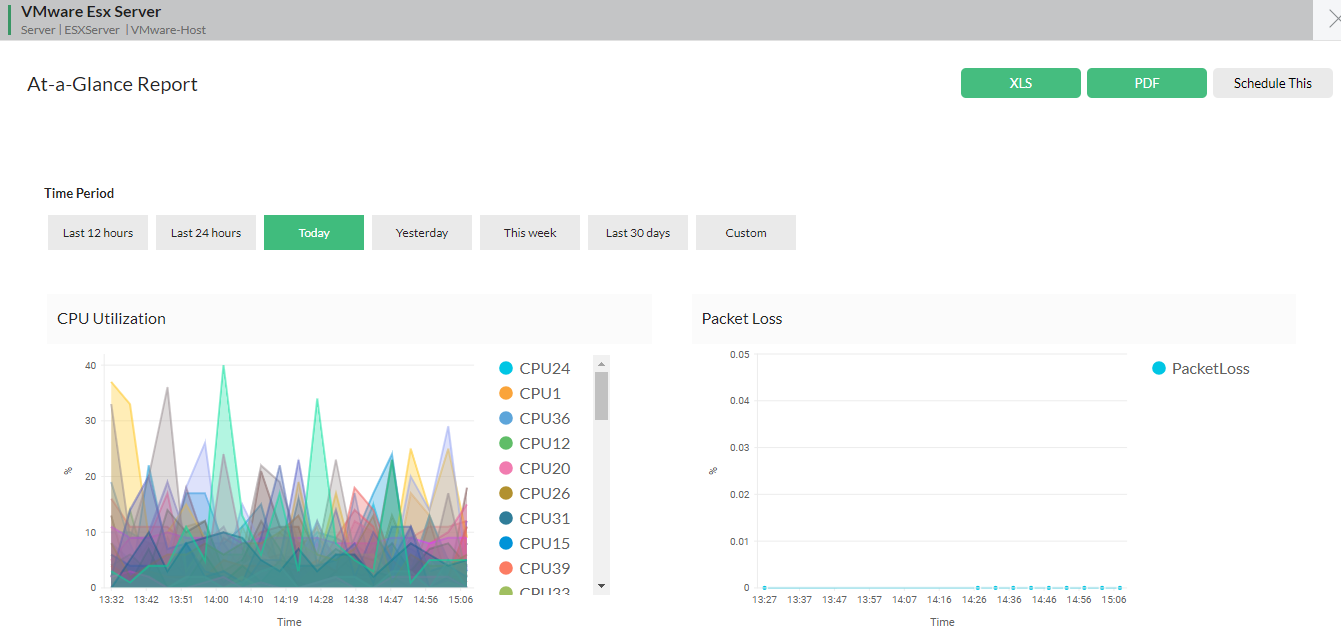
### Host Health At-a-Glance
This section provides the current day's performance chart of the host by default. You can view the reports of last 12 hours / 24 hours / 7 days or even a custom date range. You can export the report as XLS / PDF or even schedule it to be delivered via email.
### Hardware details

- You can view a host device's hardware stats such as sensor information, battery, memory, power, processor etc under the **hardware** tab in the device snapshot page.
- The hardware tab also shows the basic hardware and software information of the host such as manufacturer, OS version, model, alarms etc.
### VM List & Resource Allocation Details
This section lists all the VMs on the Host, resources allotted to each VM, network adapters, storage adapters and datastore details. Any change in the inventory, gets updated automatically. You can also find the monitors that are enabled on the Host and notification profiles associated to it. Click on the respective tab to view its details.
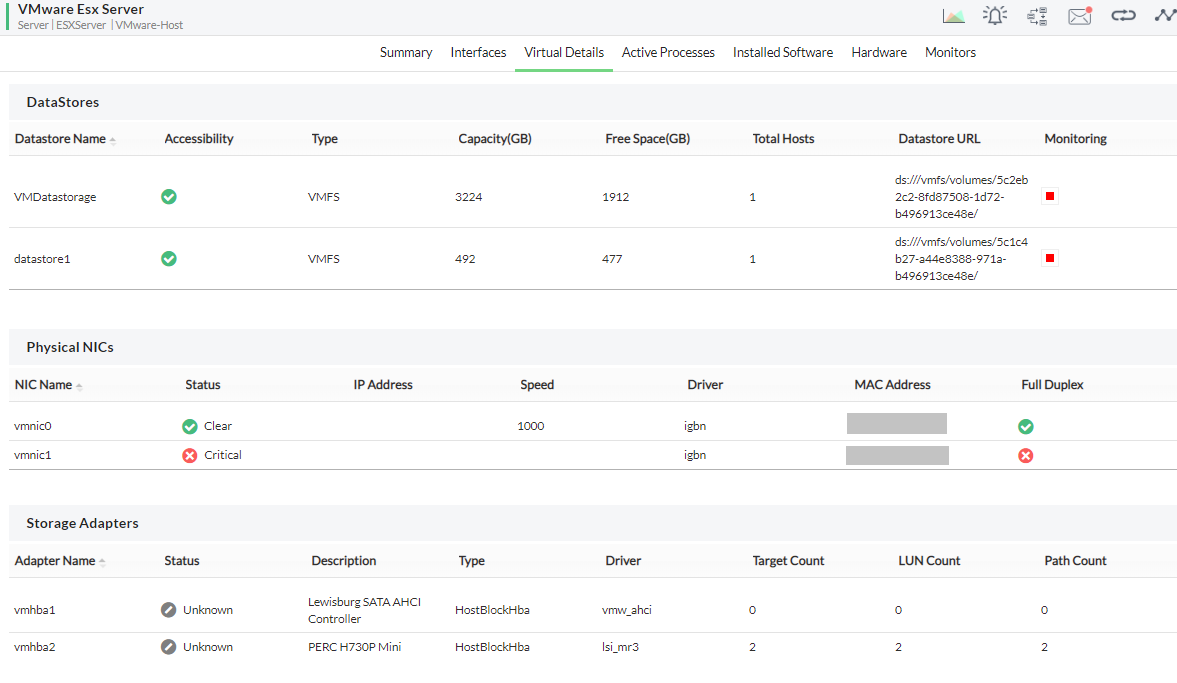
Click on the VM name to see its snapshot page. The snapshot page of the VM is similar to that of any Windows or Linux Server's snapshot page. It also displays the VMs virtual details.
To gain in-depth insights into OpManager's VMware monitoring practices, explore the following help documents.
- [Discovering VMware servers](https://www.manageengine.com/network-monitoring/help/vmware-discovery.html)
- [Monitoring VMwares](https://www.manageengine.com/network-monitoring/help/monitoring-vmware-server.html)
- [Configuring Thresholds for VMware Host and VMs](https://www.manageengine.com/network-monitoring/help/vmware-templates.html)
- [Managing VMware Alerts](https://www.manageengine.com/network-monitoring/help/vmware-alerts.html)
- [VM ware fault management](https://www.manageengine.com/network-monitoring/help/vmware-fault-management.html)
- [About VMware templates](https://www.manageengine.com/network-monitoring/help/vmware-templates.html)