Configuring Process Monitors on Windows/Unix Servers & Desktops
OpManager's process monitoring provides out-of-the-box support for monitoring the availability of all the processes running on a Windows or Unix system. Windows systems use WMI and Unix systems use CLI to monitor the processes that are running on a system. We also support SNMP and Agent in the Server/ Desktop and Domain Controller categories.
Associating process monitors
A process monitor can be associated to a device in one of the following ways.
From process monitor settings page
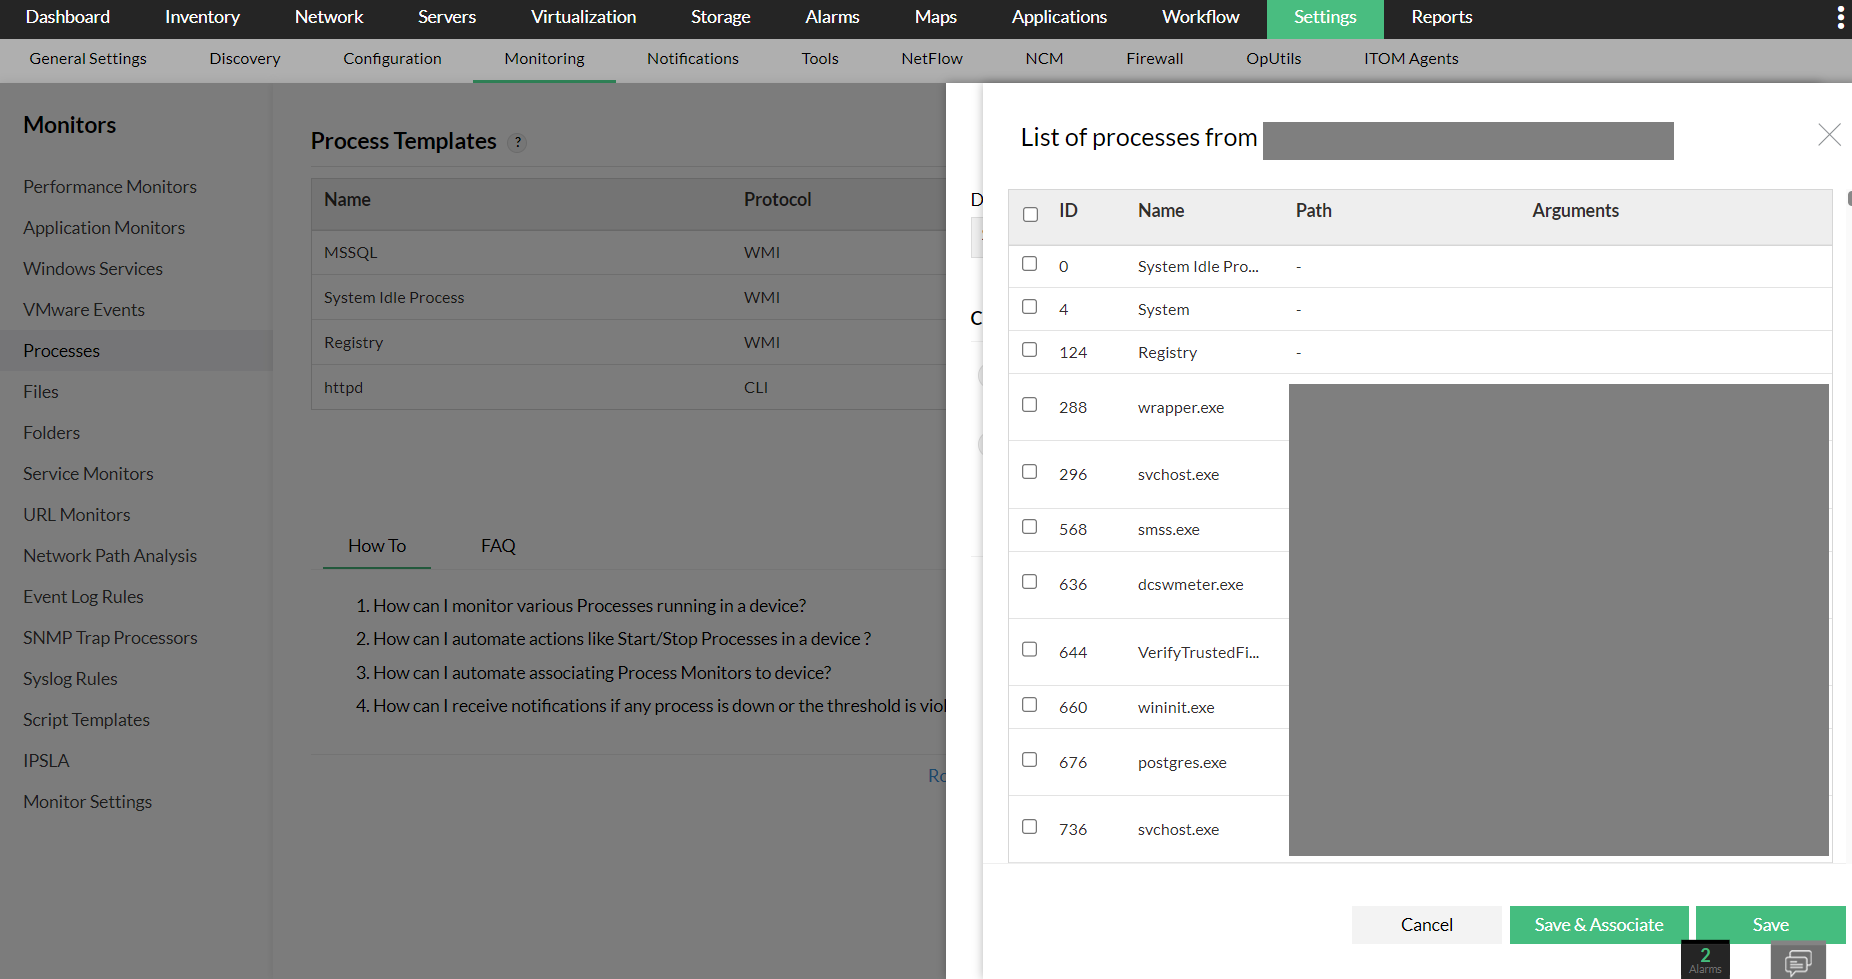
- Go to Settings → Monitoring → Processes and click on the "Add" button at the top right corner. You can also associate existing monitors to devices by selecting the "Associate" button.
- Now, select the device name, and the corresponding credentials and protocol.
- A list of available processes will be displayed. You can select the required processes and click on the "Save" or "Save and Associate" option.
From device snapshot page
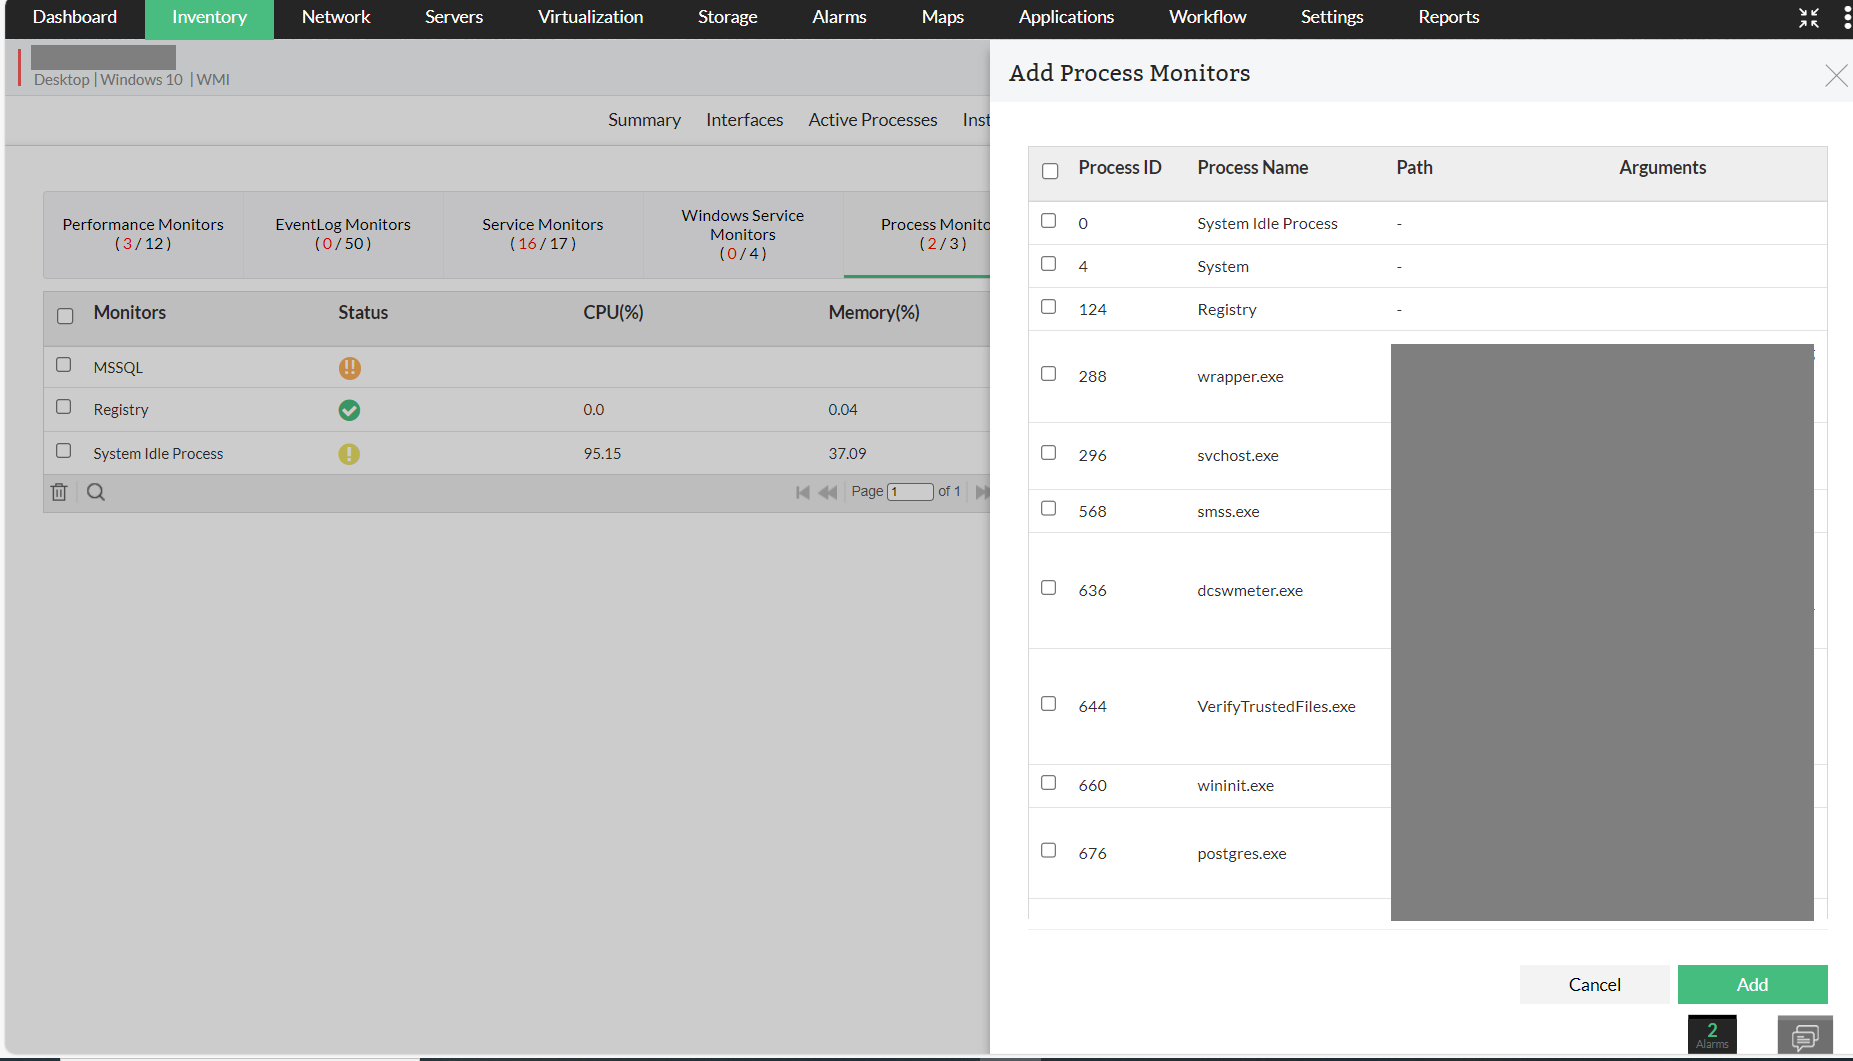
- Navigate to Inventory → Devices and then click on a device to open its snapshot page.
- Ensure that you have associated the SNMP/WMI/CLI Credentials or an Agent to the device.
- Click Monitors → Process Monitors. You can also use the Associate option to link existing process monitors to the device.
- Click Add Monitor, select the required Process Monitors and click Add at the bottom of the page to get these monitors associated to the device.
Configuring thresholds
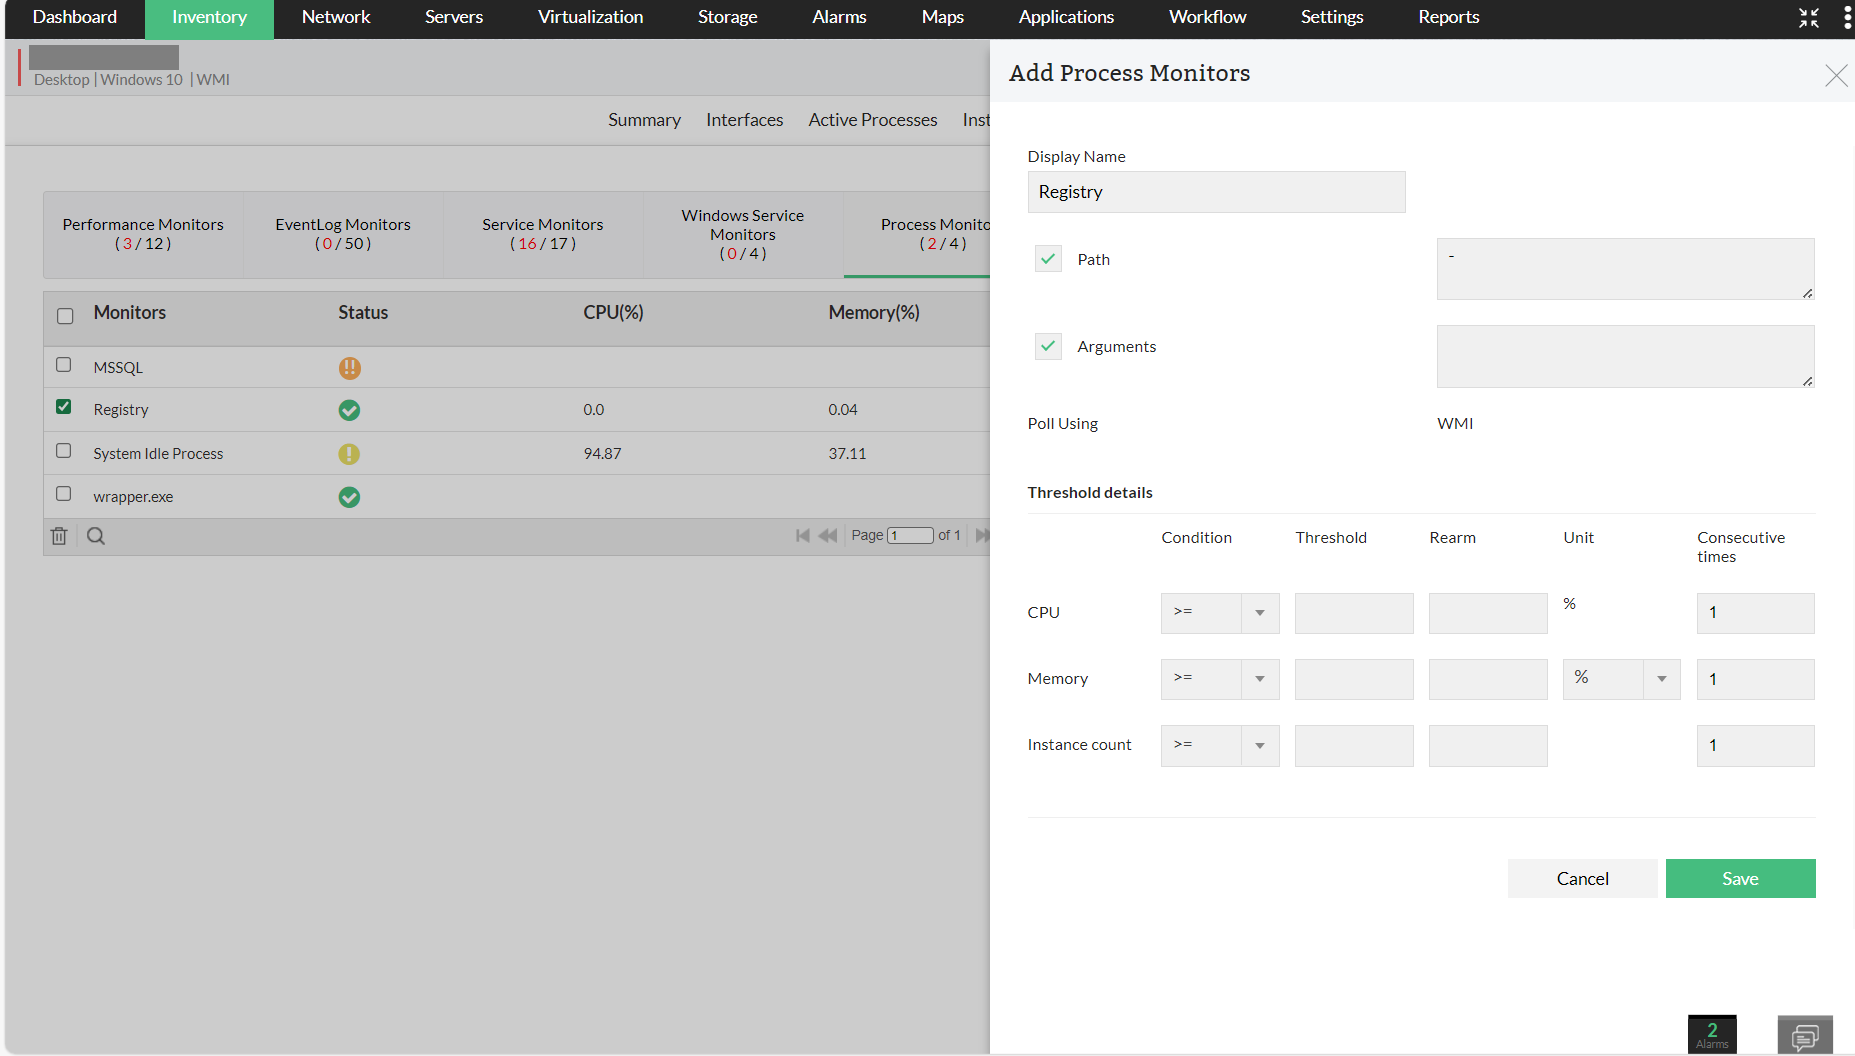
You can set resource thresholds for the Process Monitor. Once a resource utilization or the number of process instances exceeds the configured threshold, an alert is triggered.
- Thresholds can be configured from the device snapshot page or the process monitor settings page. In the device snapshot page, head to the monitors tab, go to the process monitors section, and click on the Edit icon against the process name. In the settings page, go to Settings → Monitoring → Processes and click on the Edit icon against the process name.
- Configure the threshold values for CPU and Memory resources.
- Configure the number of process instances, exceeding which you would like to be notified. For instance, if you would like to be notified if the number of Apache.exe instances on the monitored device exceeds 3, configure the value here as 3 and save the changes.
- Configure the number of times you would like to allow threshold violation before being notified. For instance, if you configure the value as 3, OpManager will notify you if the resource threshold is violated 3 consecutive times.
Alerts are triggered based on the above settings.
You can also view active processes on a device and process diagnostics against a system resource. We currently support active processes for SNMP/WMI/CLI/Agent protocols.