Hitachi storage monitoring software
- RAID & NAS monitoring
- LUN, disk, & volume monitoring
- Hitachi VSP monitoring
- Capacity monitoring & forecasting
- AI-driven storage monitoring

Trusted by over 15,000 happy customers globally
Hitachi storage monitoring in OpManager
OpManager's storage monitoring capabilities can help you optimize the performance of your Hitachi storage arrays (RAIDs), NAS systems, and storage disks. OpManager uses storage APIs and network protocols like SNMP to monitor the uptime, health, and key performance indicators (KPIs) of your Hitachi storage devices. With colour-coded alarms and multi-channel notifications, you'll be alerted of storage issues instantly.
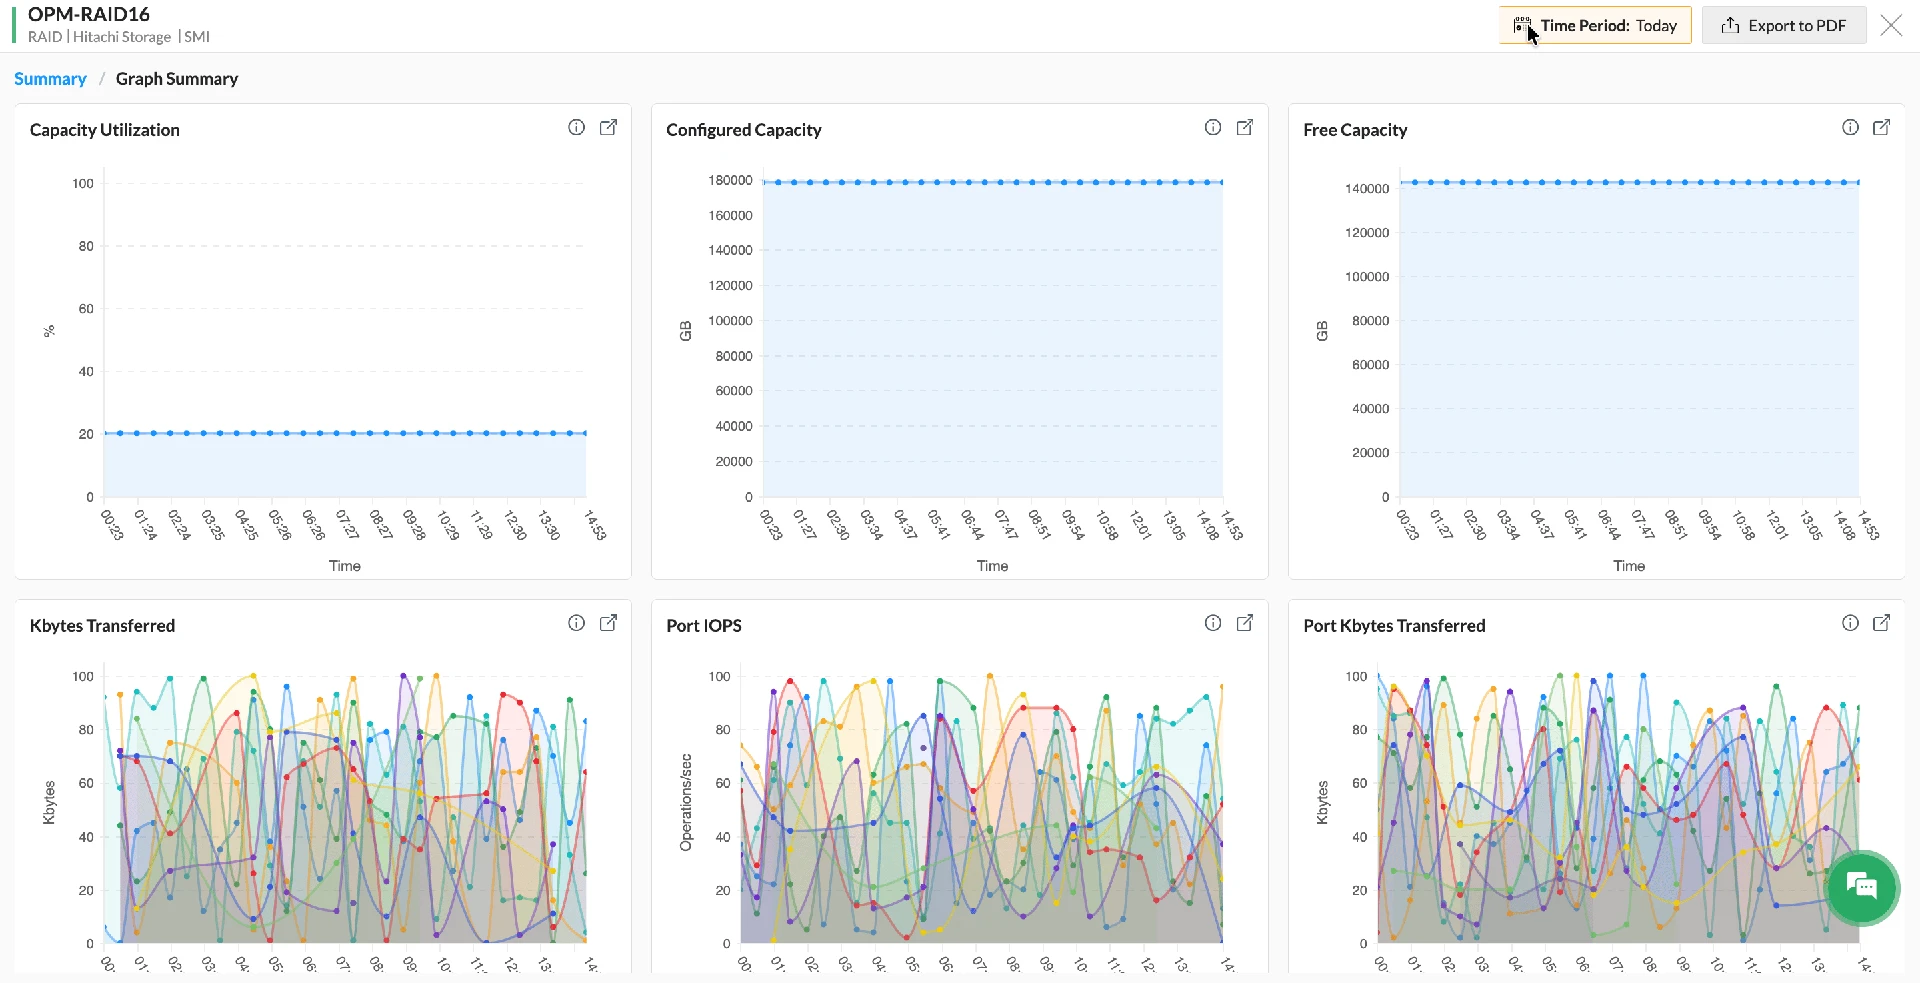
Storage capacity
Track metrics like: Configured capacity, capacity utilization, free capacity, and total capacity to monitor storage array capacity.
Storage operations
Monitor storage operations like IOPS (Input/output operations), reads and writes. You can monitor IOPS at the storage array (RAID) level, port level, or the volume level.
Traffic utilization
Track the traffic transferred at the storage array (RAID) level, port level, and the volume level to detect potential issues and abnormalities.
LUNs, volumes, and storage pools
Monitor storagepools, volumes, and LUNs. Track the capacity of each storagepool and volume and optimize resource allocation for your storage arrays.
Storage disks
Keep tabs on the SSD, HDD, and NVMe disks used in your RAID arrays with insights into the status and storage capacity of each disk.
Hardware and RAIDs
Monitor RAID controllers, ports, fans, sensors, power supply, and temperature to ensure that you're not caught off-guard by hardware issues.
Extensive support for Hitachi storage systems
OpManager features pre-built templates for Hitachi’s most popular storage solutions, allowing you to initiate monitoring for your Hitachi devices quickly and with minimal manual setup. Let's take a look at some of the popular Hitachi devices supported by OpManager:
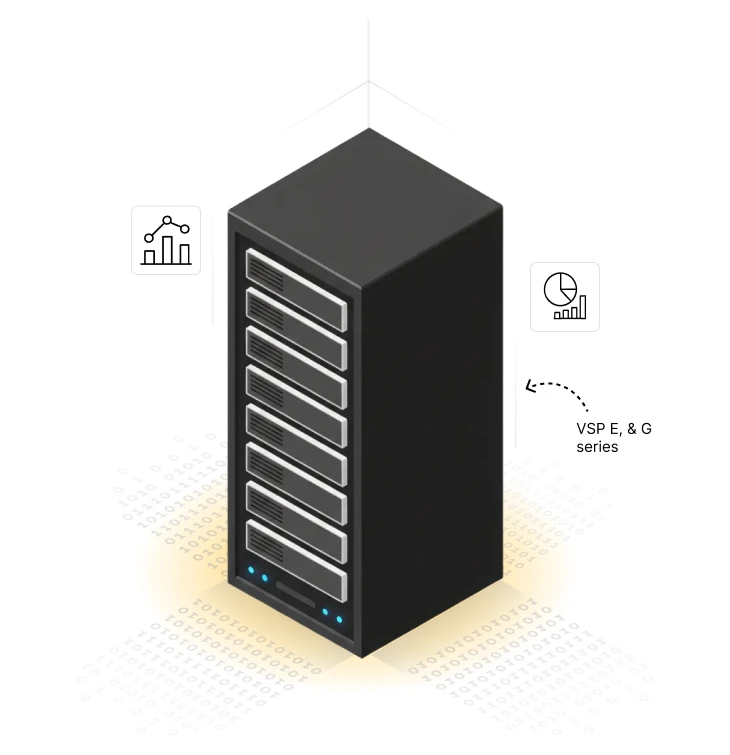
Monitoring Hitachi's virtual storage platform devices (VSP)
- Monitor VSP E series, VSP G series, and AMS trays out-of-the-box
- Monitor IOPs and traffic utilization at the storage array (RAID) level, port level, and volume level to stay updated about storage operations
- Track storage capacity and leverage OpManager's in-built ML engine to forecast storage capacity utilization for the future
- Leverage dedicated storage reports to analyze storage utilization and performance
- Keep a close watch on Hitachi VSP devices with dedicated storage dashboards
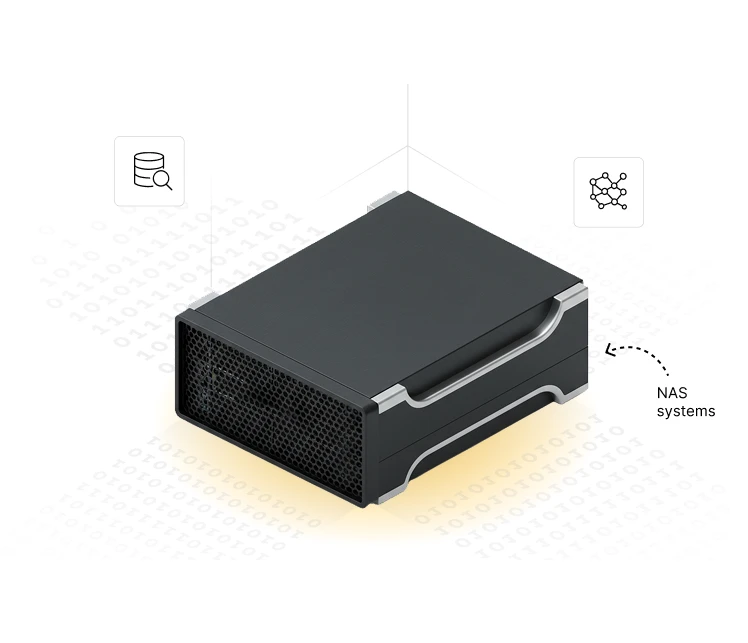
Monitoring Hitachi's network attached storage devices (NAS)
- Monitor Hitachi's NAS and HNAS systems out-of-the-box
- Track the status of storage ports and monitor throughput across port connections
- Monitor nodes and filesystems associated with your NAS systems
- Leverage OpManager's automated layer2 maps and organization maps to track the network topology associated with your NAS systems
- Track the reponse time and packet loss of your network nodes to ensure seamless data transport beetween your users and your NAS systems
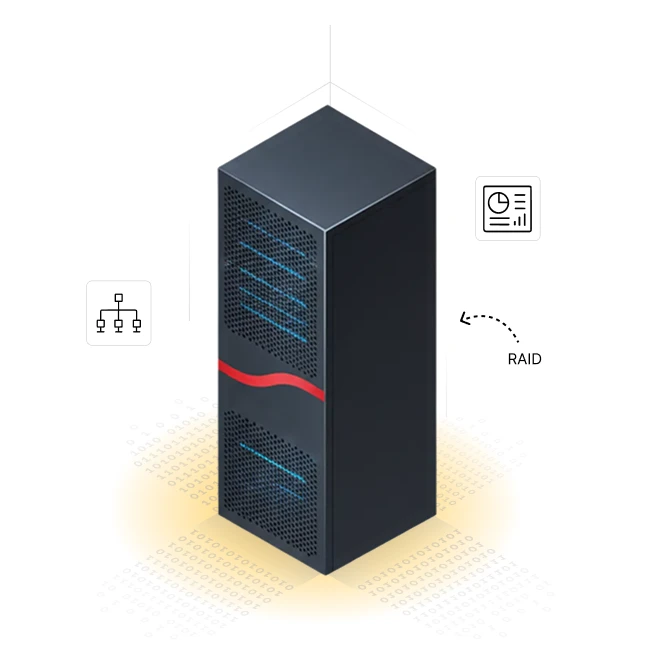
Monitoring legacy Hitachi Lightning and Thunder RAID devices
- OpManager offers out-of-the-box support for Hitachi's legacy RAIDs like Lightning and Thunder
- Track storage array (RAID) capacity to stay on top of storage utilization trends
- Prevent unexpected resource crunches with OpManager's ML-powered storage forecasting
Hitachi monitoring in OpManager: A walkthrough
Discovery & classification
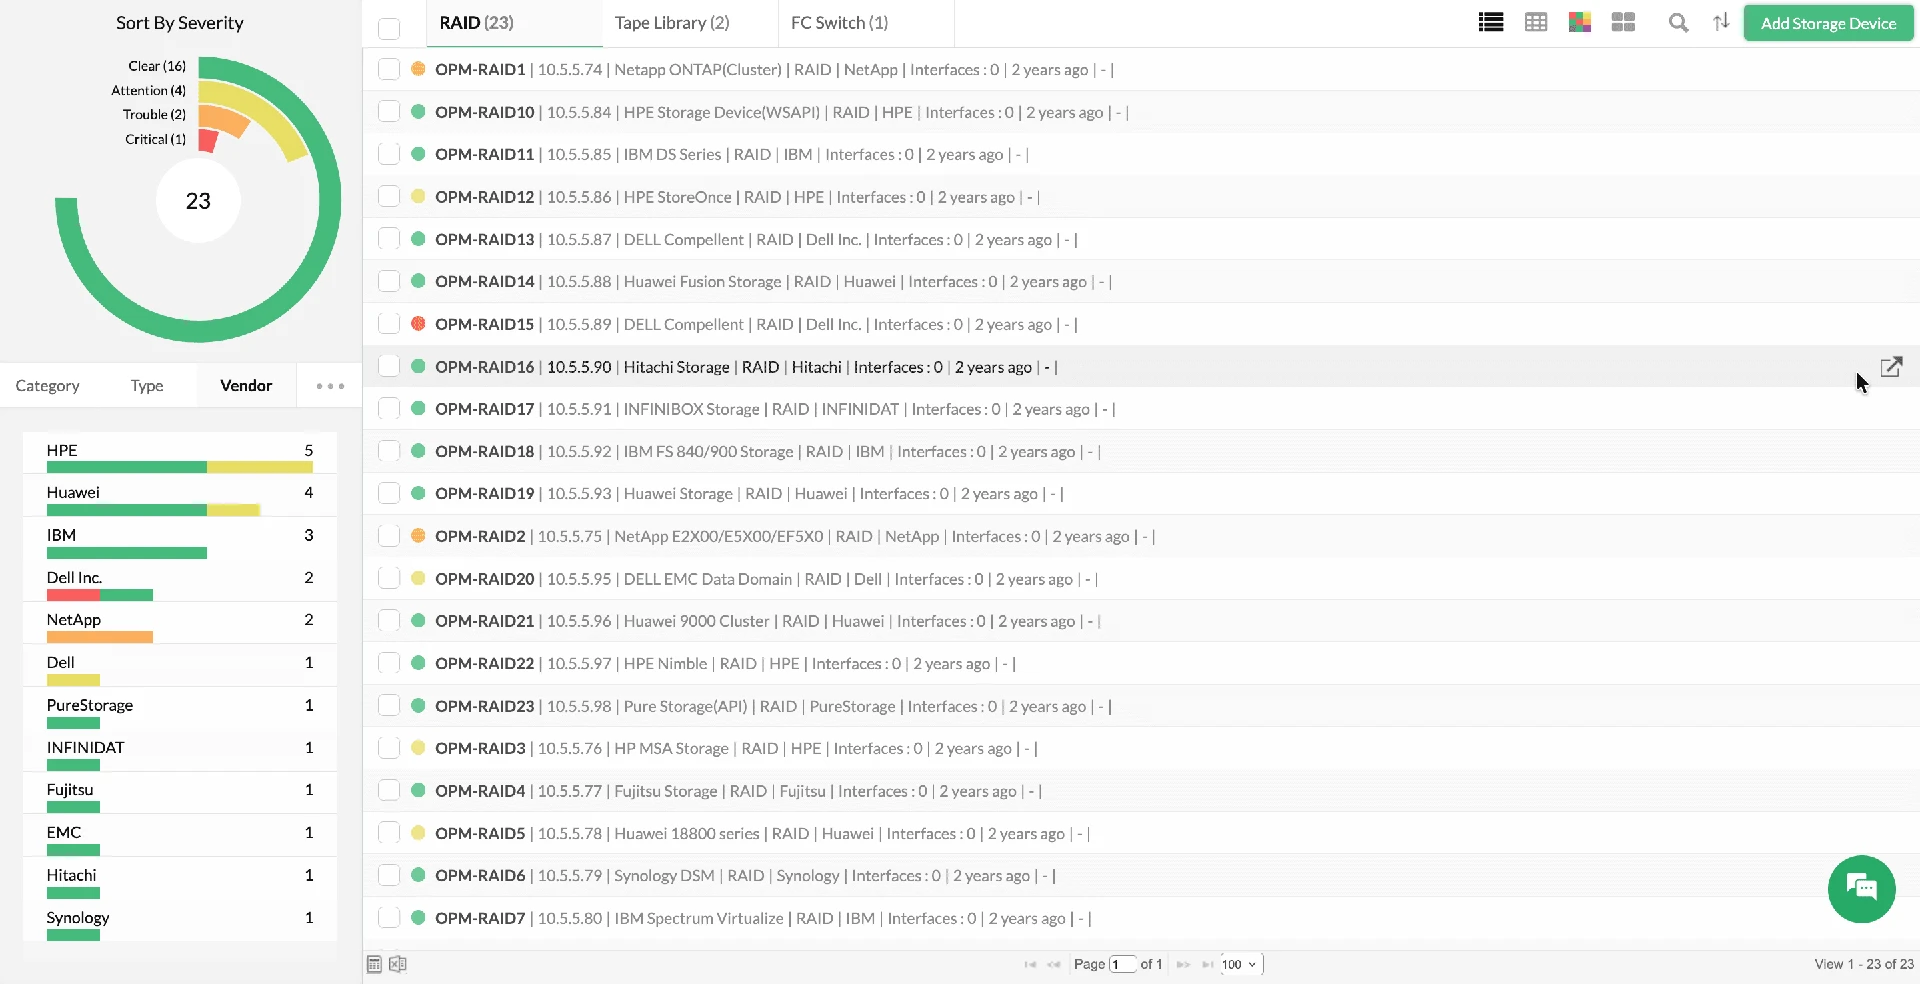
OpManager automates the process of classifying the devices in your network with 11,000+ device templates. When you discover a Hitachi device with OpManager, it identifies the type of device, the vendor, and the model, and classifies it within its well-defined monitoring inventory.
In addition to this, OpManager also curates relevant performance and storage metrics for this devices and lists them so that you can start monitoring them with a few clicks.
Performance monitoring
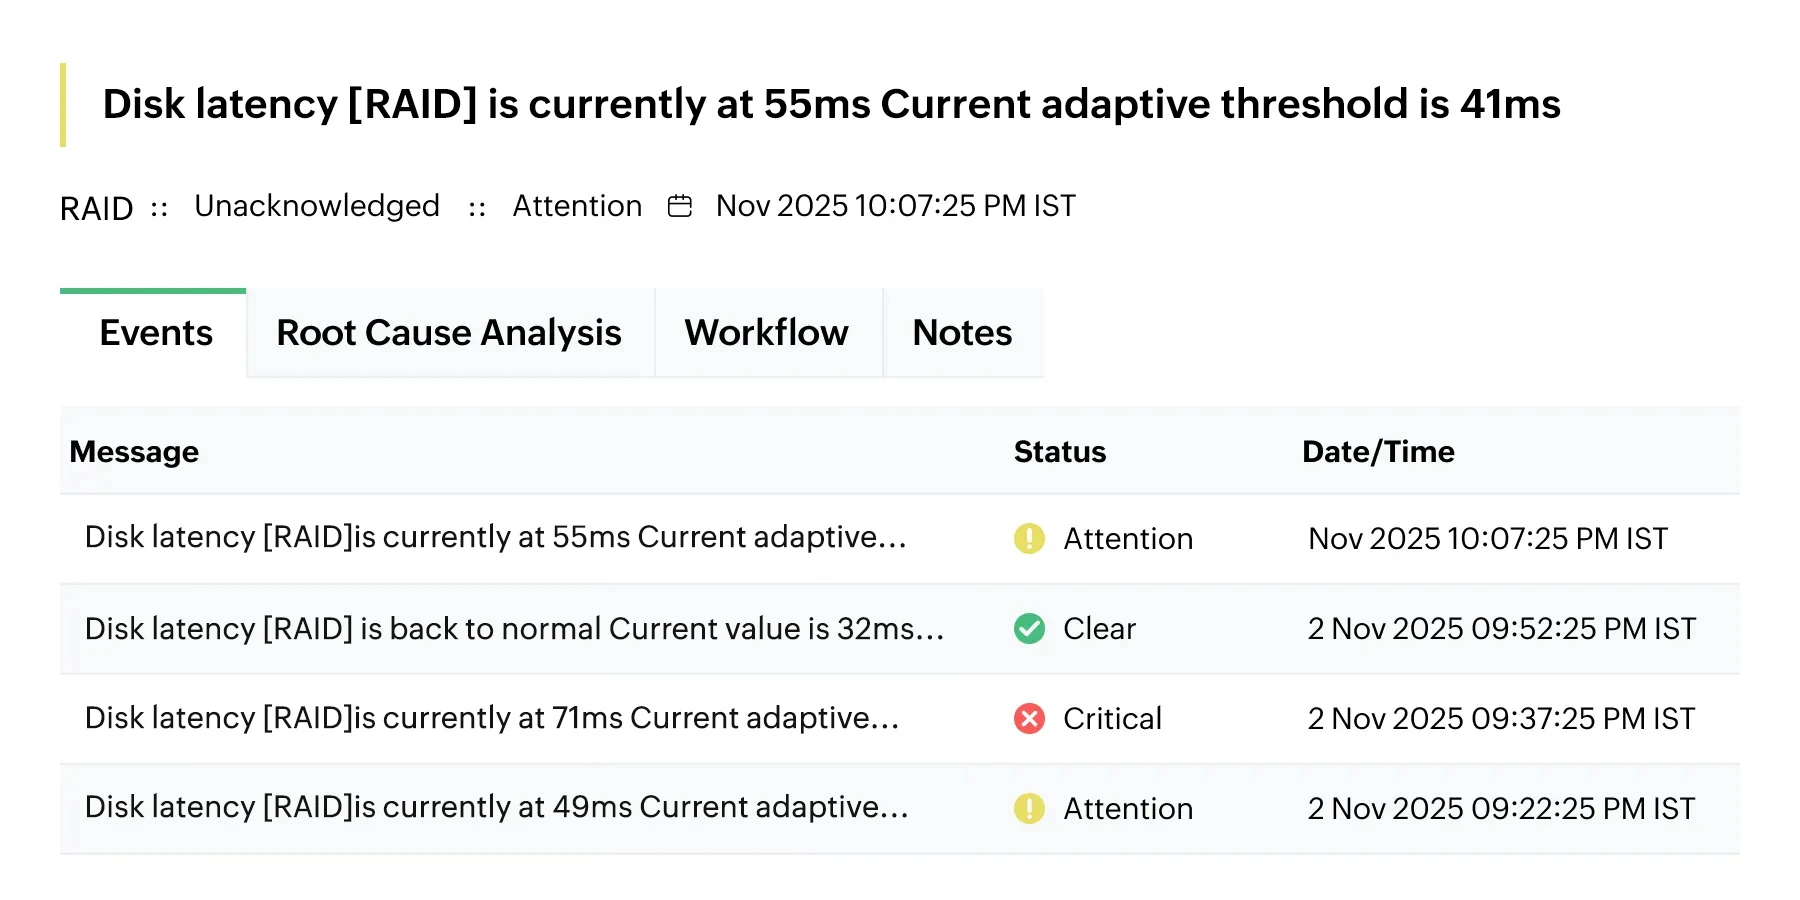
OpManager uses colour-coded graphs and multi-level alarm thresholds to monitor key performance indicators for your Hitachi devices. These thresholds can be set manually or be calculated and updated automatically with OpManager's ML-powered adaptive thresholds.
When thresholds are violated, you get instant alarms specifying the source and nature of the issue.
Fault identification
OpManager simplifies the management of Hitachi's storage systems and their complex dependencies with its powerful mapping features. To streamline troubleshooting, you can also leverage the root cause analysis feature to overlay monitored graphs, making it easy to correlate metrics and pinpoint issues within your Hitachi ecosystem.
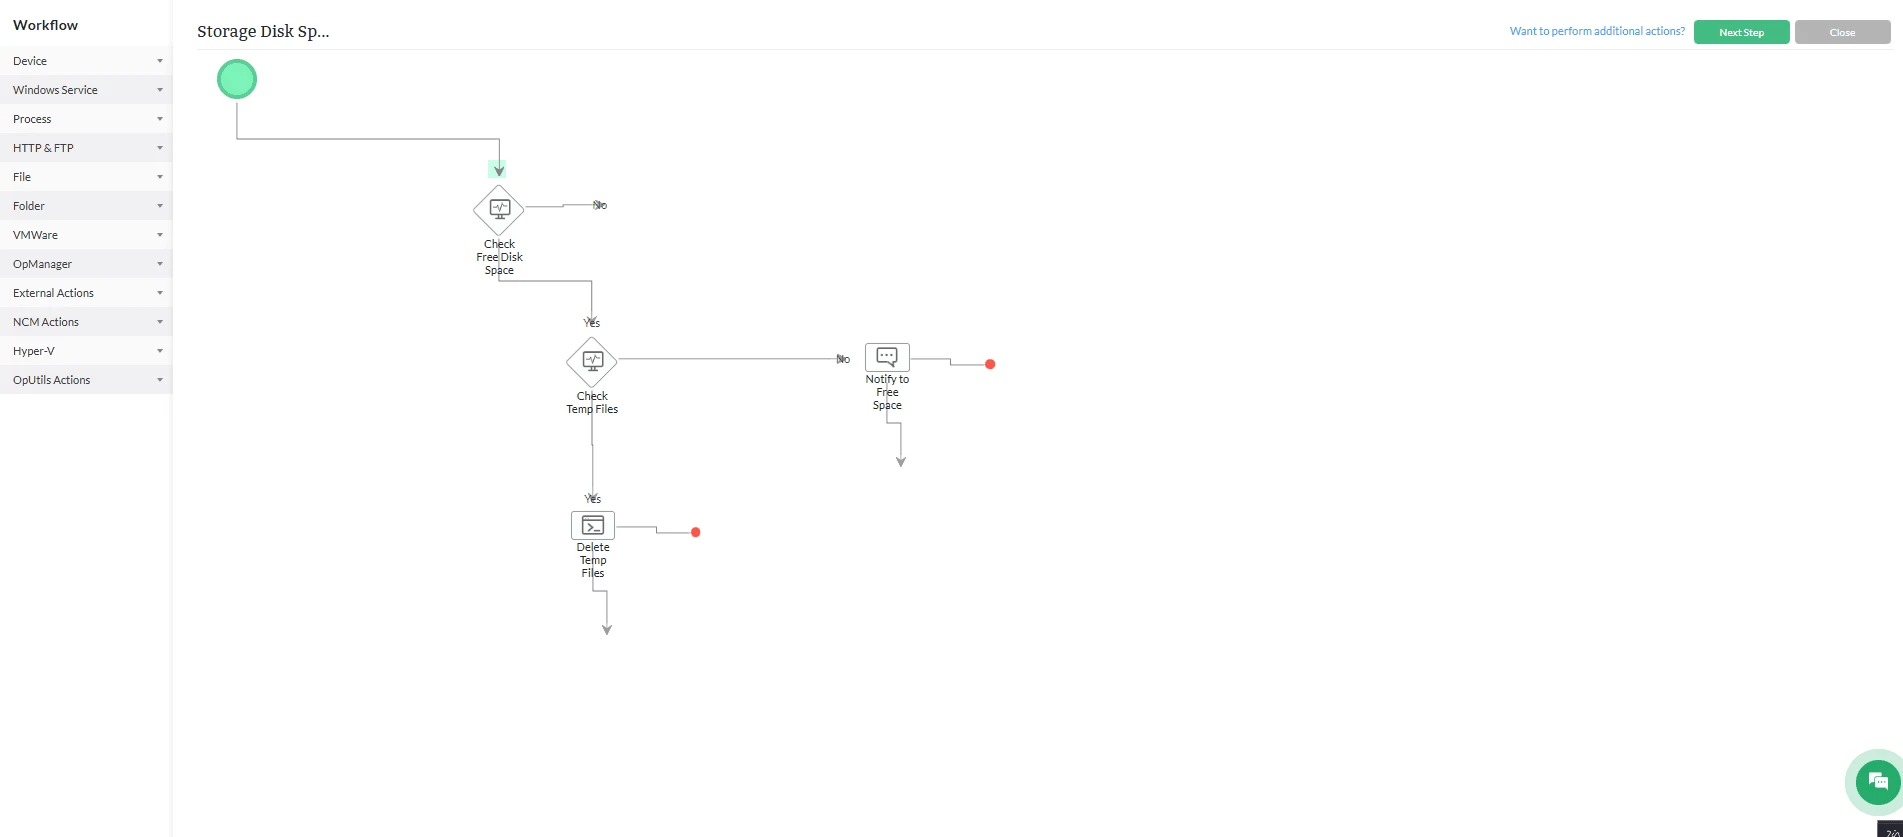
Automated workflows
OpManager’s Workflows allow you to create automated responses through a code-free, drag-and-drop interface featuring more than 70 sequential actions. These workflows are ideal for complex troubleshooting and remediation; for example, if a Hitachi device triggers a "low storage capacity" alarm, a workflow can automatically launch a script to remediate the storage issue without manual intervention.
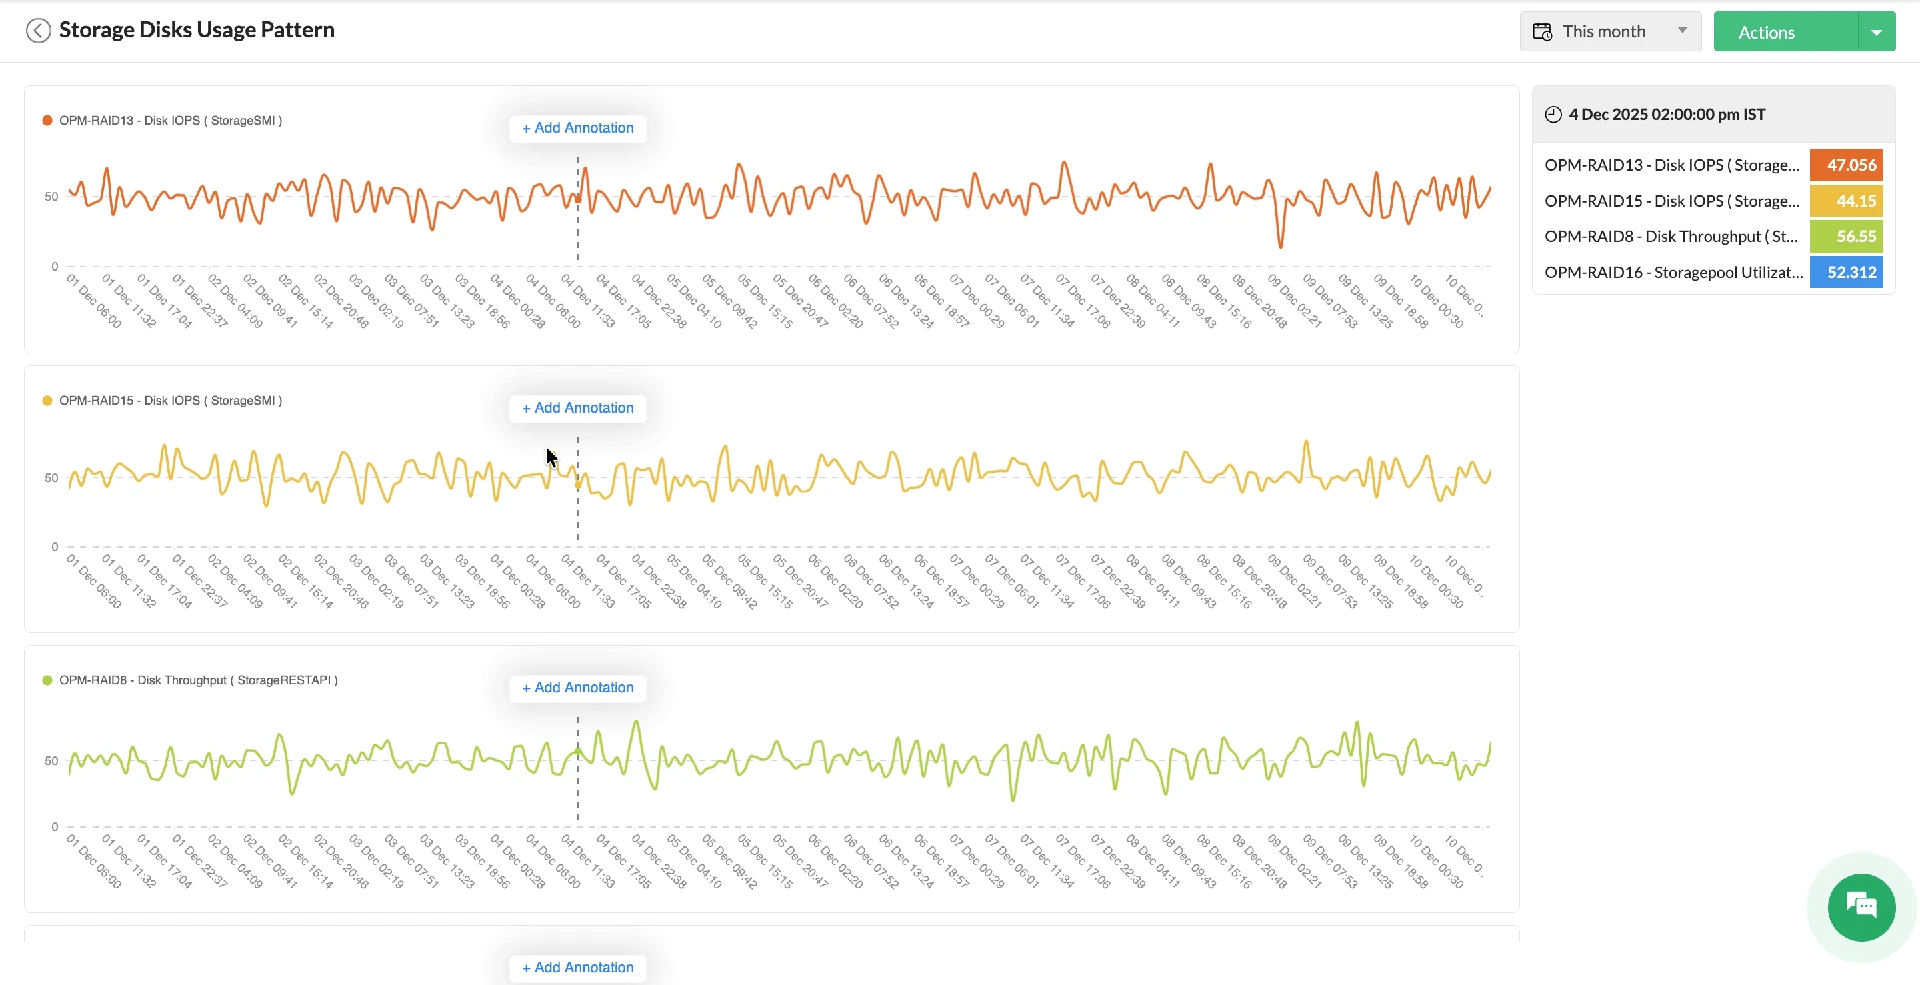
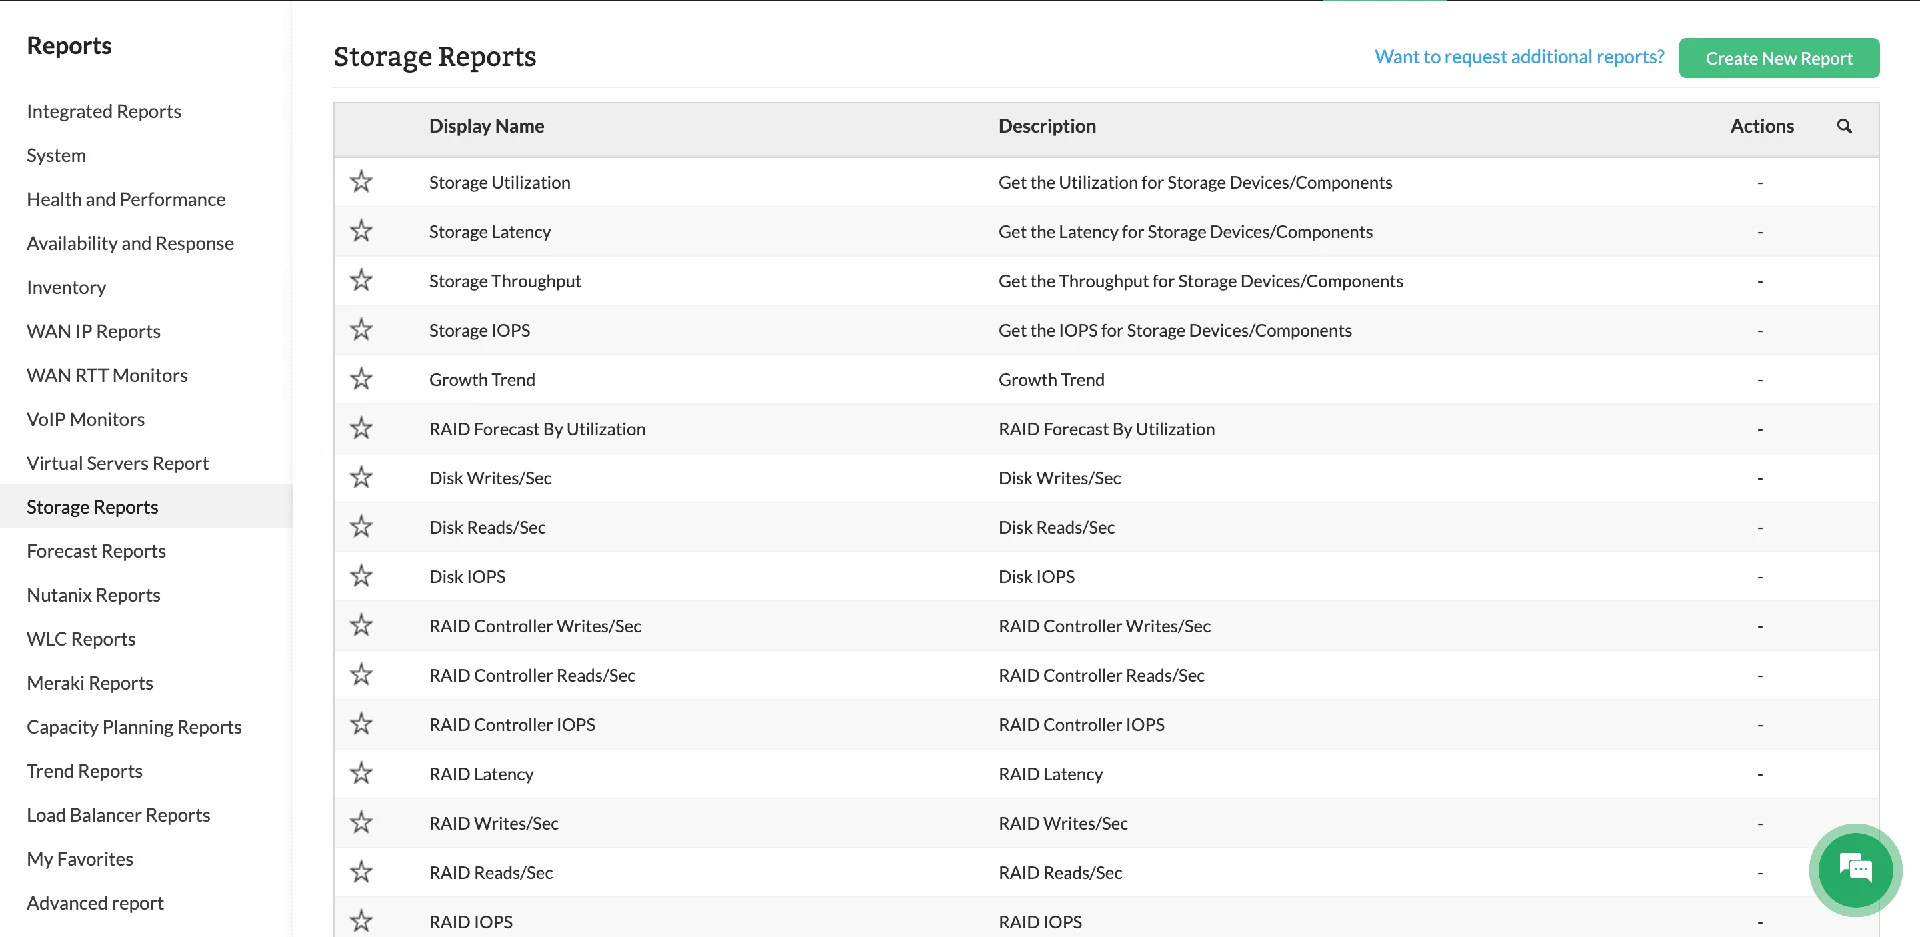
Reports and dashboards
To ensure you can analyze storage performance across your IT infrastructure at all times, OpManager provides 18 dedicated storage reports and a preconfigured storage overview dashboard. Beyond these standard features, you have the flexibility to customize your own reports and dashboards using any available metrics, graphs, and widgets.
ML-driven monitoring for Hitachi storage systems
Calculate, set, and update alarm thresholds with ML
OpManager’s integrated ML engine continuously collects performance data to calculate and update alarm thresholds on an hourly basis for all monitored metrics. This significantly reduces the manual effort required to manage thresholds, while simultaneously improving monitoring precision and minimizing false positives.
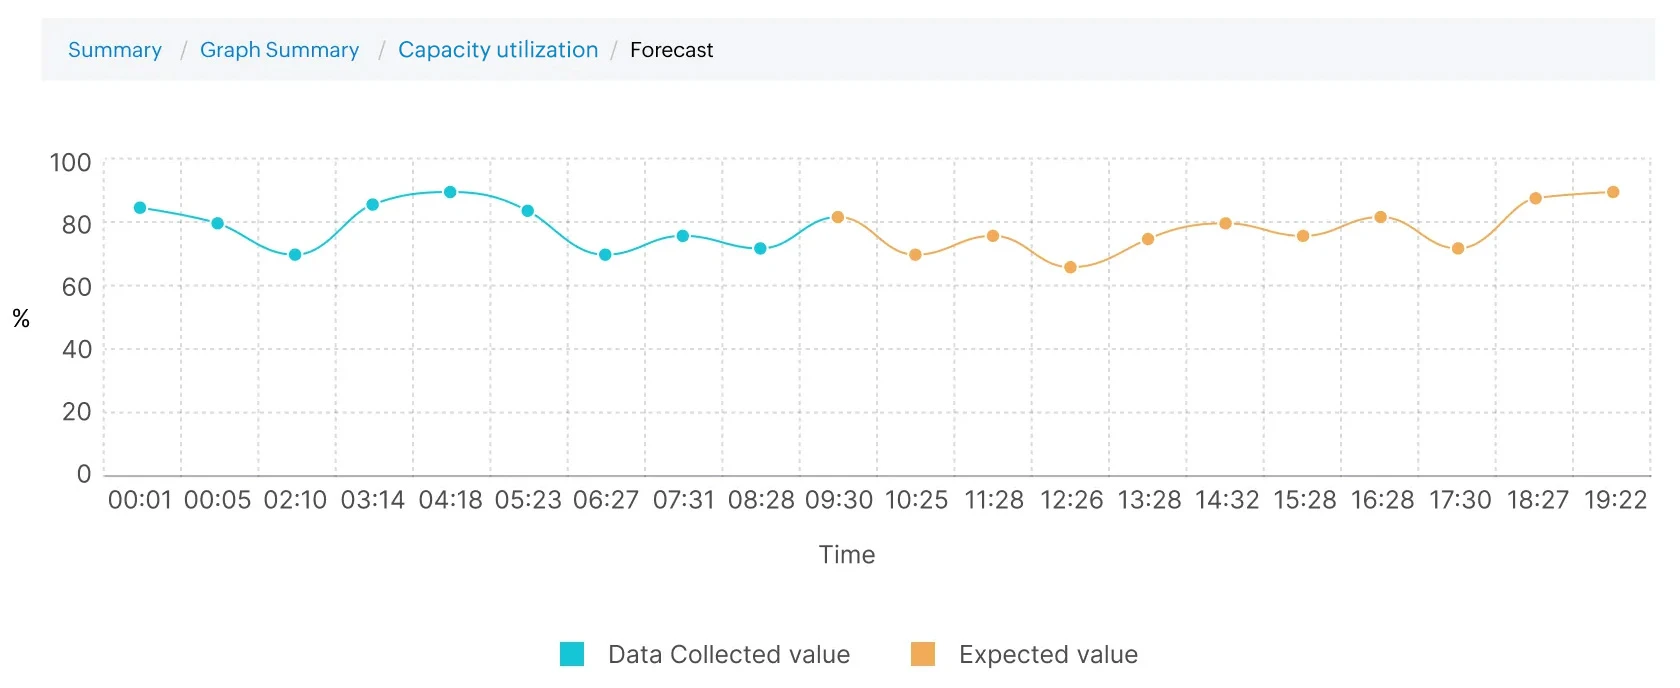
Forecast storage performance trends over time
Leveraging advanced ML algorithms, OpManager forecasts future storage performance trends to help you stay ahead of potential issues. By tracking key metrics such as CPU, memory, and throughput, you can proactively identify bottlenecks, prepare for impending resource crunches, and maintain optimal storage performance.
Predict storage capacity utilization with forecasts
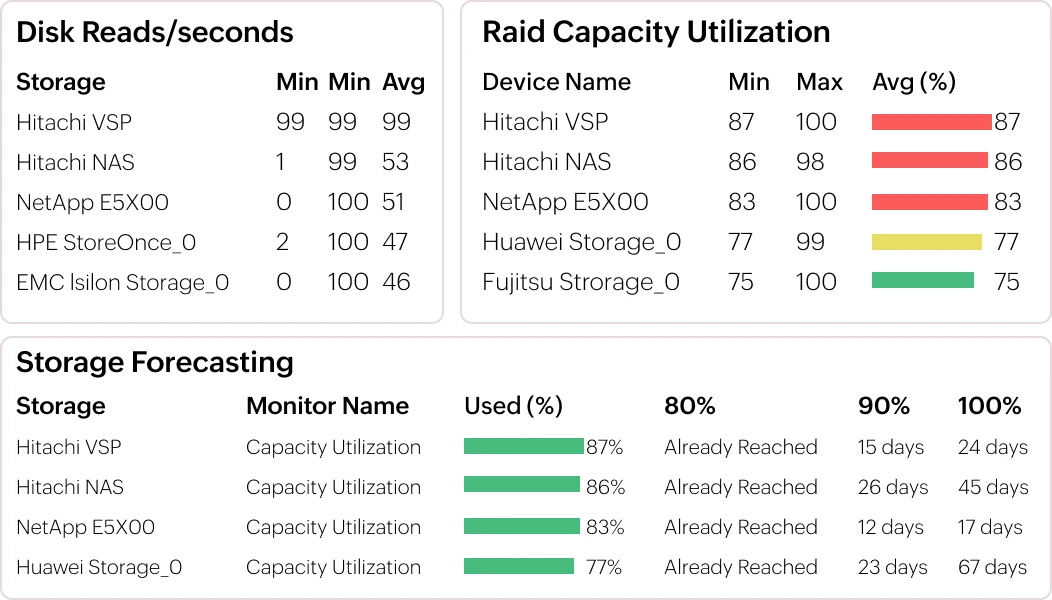
OpManager utilizes dedicated forecast reports to pinpoint devices experiencing high resource utilization. By analyzing metrics like CPU, memory, and disk space, these reports calculate the exact number of days remaining until resource usage reaches critical thresholds of 80%, 90%, and 100%.
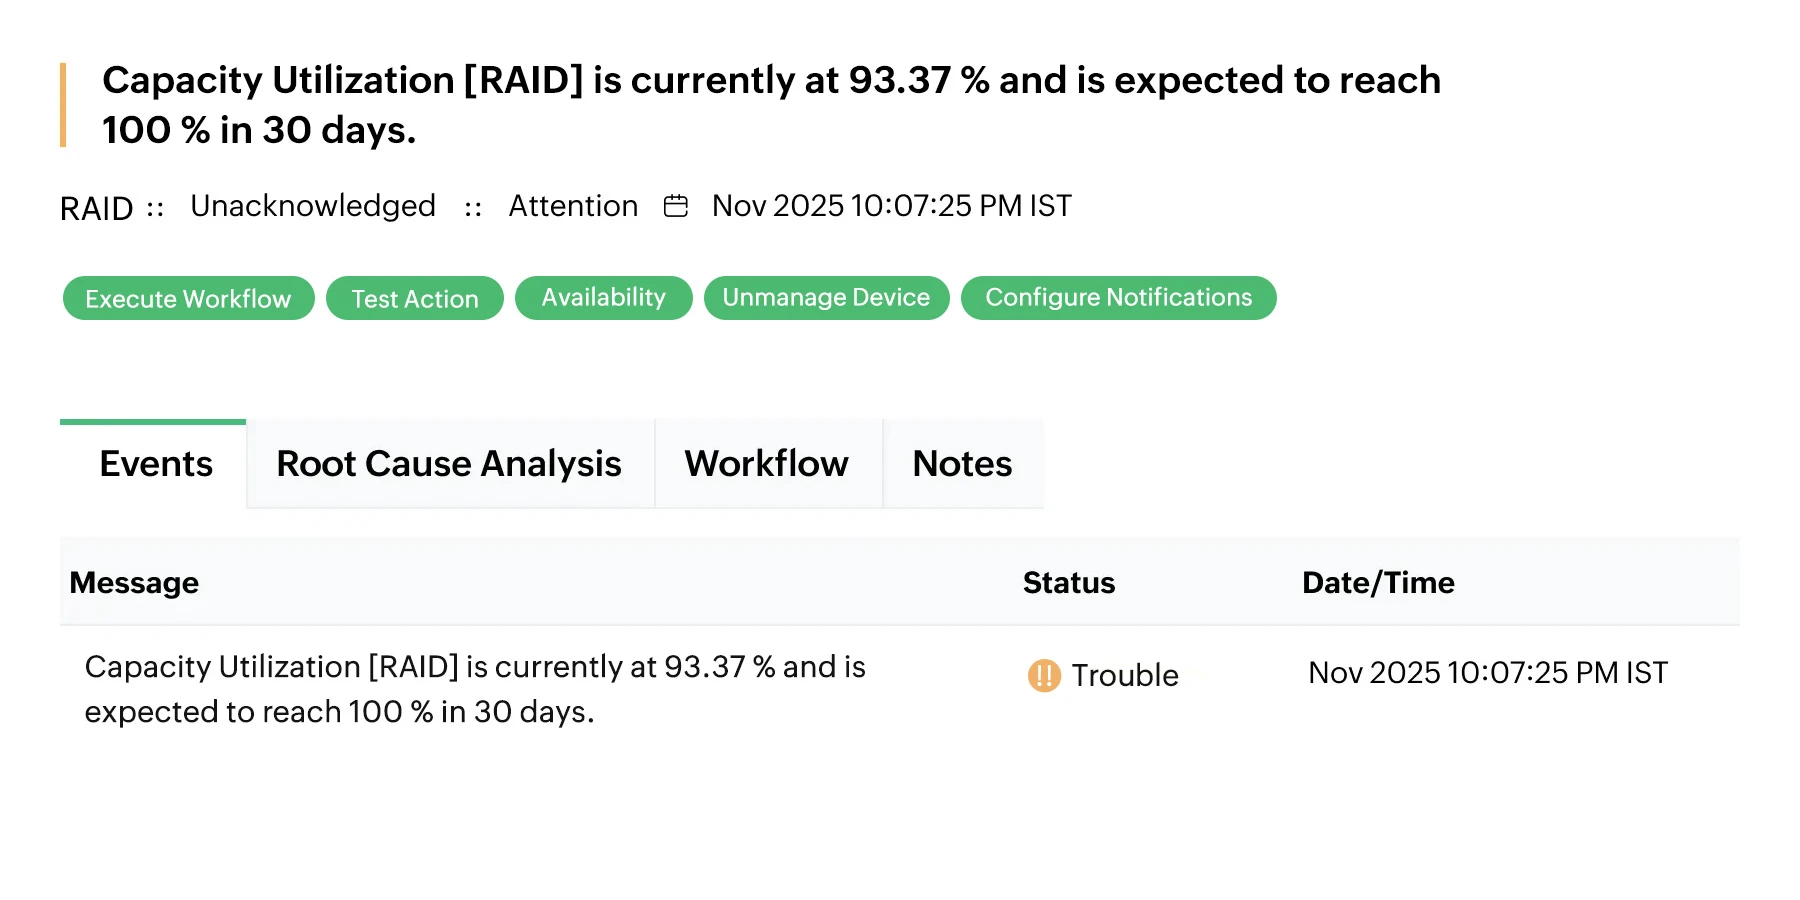
Get proactive alarms for low storage capacity
Proactively manage Hitachi storage capacity by utilizing OpManager’s forecast alarms. These alerts are triggered when predictive analysis indicates that storage capacity is expected to reach a critical utilization limit within a defined timeframe, allowing you to intervene before performance is impacted.
Why choose OpManager for Hitachi monitoring?
Unfolding reasons why 1M+ network admins trust us
Multi-vendor support
OpManager facilitates the seamless integration of Hitachi monitoring into multi-vendor environments, providing a unified and cohesive monitoring experience across your entire infrastructure.
Third-party integration
Enhance your operational efficiency by leveraging integrations with third-party applications, such as help desk and service management tools, to streamline complex network management tasks.
Webhook support
Utilize real-time webhook notifications to ensure an instantaneous and efficient flow of data to external systems, enabling rapid response to critical environmental changes.
Scalability & Flexibility
OpManager is a highly scalable solution designed to adapt to your evolving needs, offering the flexibility to support everything from small-scale deployments to expansive enterprise infrastructures.
Comprehensive storage monitoring software
OpManager extends its support for 25+ storage vendors in the market and provides dedicated KPIs and tracking for diverse device types and models.
Frequently asked questions
Which specific Hitachi storage hardware and platforms can OpManager monitor?
OpManager provides extensive, out-of-the-box support for a wide range of Hitachi systems. This includes the Virtual Storage Platform (VSP) E and G series, Network Attached Storage (NAS and HNAS) systems, and legacy RAID devices such as the Hitachi Lightning and Thunder series. It also monitors specific hardware components like RAID controllers, ports, fans, power supplies, and temperature sensors.