Power ServiceDesk Plus ITSM workflows with proactive monitoring
20+
Years of Experience
4.4
Customer Rating
1M+
Trusted Admins

OpManager stands out from other monitoring solutions with its extensive monitoring capabilities and automation. For any IT system in the network and infrastructure layers, OpManager automates discovery, classification, monitoring, notifications, and first-level troubleshooting. OpManager also incorporates an in-built AI-engine to refine alarm floods provide crisp-executable insights.
When integrated with ServiceDesk Plus, OpManager updates alarms, metrics, and device-CI relationships in your ITSM console.
Why wait until your end users notice any issues to raise tickets on Service Desk Plus? OpManager detects faults proactively before it can affect your users. When you integrate OpManager with Service Desk Plus, You can leverage OpManager's features to log tickets automatically. Service Desk Plus's Business Rules automatically assigns them to the right team of technicians, automating service request process without involving the users.
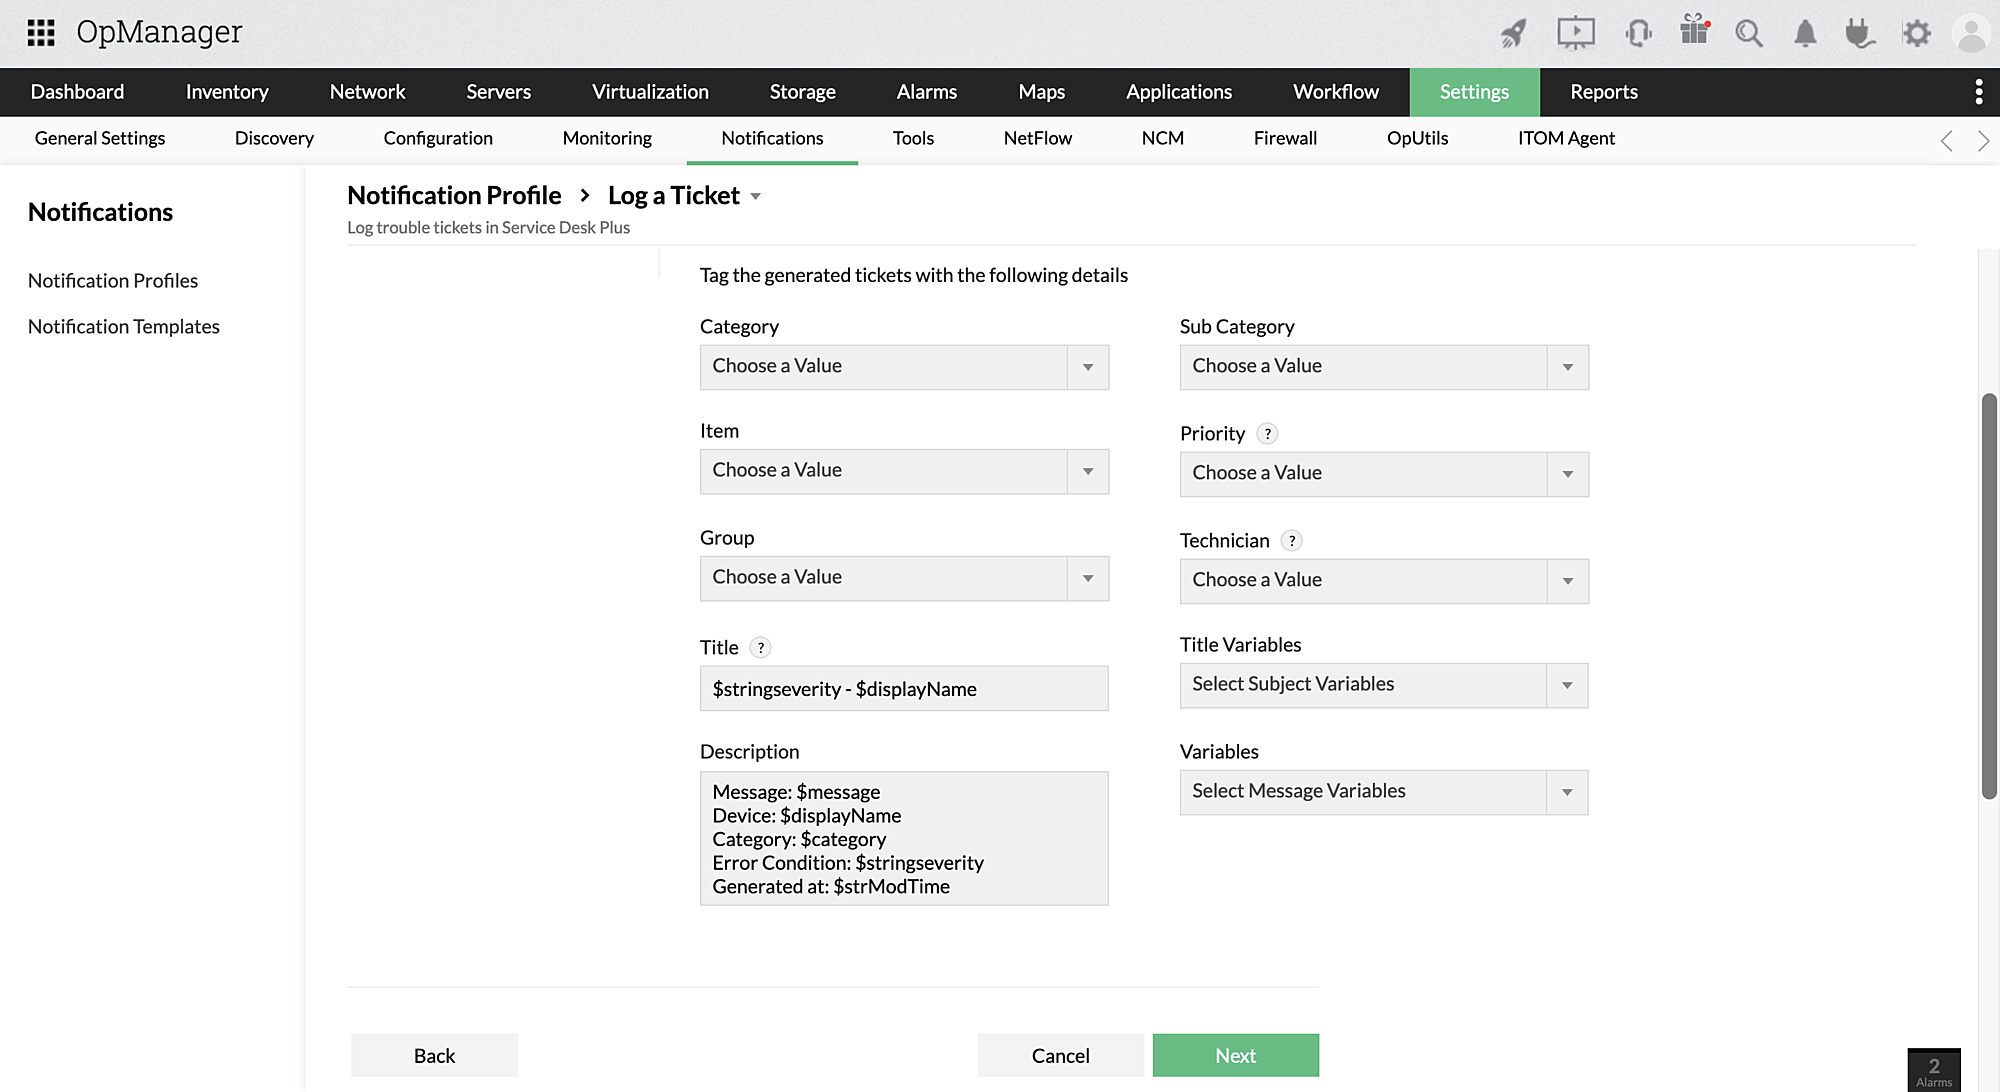
You can configure a notification profile to log tickets on SDP. Once applied to a device or a group of devices, OpManager will log a ticket for these devices when the required criteria is met. Notification profiles contain information like ticket priority, department, and severity which lets Service Desk Plus assign it to the right technician. There's also an option to directly assign it to a given technician.
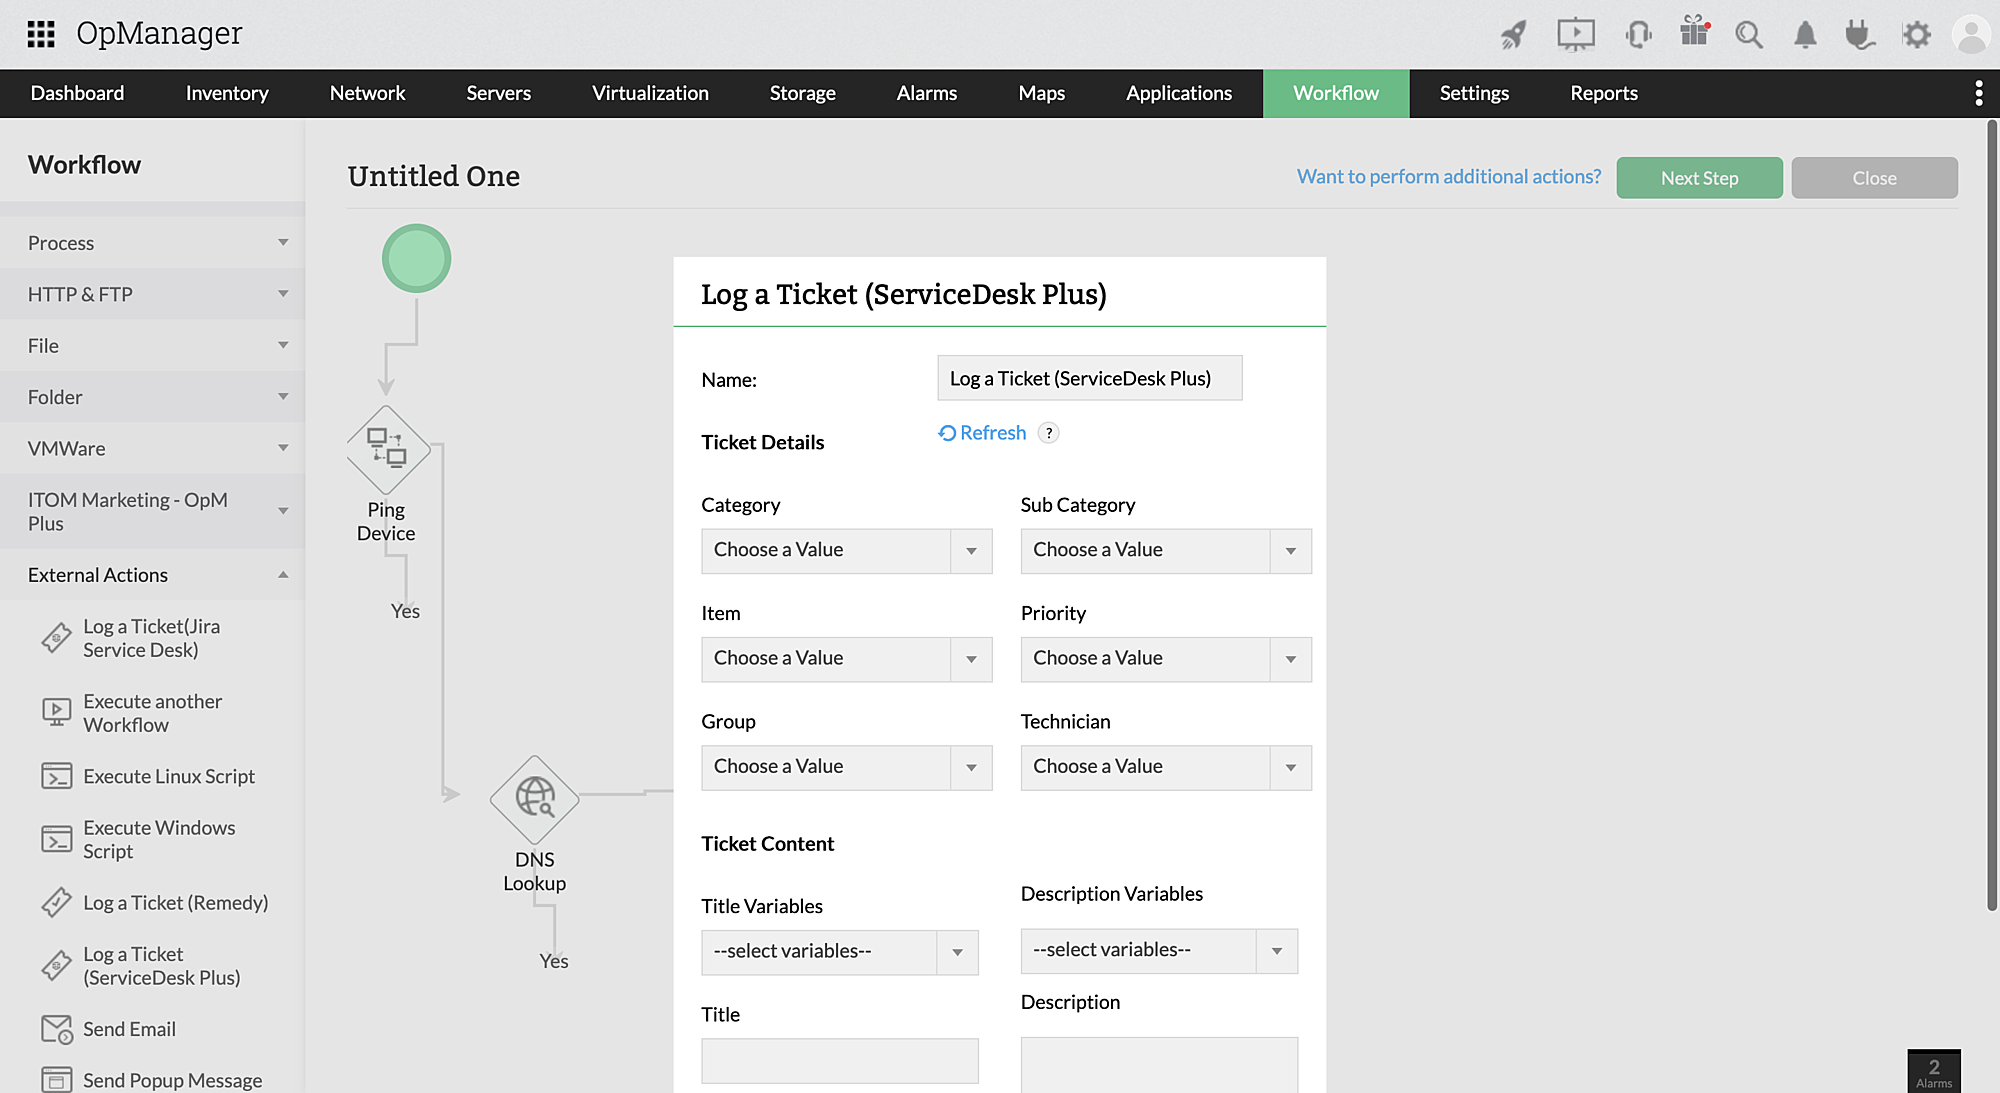
OpManager's automated workflows include a drag and drop workflow builder where users can automate troubleshooting activities. One of the options is to log tickets with Service Desk Plus. Users can leverage Workflows to perform basic troubleshooting first and if the issue is still not resolved- log tickets on Service Desk Plus.
Any changes in alert parameters- like severity are automatically updated on the ticket in Service Desk Plus. This allows your network technician to keep track of changing situations and review alert history. Moreover, when an alert is cleared on OpManager, the corresponding ticket is closed, and when the ticket is closed- the alert gets cleared. There is also an option to reopen closed tickets when an issue reoccurs.
Your technicians should be aware of the devices in your IT inventory and the relationships between different devices. This lets them asses the impact of one asset on others related to it. If the devices relationships are known, they can plan out maintenance and troubleshooting actions with minimal disruptions for other activities.
Keep your CMDB updated with OpManager's automated device discovery and classification. OpManager runs scans, adds new devices, and removes decommissioned devices from the monitoring inventory. Details like device name, model, metadata, and relationships are also updated automatically. By syncing OpManager with ServiceDesk Plus, CMDB management is simplified.
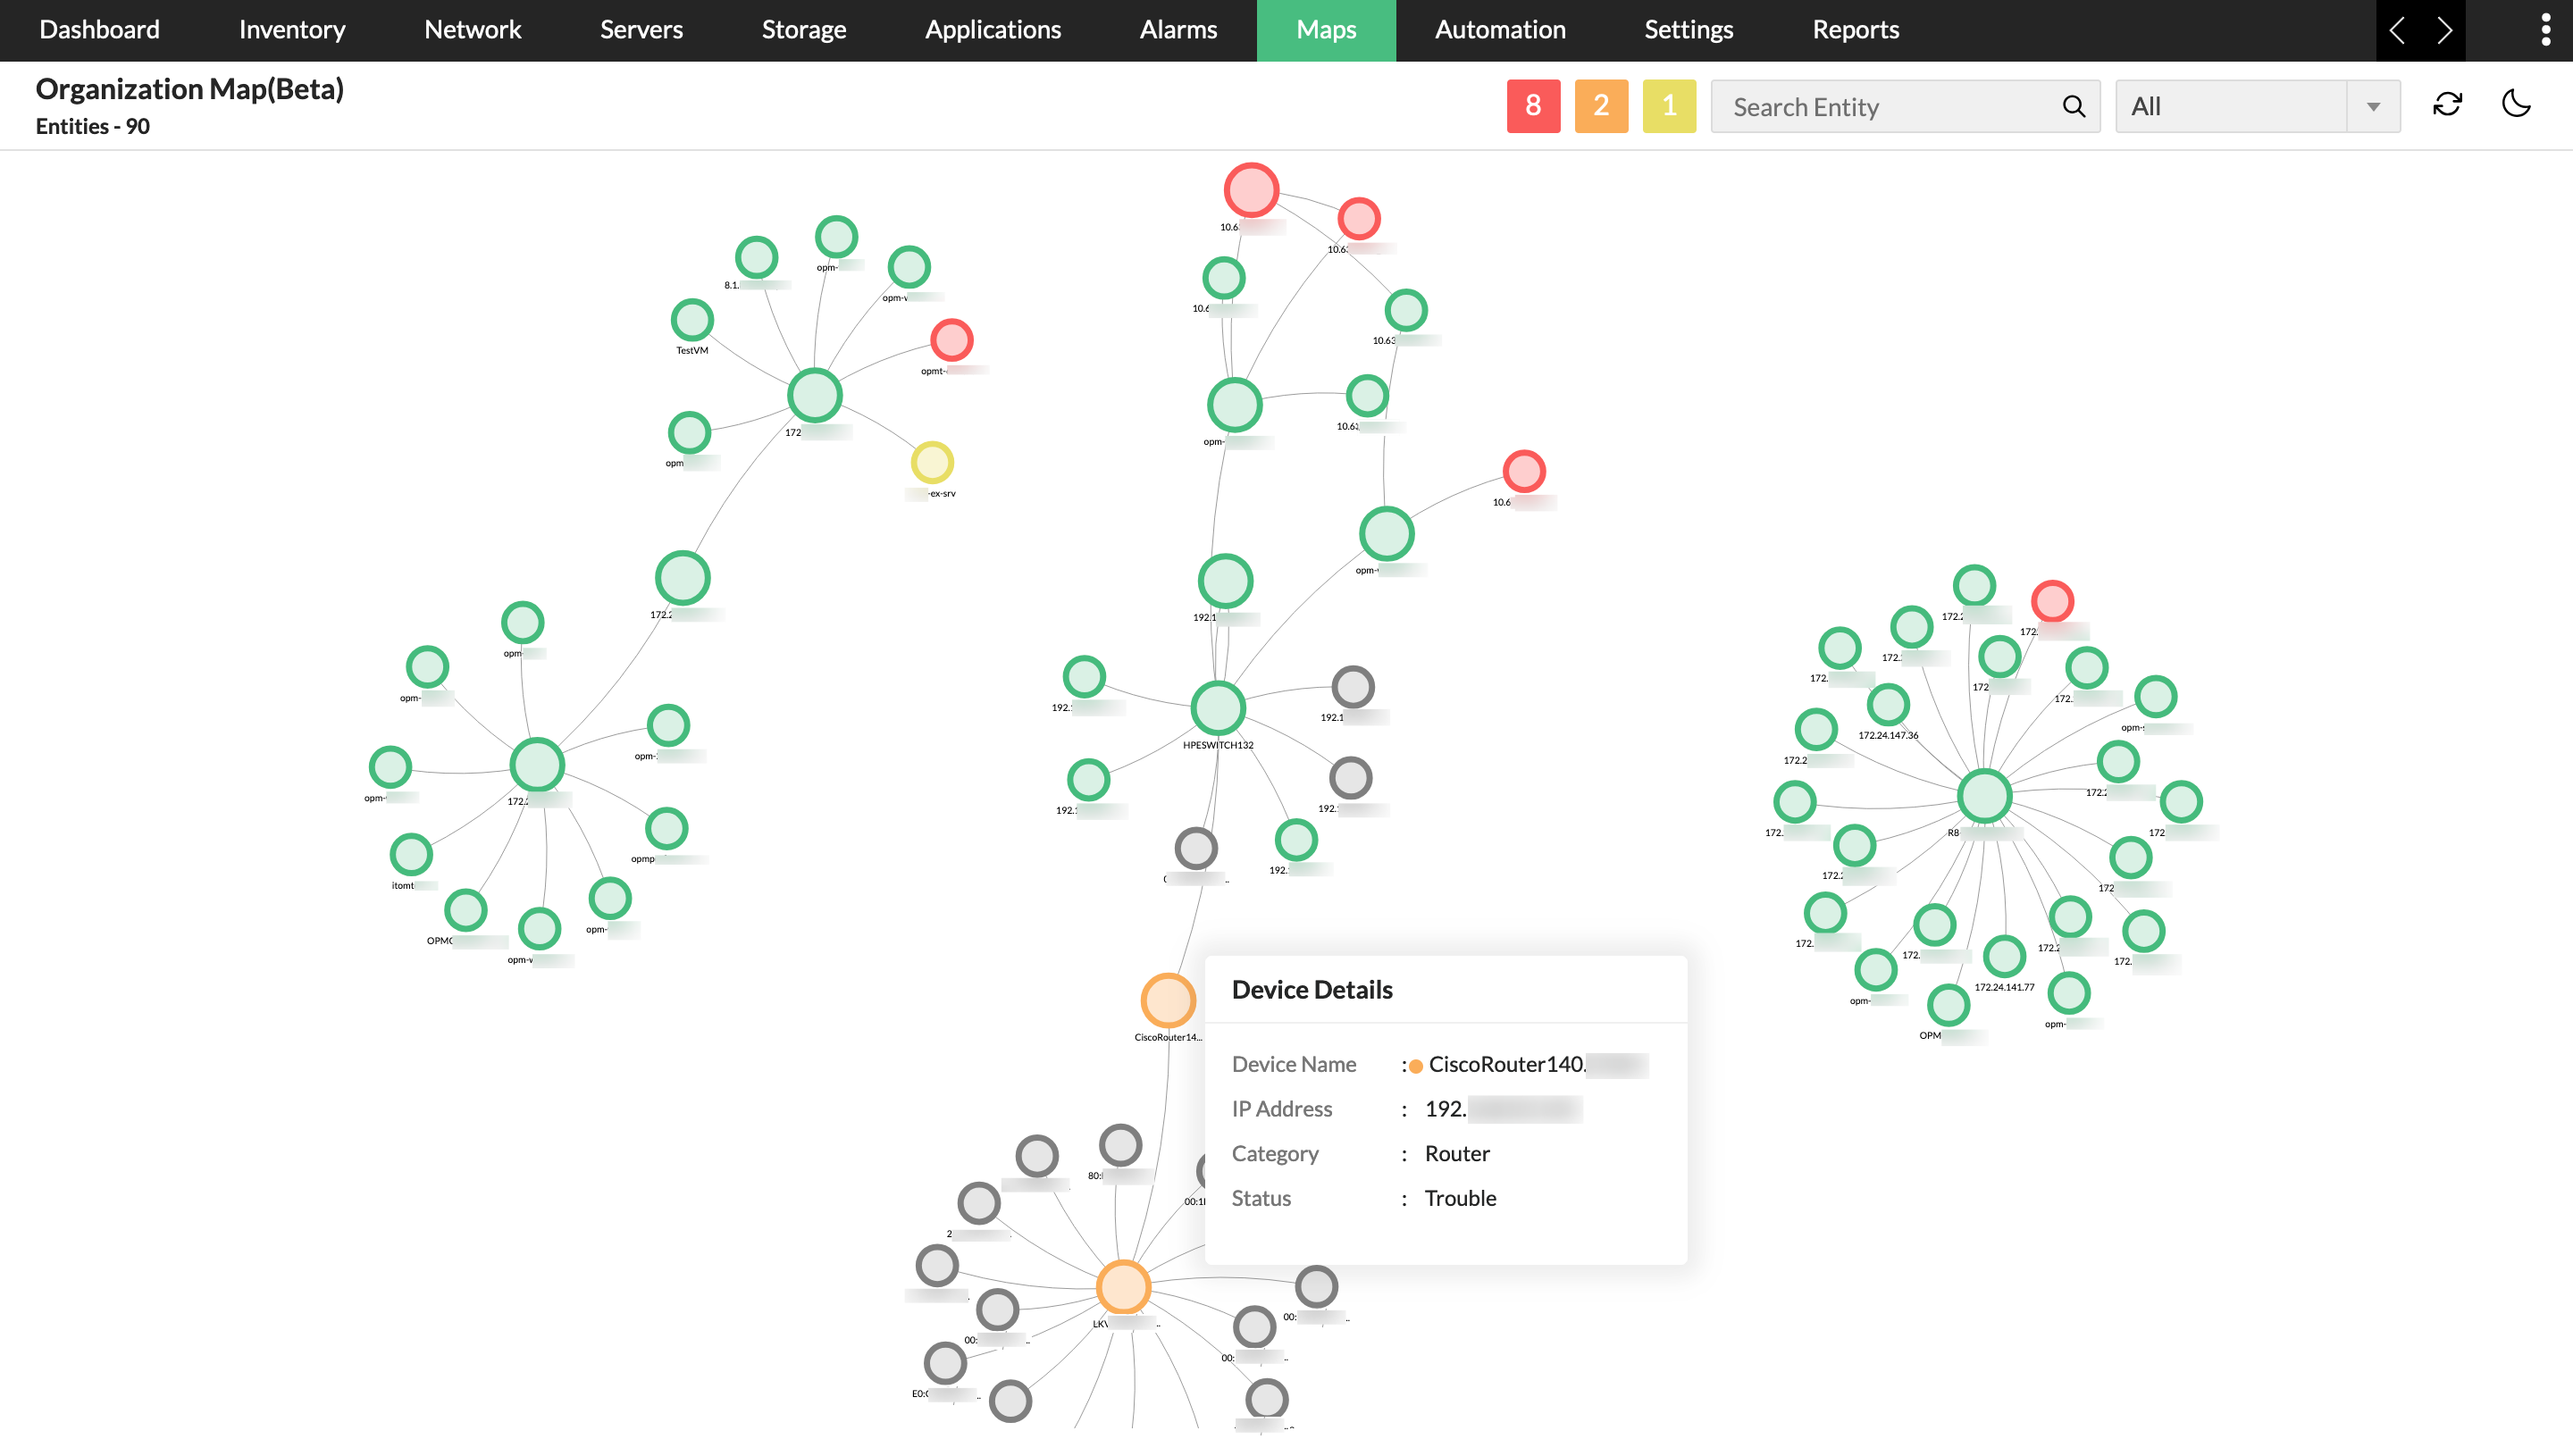
OpManager discovers and maps relationships from the layer 2 to the applications and services layers. This includes seed routers, seed switches, host servers, VMs, applications, and databases. These maps can be imported into ServiceDesk Plus service maps to create an updated map of the IT systems and their relationships in an organization. Updated service maps greatly simplify impact analysis when technicians have to perform planned maintenance or deal with unplanned outages.
When users raise requests for planned maintenance or asset change requests, you can avoid unnecessary alarm floods with OpManager's downtime schedules. Users can configure the exact period the device is expected to be down or affected by the change in ServiceDesk Plus' "Change" section. OpManager will suspend monitoring these devices within that time frame to ensure that alarm are not generated.
Watch this on-demand webinar on how you can ensure high availability and business continuity by integrating ManageEngine OpManager and ServiceDesk Plus.
Reviewer Role: Infrastructure and Operations
Company size: 500M - 1B USD
We have been using OpManager since 2011 and our overall experience has been excellent. The tool plays a vital role in providing the value to our organization and to the customers we are supporting. The support is excellent and staff takes full responsibilities in resolving the issues. Innovation is never stopping and clearly visible with newer versions.
Reviewer Role: Infrastructure and Operations
Company size: 5,000 - 50,000 Employees
I have a long standing relationship with ManageEngine. OpManager has always missed one or two features that would make it truly the best tool on the market, but over it is the most comprehensive and easy to use the product on the market.
Reviewer Role: Program and Portfolio Management
Company size: 500M - 1B USD
The vendor has been supportive during the implementation & POC phases providing trial licenses. Feature requests and feedbacks is usually acted upon swiftly. There was sufficient vendor support during the implementation phase. After deployment, the support is more than adequate, where the vendor could make some improvements.
Reviewer Role: CIO
Company size: 1B - 3B USD
ManageEngine provides a suite of tools that have made improvements to the availability of our internal applications. From monitoring, management and alerting, we have been able to peak performance within our data center.
Reviewer Role: Enterprise Architecture and Technology Innovation
Company size: 250M - 500M USD
ManageEngine support was responsive to all our queries.

“OpManager helps me monitor all aspects of the data-center and equipment like servers, switches and routers. It is fast, intuitive and centralized and you do not need to be an expert to deal with OpManager.”
NGHA

“Donald Stewart, IT Manager of Crest Industries is happy with ManageEngine OpManager for its end-to-end network monitoring software. It is easy-to-use and offers fault and performance management for router.”
IT Manager, Crest Industries

“John Rosser, MIS Manager of Yale Chase talks about the proactive nature of ManageEngine OpManager & how his organisation gained value from it.”
MIS Manager
A network monitoring tool ensures that you're aware of the status and performance of your network and its components at all times. When end users raise issues, network technicians across different levels in your organization can reference the network monitoring tool and deduce the probable cause. This can help drive down the MTTR.
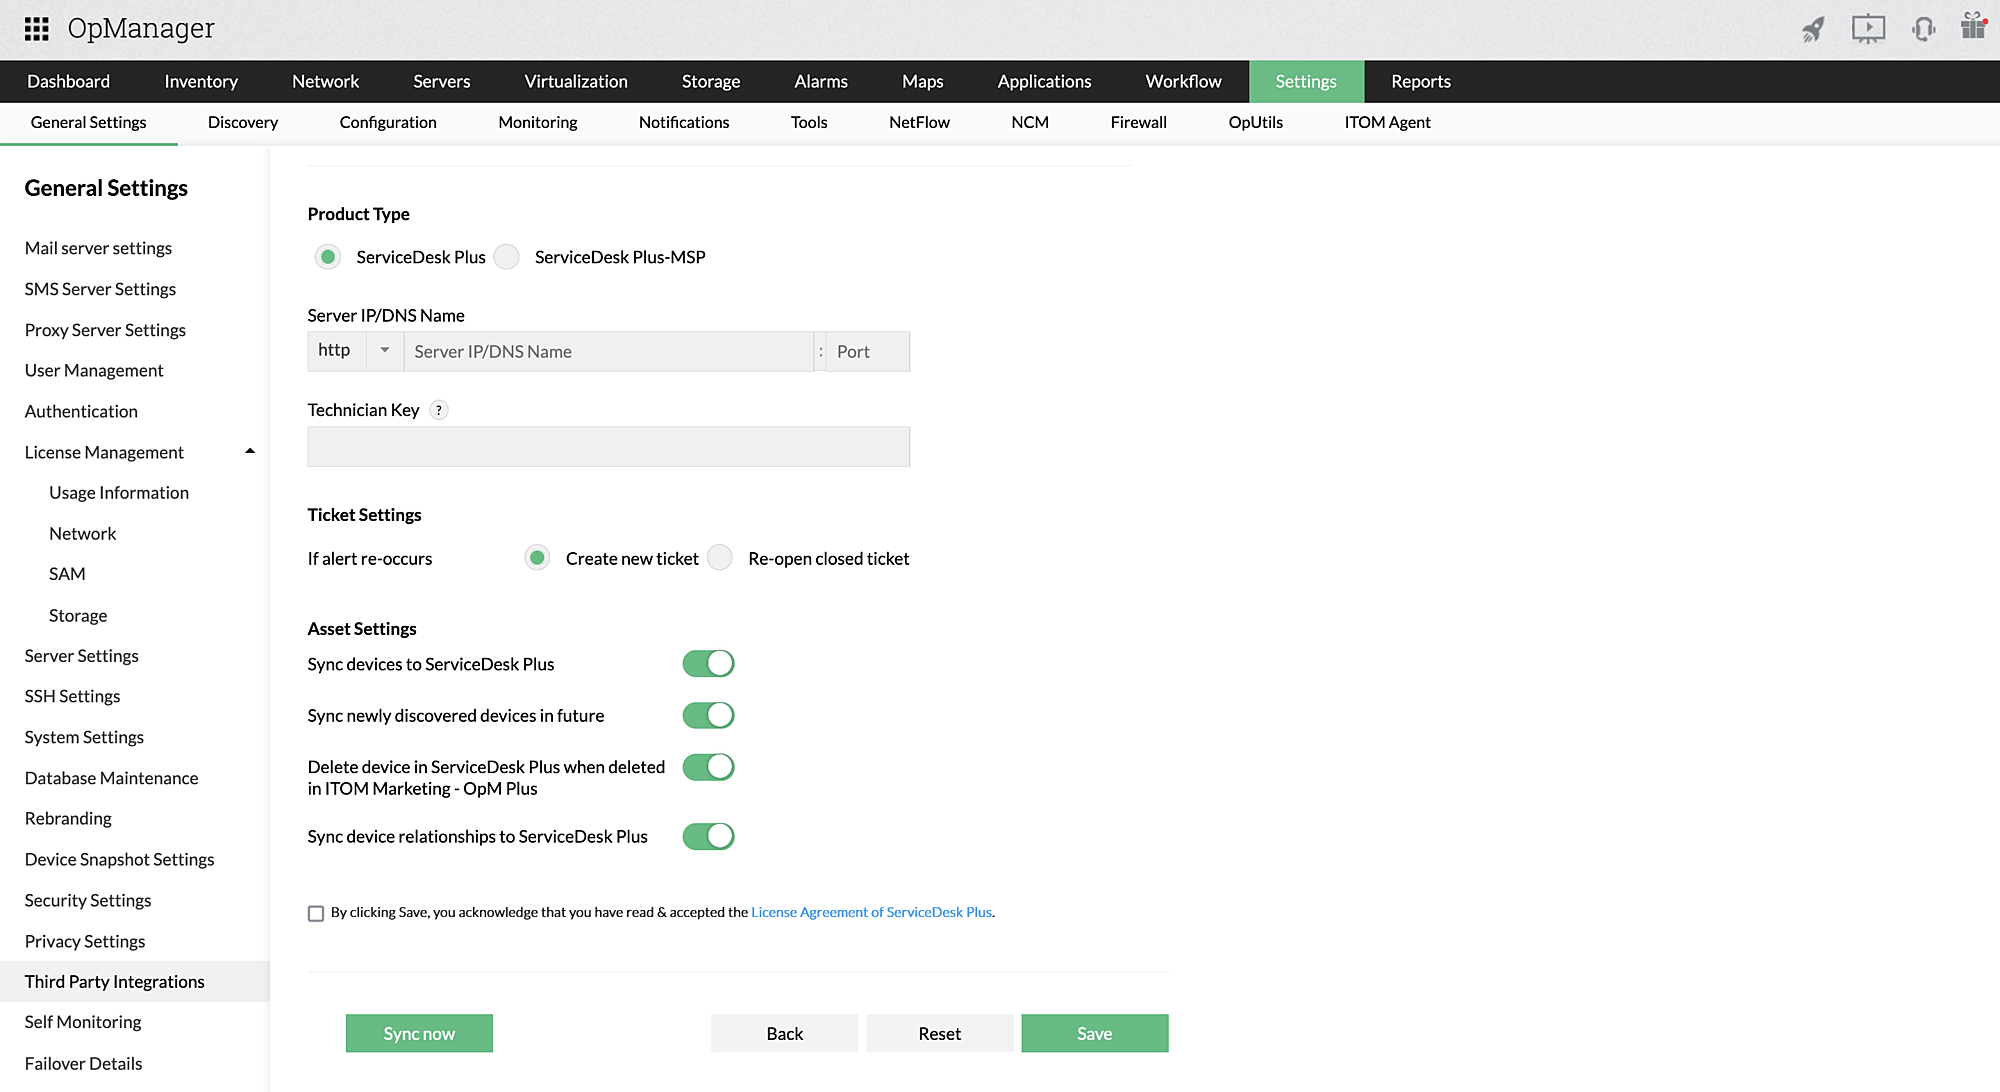
OpManager and Service Desk Plus are in-house products of ManageEngine and integrates seamlessly with each other. If you're a Service Desk Plus user, all you need to do is download OpManager and integrate to Service Desk Plus using its API key. You can read more about that on this page.
OpManager uses agent-less and agent-based monitoring to collect data from your network and its devices. You can enable your own thresholds for this data, or let OpManager use its ML engine set adaptive thresholds. Once the data crosses expected usage or your thresholds, OpManager generates alarms, sends notifications, or when integrated with Service Desk Plus- log a detailed ticket.
OpManager has a range of integration with other third-party products like Slack, Jira, ServiceNow etc. In addition, OpManager is part of the IT operations management suite of ManageEngine with add-ons and plugins available to perform applications management, network configuration management, traffic and bandwidth management, firewall management, and IP address and switch port management.