OpManager is trusted by 5000+ businesses worldwide
Unified console for all power monitoring needs
UPS uptime monitoring
UPS and power backup devices are essential to your IT operations. OpManager helps track their availability with ICMP, SNMP, or TCP-based status checks and generates instant downtime notifications to prevent unplanned power outages.
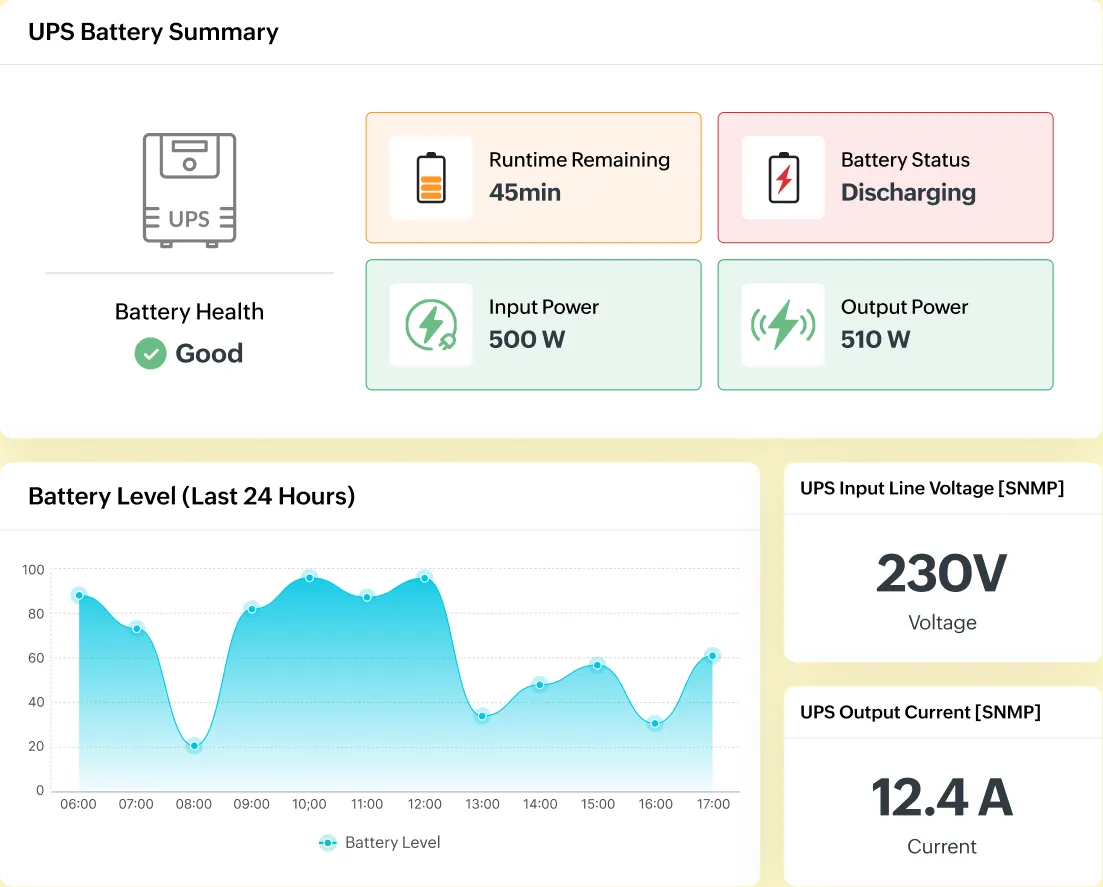
UPS battery backup monitoring
Gain visibility into your UPS systems to prevent battery degradation. OpManager can monitor battery health, status, and remaining runtime, as well as UPS charge, load, temperature, and the number of days left till battery replacement.
UPS performance monitoring
Monitor UPS performance during charge and discharge with multi-level alarm thresholds. OpManager measures input and output power with metrics like voltage and current and also creates dashboards with average power supply statistics.
PDU monitoring
Ensure reliable optimal power distribution into your datacenters, servers, and storage systems by monitoring PDU units. OpManager helps you track power supply statistics (Voltage, current, and power supply status) and alerts you of abnormal developments.
Hardware monitoring
Monitor the temperature of critical servers, racks, and storage chassis, as well as the cooling systems and fans used to manage heat, run hardware checks, and generate hardware health reports to ensure optimal performance across all IT systems.
Custom SNMP monitoring
OpManager further expands its PDU and UPS monitoring capabilities with customized SNMP monitoring. Leverage SNMP OIDs to collect any metric from any UPS vendor or PDU system.
Supported UPS vendors
Get Started - It's Free- Schneider electric
- APC (Schneider)
- Eaton
- Mitsubishi
- Liebert (Vertiv)
- Toshiba
- Emerson
- HPE
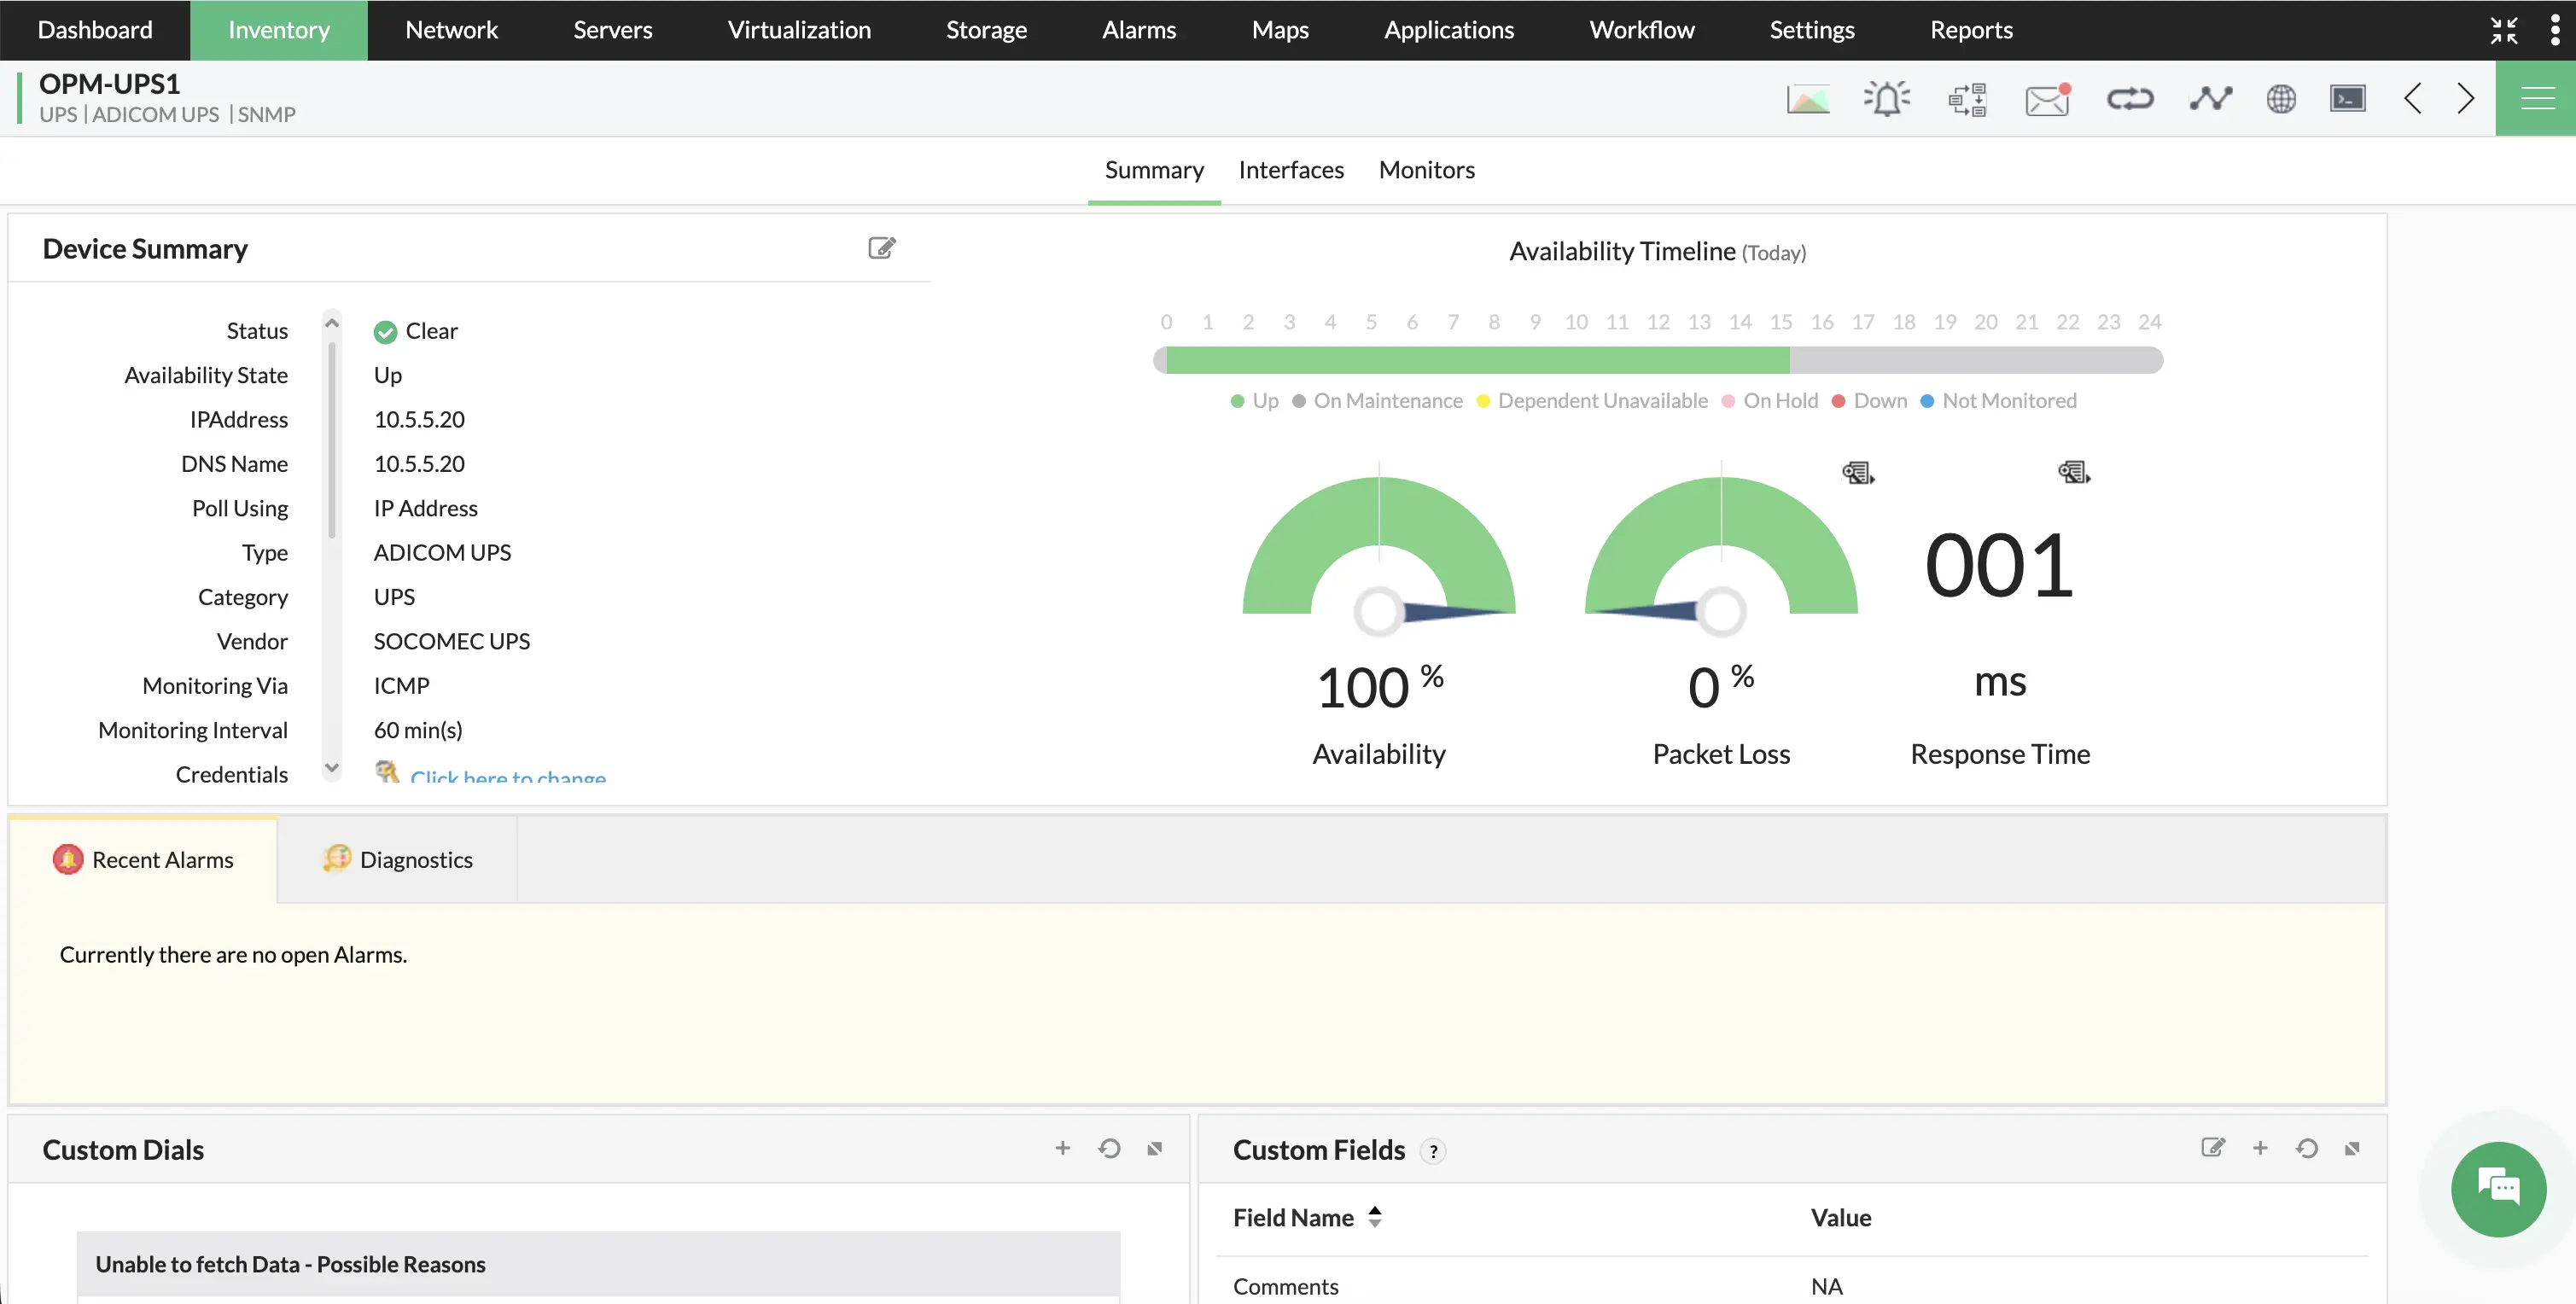
Discover, classify, and monitor UPS devices automatically
Kick start your UPS monitoring with minimal manual effort. OpManager's automated network discovery scans and identifies all the devices connected to your IT, including UPS devices. OpManager uses SNMP to collect additional context and classifies your devices based on type, vendor, and model. OpManager also curates dedicated performance monitors for each device type so that you associate them and start monitoring. OpManager supports 85+ UPS models from 20+ vendors out of the box.
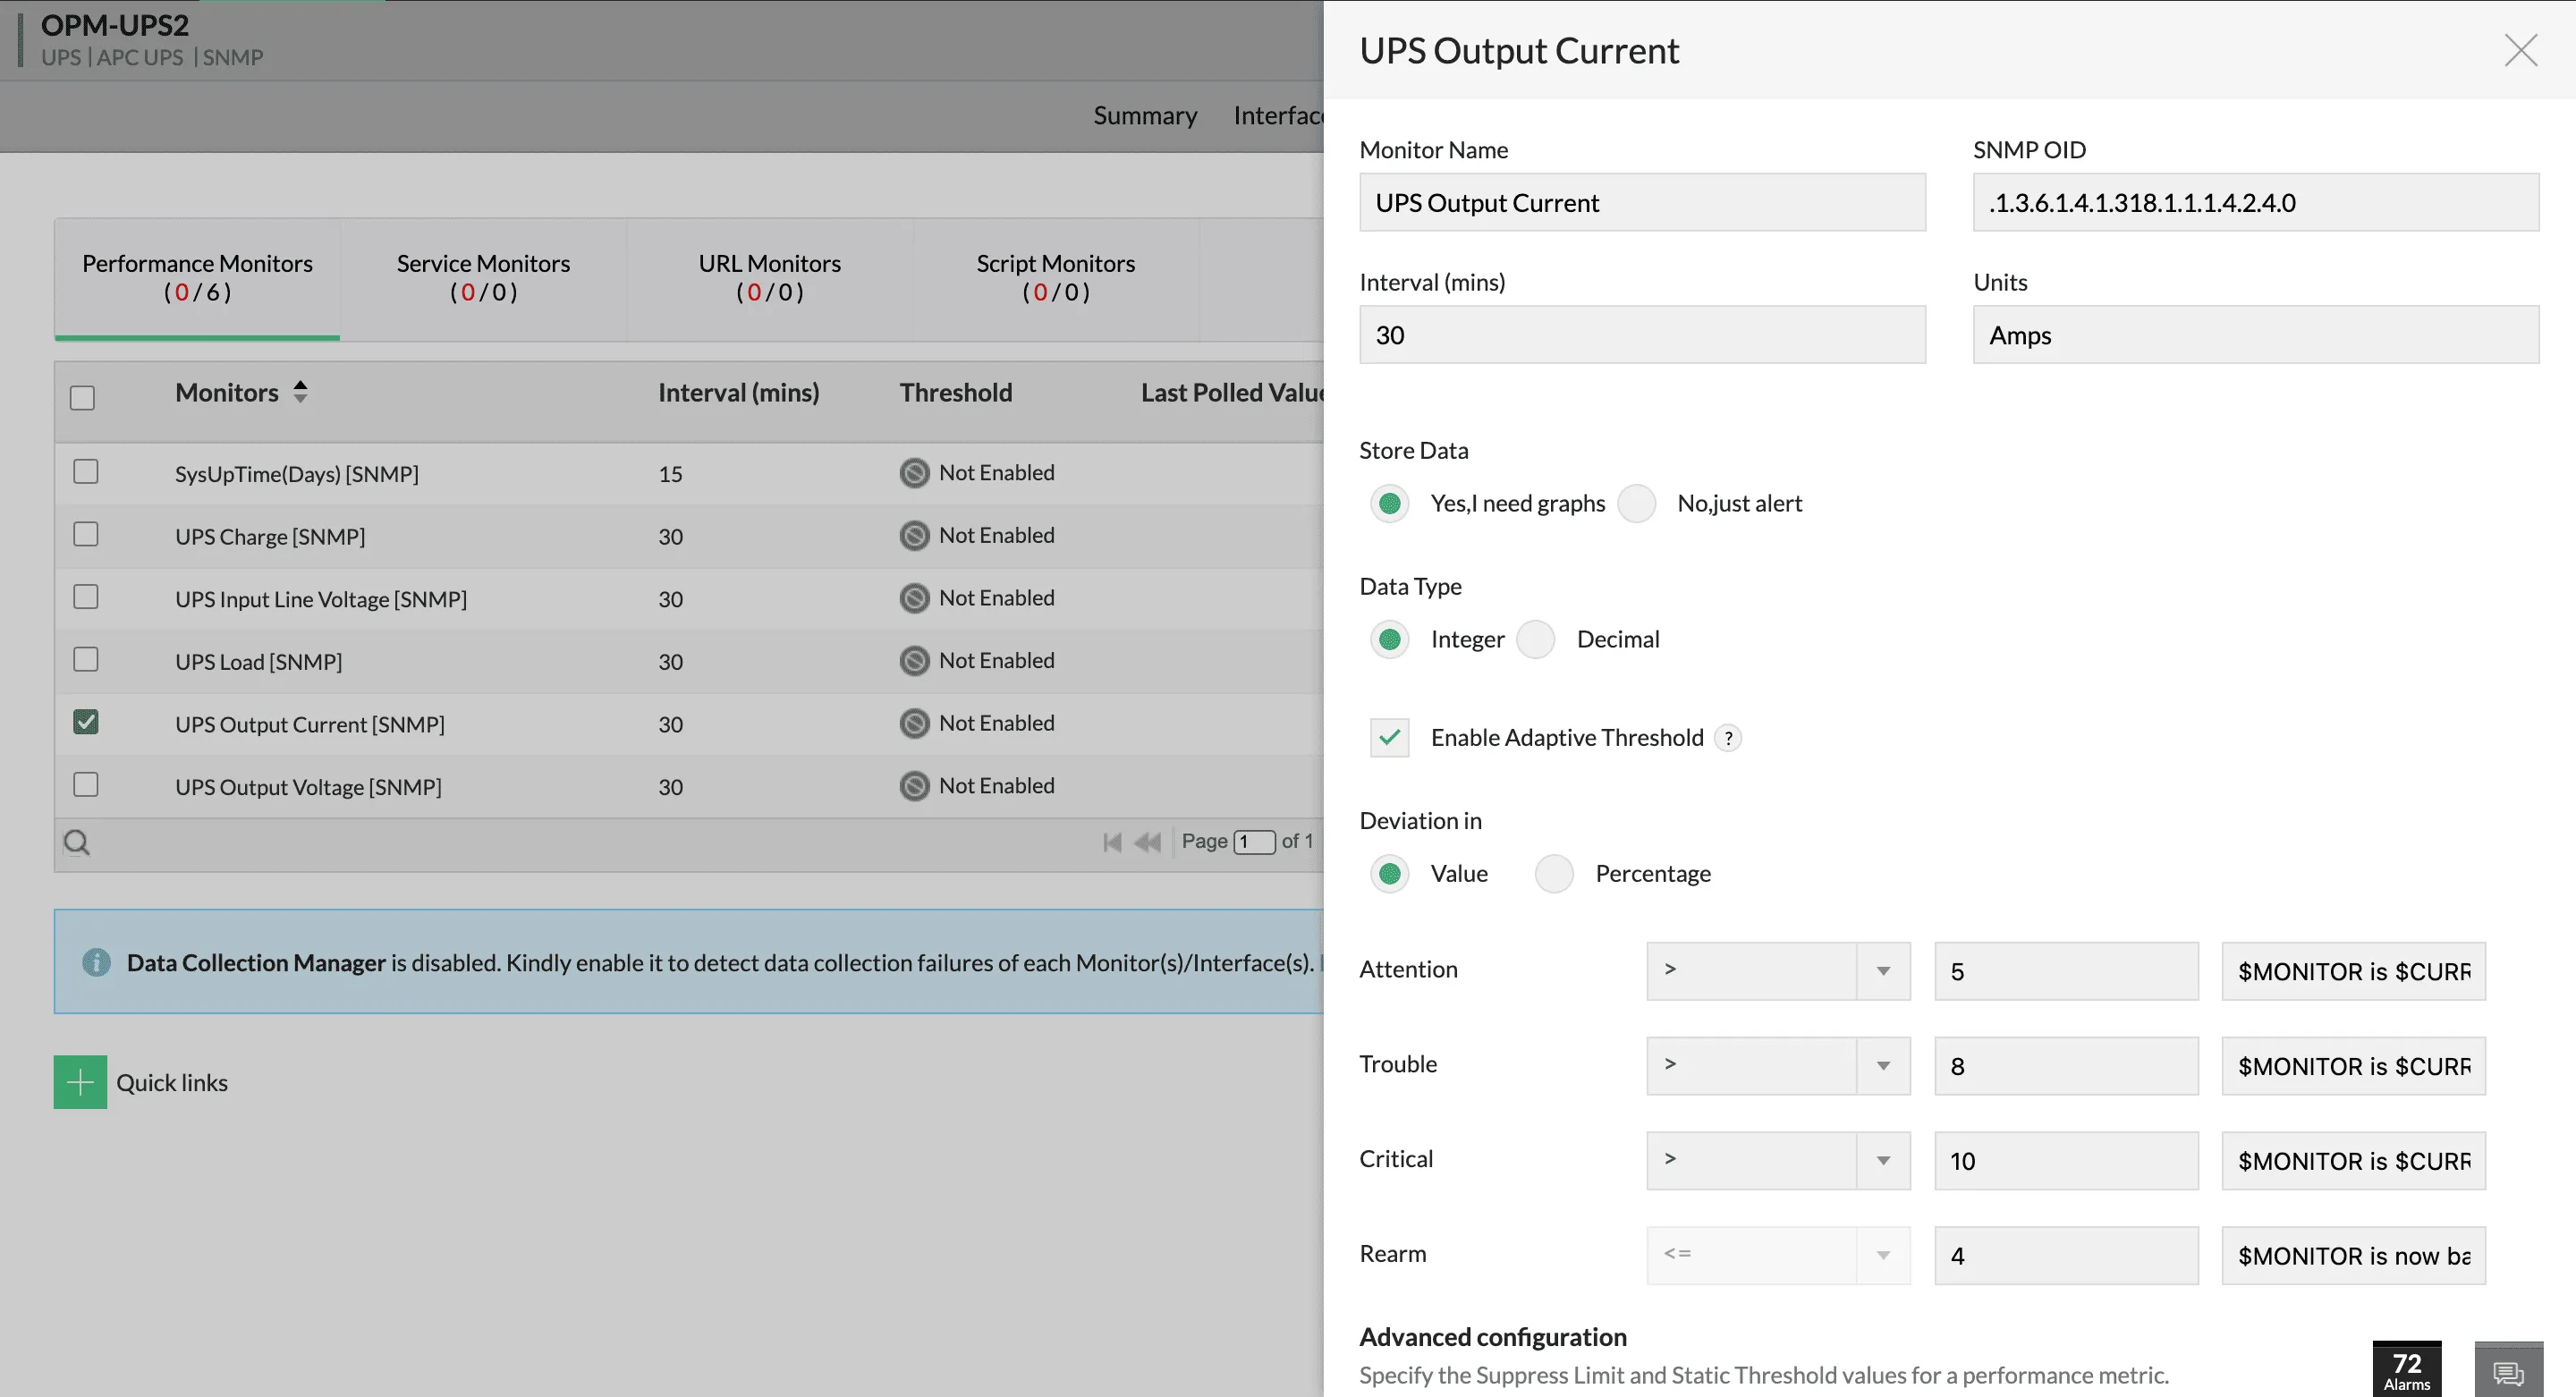
AI-driven alarms for proactive power management
The optimal value of UPS and PDU performance metrics can vary based on time and load. Manually setting up alarms for metrics like voltage, current, and temperature can often be a challenge. OpManager automates with process with machine learning powered alarm management. For each hour, OpManager calculates the optimal value of performance metrics (based on historical training data), and assigns three-level thresholds for alarms. You'll be alerted if the monitored metrics cross these values.
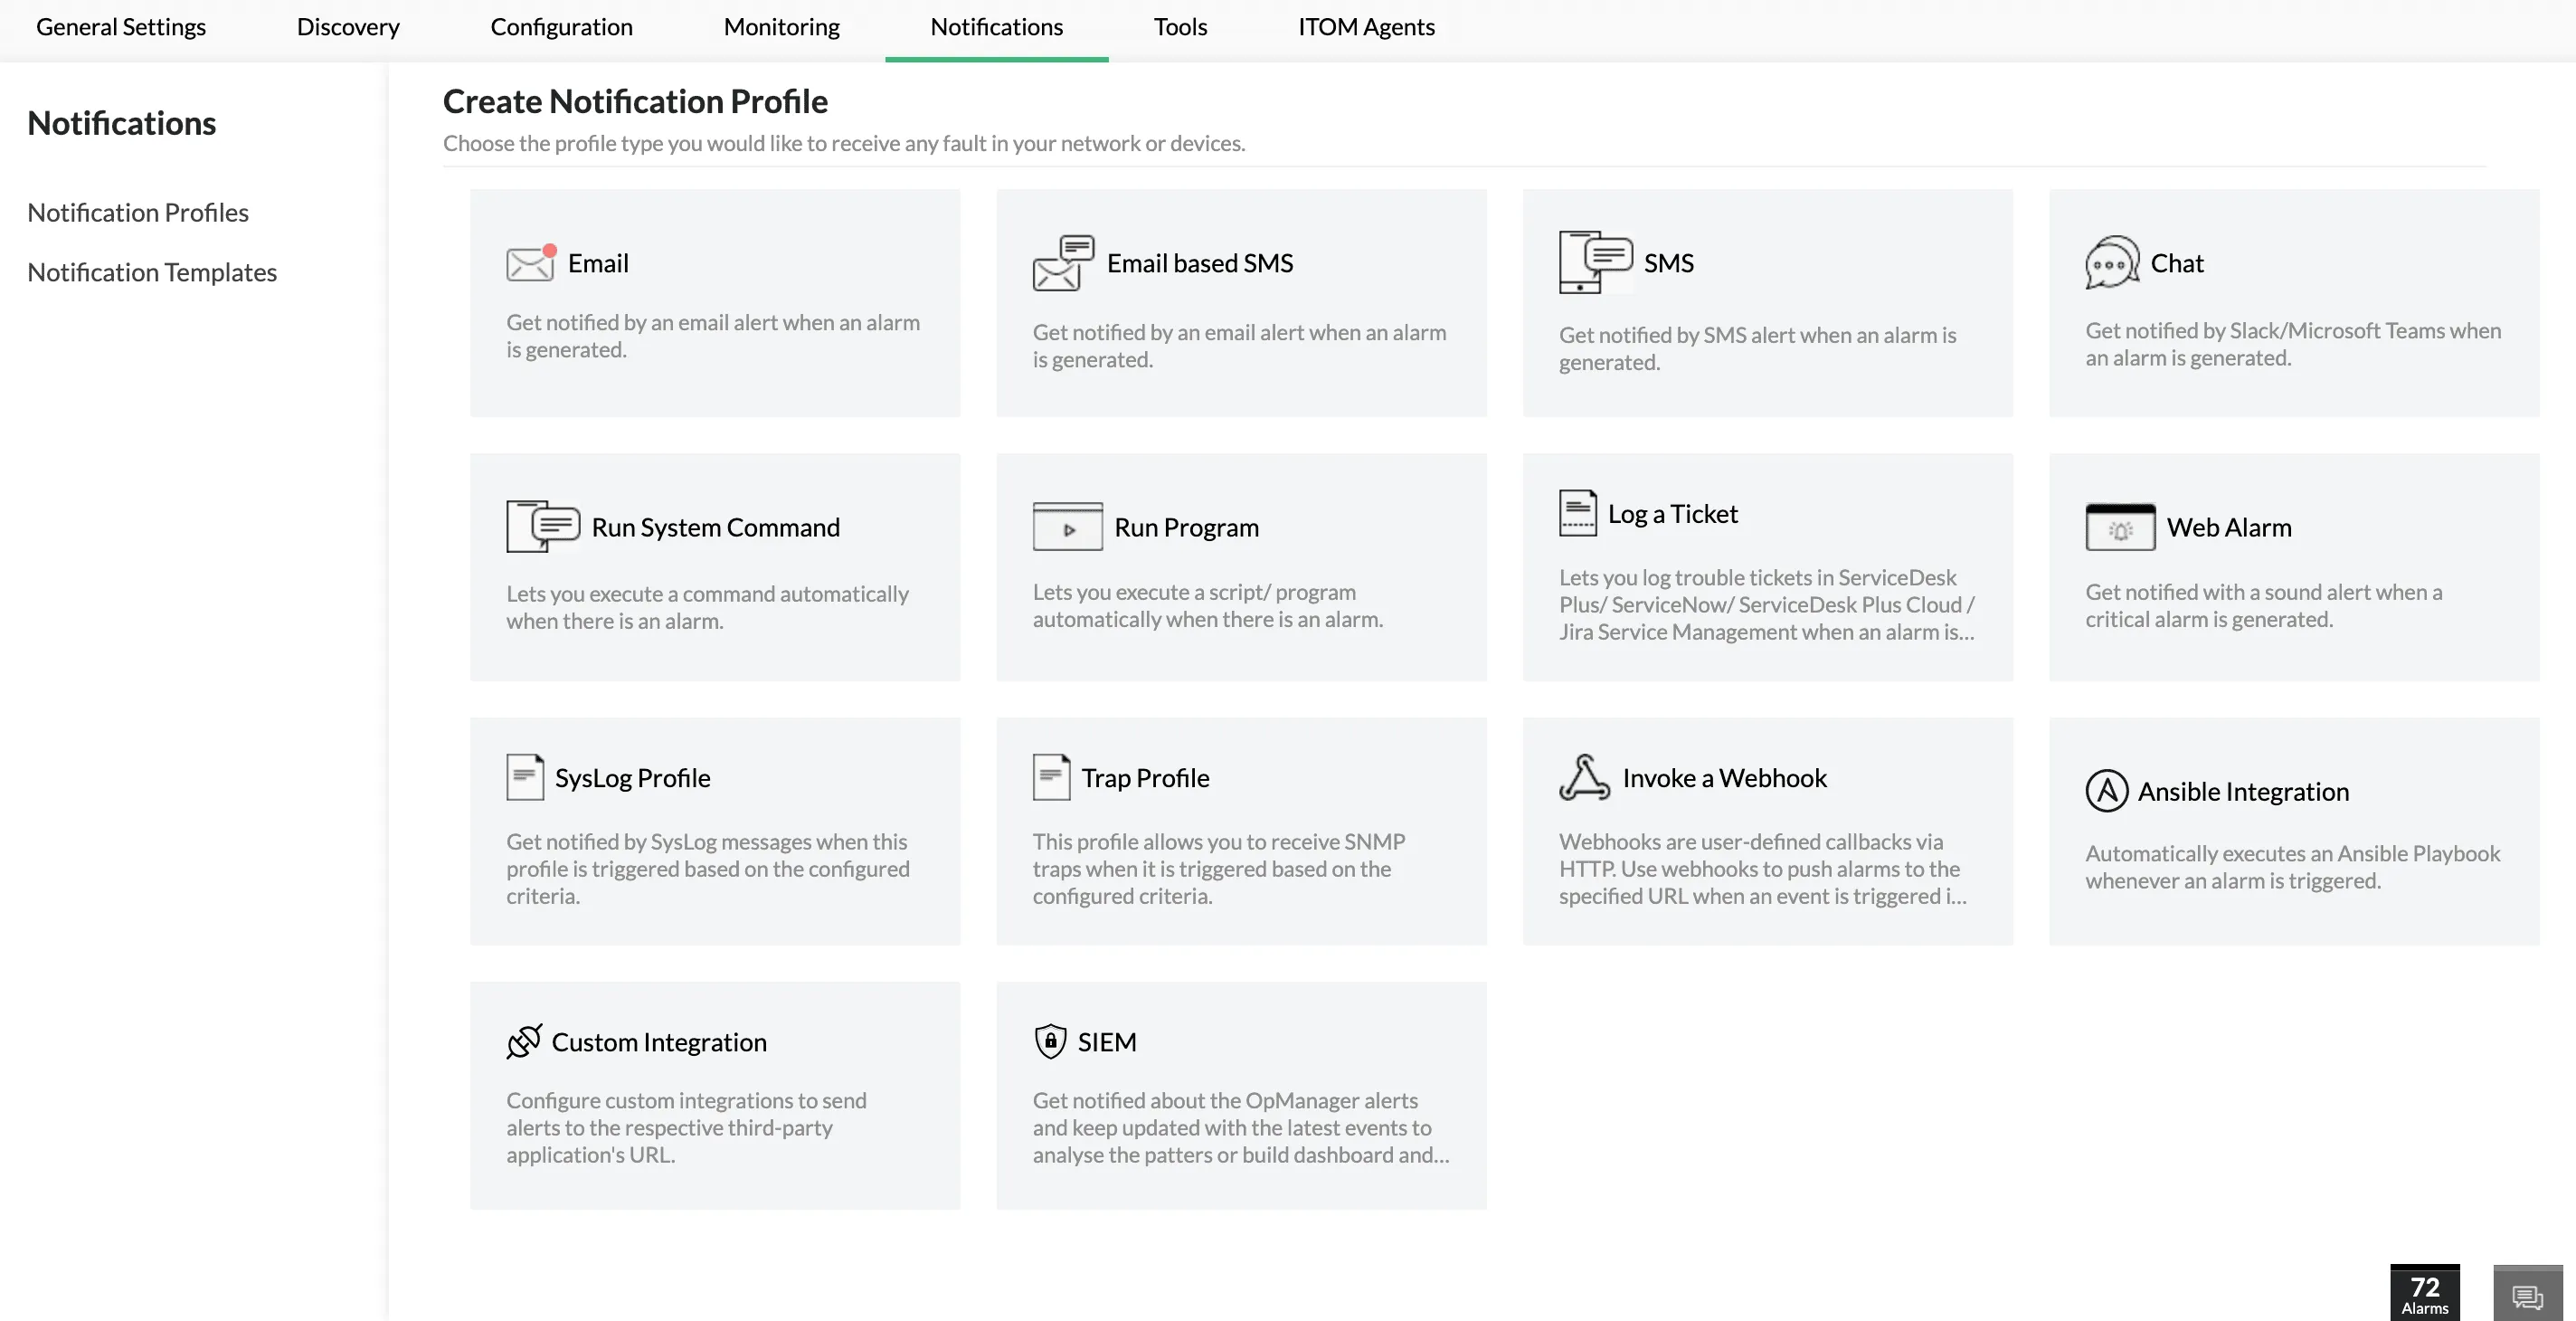
Get UPS and PDU updates anytime, anywhere
Detecting PDU and UPS monitoring issues can be of utmost importance effects for your IT operations and user experience. OpManager's multi-channel notifications ensure that you'll never miss critical alarms. You can create notification profiles to escalate PDU and UPS monitoring alarms via: SMS, email, web alarms, traps, chat tools, ITSM tools, and more.
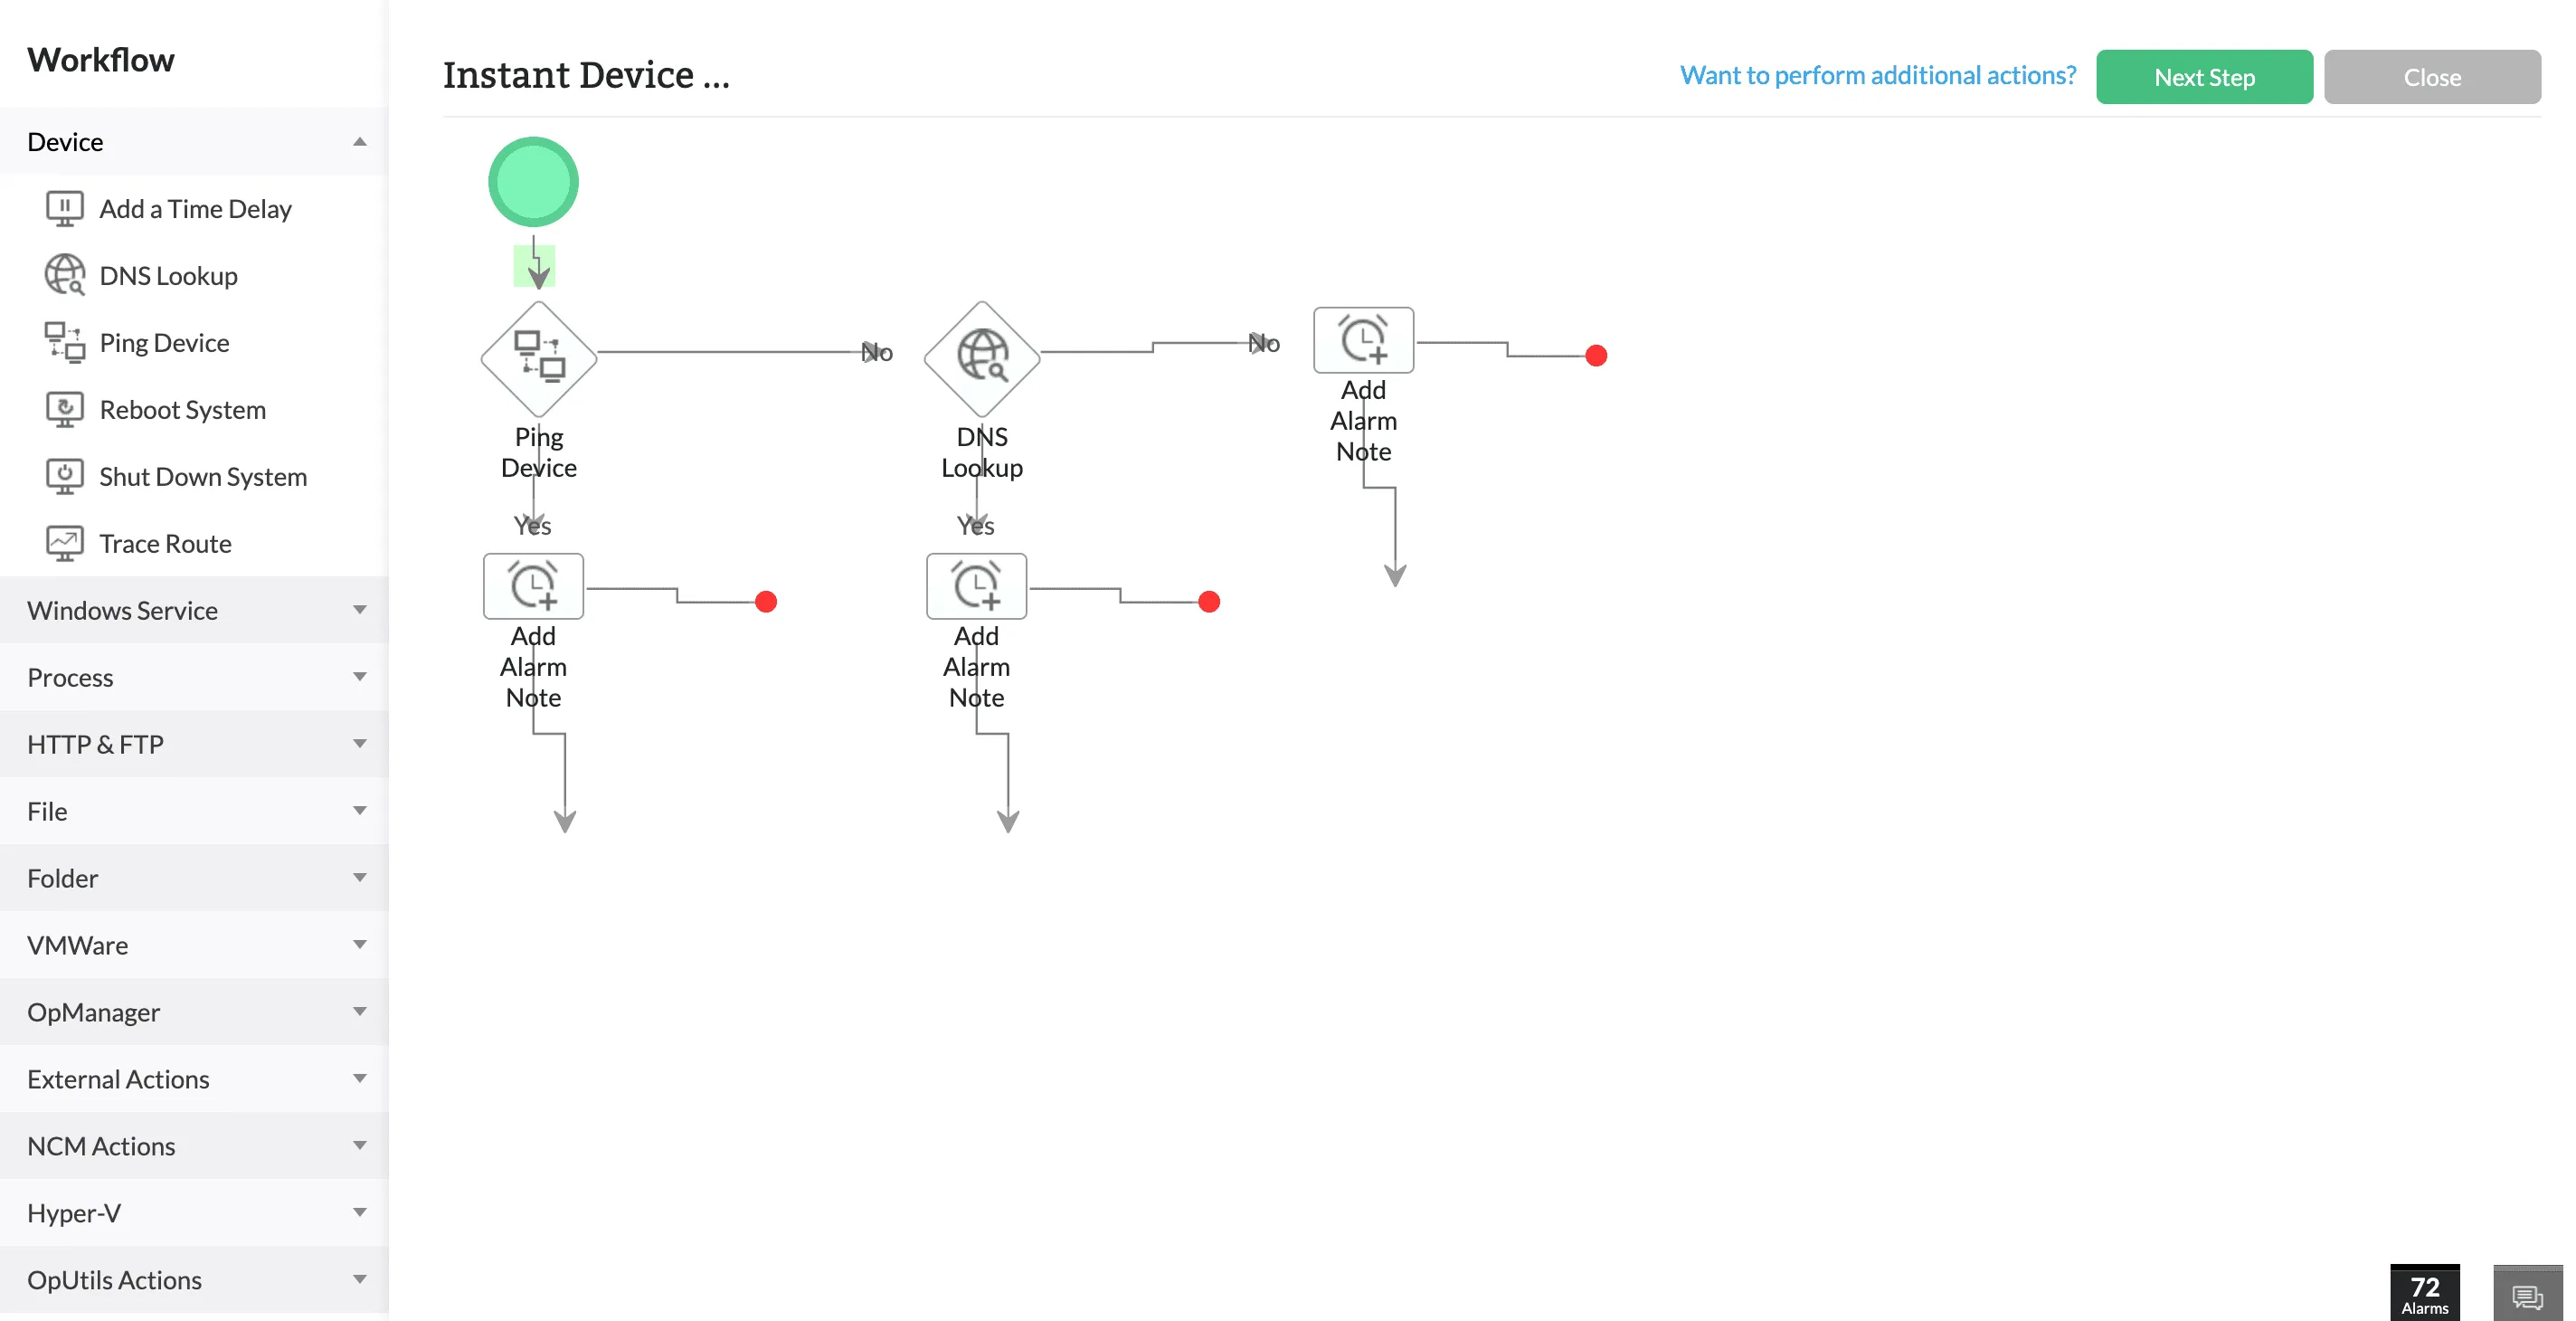
Automate workflows for swift incident response
Execute multi-step sequential automations with an easy-to-use code-free workflows builder. OpManager's workflows can be triggered on a schedule or with an alarm trigger. For instance, if you set up an alarm that warns you of your UPS battery percentage dropping below a certain limit, you can use that alarm to trigger a workflow that shuts down non-critical servers. Workflow capabilities allow you to perform quick incident response on top of UPS monitoring.
Stay on top of UPS and PDU incidents with dashboards
Keep tabs on PDU and UPS monitoring incidents with dedicated dashboards and NOC views. Dashboards combine reports, widgets, and graphs into an easy-to-read overview of your power infrastructure. You can combine multiple dashboards into a recurring NOC view to display on datacenter control rooms to get quick and insightful updates.

Perform PDU and UPS monitoring on the go with OpManager's mobile app!
Monitoring UPS systems, power distribution units, and power backups is no easy task. With OpManager's mobile application, your role as an IT admin is easier because you can receive push notifications, set up home screen widgets, review alarms and dashboards, acknowledge issues, and direct other network technicians from your iPhone or Android smartphone!

Frequently asked questions
What is the advantage of monitoring UPS devices with OpManager?
Unlike other dedicated UPS monitoring software, OpManager can also monitor network and IT infrastructure components. This means that in addition to your UPS devices, you can also monitor servers, storage systems, network hardware, workstations, wireless devices, and printers with a single console. This reduces the number of screens your IT team needs to look at to manage your IT operations. Power distribution systems and power backups work together with the servers and networks in your IT environment, so monitoring them with a single tool gives a better picture of their operations.
OpManager also offers other advantages like:
- AI/ML engine for accurate monitoring and forecasts
- Powerful network mapping and visualization
- Support for 11,000+ device types
- High scalability and distributed monitoring support
- Agent-based and agentless monitoring
How does OpManager's UPS monitoring capabilities work?
Your UPS devices has to be connected to the network for OpManager to monitor them. For uptime, OpManager uses ICMP as a default protocol for monitoring, but it can also use TCP or SNMP in case ICMP is restricted in your network. For performance metrics, OpManager uses SNMP to collect information from your devices.
How can I start monitoring UPS systems with OpManager?
You can create a scheduled discovery profile in your OpManager console. This ensures that OpManager scans the network periodically and automatically identifies and adds UPS devices. These devices will be listed in your console with basic device information, uptime monitoring statistics, and curated performance metrics. You can enable the performance metrics and set up alarm thresholds to start monitoring UPS performance.
How does notification profiles and workflows simplify incident response?
Notification profiles and workflows escalate certain alarms and execute preconfigured actions. This can be an SMS alarm to your first level network technician, a context-rich ticket in your helpdesk software, or an automated troubleshooting sequence that resolves your issue without human intervention. This greatly speeds up your incident response and simplifies the efforts of your IT team.
Why choose OpManager over dedicated PDU & UPS monitoring software?
OpManager is vendor-agnostic and offers hoslistic IT infrastructure monitoring. UPS & PDU vendors might offer dedicated monitoring solutions specialziing on their devices, but managing multiple tools can be a hassle and can slow down incident detection and response. OpManager, on the other hand, is a single-pane-of-glass for your entire network.
How can I start monitoring PDU systems with OpManager?
You can discover PDU units using OpManager's auto-discovery feature. Once discovered, OpManager automatically identifies the vendor and model of the PDU and lists it in the monitoring inventory. You can then assign relevant monitors to perform PDU monitoring.
Explore OpManager's PDU and UPS monitoring capabilities today!
Loved by customers all over the world
“Easy Implementation, Excellent support & Lower Cost Tool - Team Lead, IT Services Industry”
Reviewer Role: Infrastructure and Operations
Company size: 500M - 1B USD
We have been using OpManager since 2011 and our overall experience has been excellent. The tool plays a vital role in providing the value to our organization and to the customers we are supporting. The support is excellent and staff takes full responsibilities in resolving the issues. Innovation is never stopping and clearly visible with newer versions.
“OpManager - 10 steps ahead of the competition, one step away from being unequaled - Network Services Manager, Government Organization”
Reviewer Role: Infrastructure and Operations
Company size: 5,000 - 50,000 Employees
I have a long standing relationship with ManageEngine. OpManager has always missed one or two features that would make it truly the best tool on the market, but over it is the most comprehensive and easy to use the product on the market.
“Easy Implementation with a feature rich catalogue, support has some room for improvement - NOC Manager, IT Services Industry”
Reviewer Role: Program and Portfolio Management
Company size: 500M - 1B USD
The vendor has been supportive during the implementation & POC phases providing trial licenses. Feature requests and feedbacks is usually acted upon swiftly. There was sufficient vendor support during the implementation phase. After deployment, the support is more than adequate, where the vendor could make some improvements.
“Great Monitoring tool - CIO in Finance Industry”
Reviewer Role: CIO
Company size: 1B - 3B USD
ManageEngine provides a suite of tools that have made improvements to the availability of our internal applications. From monitoring, management and alerting, we have been able to peak performance within our data center.
“Simple Implementation, Easy To Use. Very Intuitive. - Principle Engineer in IT Services”
Reviewer Role: Enterprise Architecture and Technology Innovation
Company size: 250M - 500M USD
ManageEngine support was responsive to all our queries.

“OpManager helps me monitor all aspects of the data-center and equipment like servers, switches and routers. It is fast, intuitive and centralized and you do not need to be an expert to deal with OpManager.”
Altaleb Alshenqiti
NGHA

“Donald Stewart, IT Manager of Crest Industries is happy with ManageEngine OpManager for its end-to-end network monitoring software. It is easy-to-use and offers fault and performance management for router.”
Donald Stewart
IT Manager, Crest Industries
“John Rosser, MIS Manager of Yale Chase talks about the proactive nature of ManageEngine OpManager & how his organisation gained value from it.”
John Rosser
MIS Manager