Amazon AI & ML Services Monitoring
Amazon's Artificial Intelligence (AI) and Machine Learning (ML) services portfolio enables organizations to build, train, and deploy generative AI applications without managing complex underlying infrastructure. At the core of this portfolio, it provides services that enable you to access foundation models (FMs) from leading AI companies through a single API, as well as autonomous AI agents that orchestrate foundation models, APIs, and knowledge bases to execute multi-step tasks.
Amazon Bedrock AgentCore extends this with services to deploy, connect, secure, and operate AI agents at scale, such as managed runtimes, memory, gateways to external tools, and policy-based access control.
Monitoring these AI and ML services is essential to control generative AI costs, maintain low-latency inference, and ensure reliable execution of AI-driven workflows. Applications Manager provides comprehensive monitoring capabilities for Amazon AI & ML Services, enabling you to track invocation performance, token consumption, throttling events, agent orchestration health, and log delivery status across your AWS environment from a single console.
Applications Manager supports monitoring of the following Amazon AI & ML services:
- Amazon Bedrock Classic
- Amazon Bedrock Agents Classic
- Amazon Bedrock AgentCore Harness
- Amazon Bedrock AgentCore Runtime
- Amazon Bedrock AgentCore Memory
- Amazon Bedrock AgentCore Gateway
- Amazon Bedrock AgentCore Policy Engine
Amazon Bedrock Classic monitoring
Amazon Bedrock is a fully managed service that provides access to high-performing foundation models (FMs) from leading AI companies through a single API. It enables developers to build and scale generative AI applications using techniques such as fine-tuning, retrieval-augmented generation (RAG), and agent orchestration, without managing the underlying infrastructure.
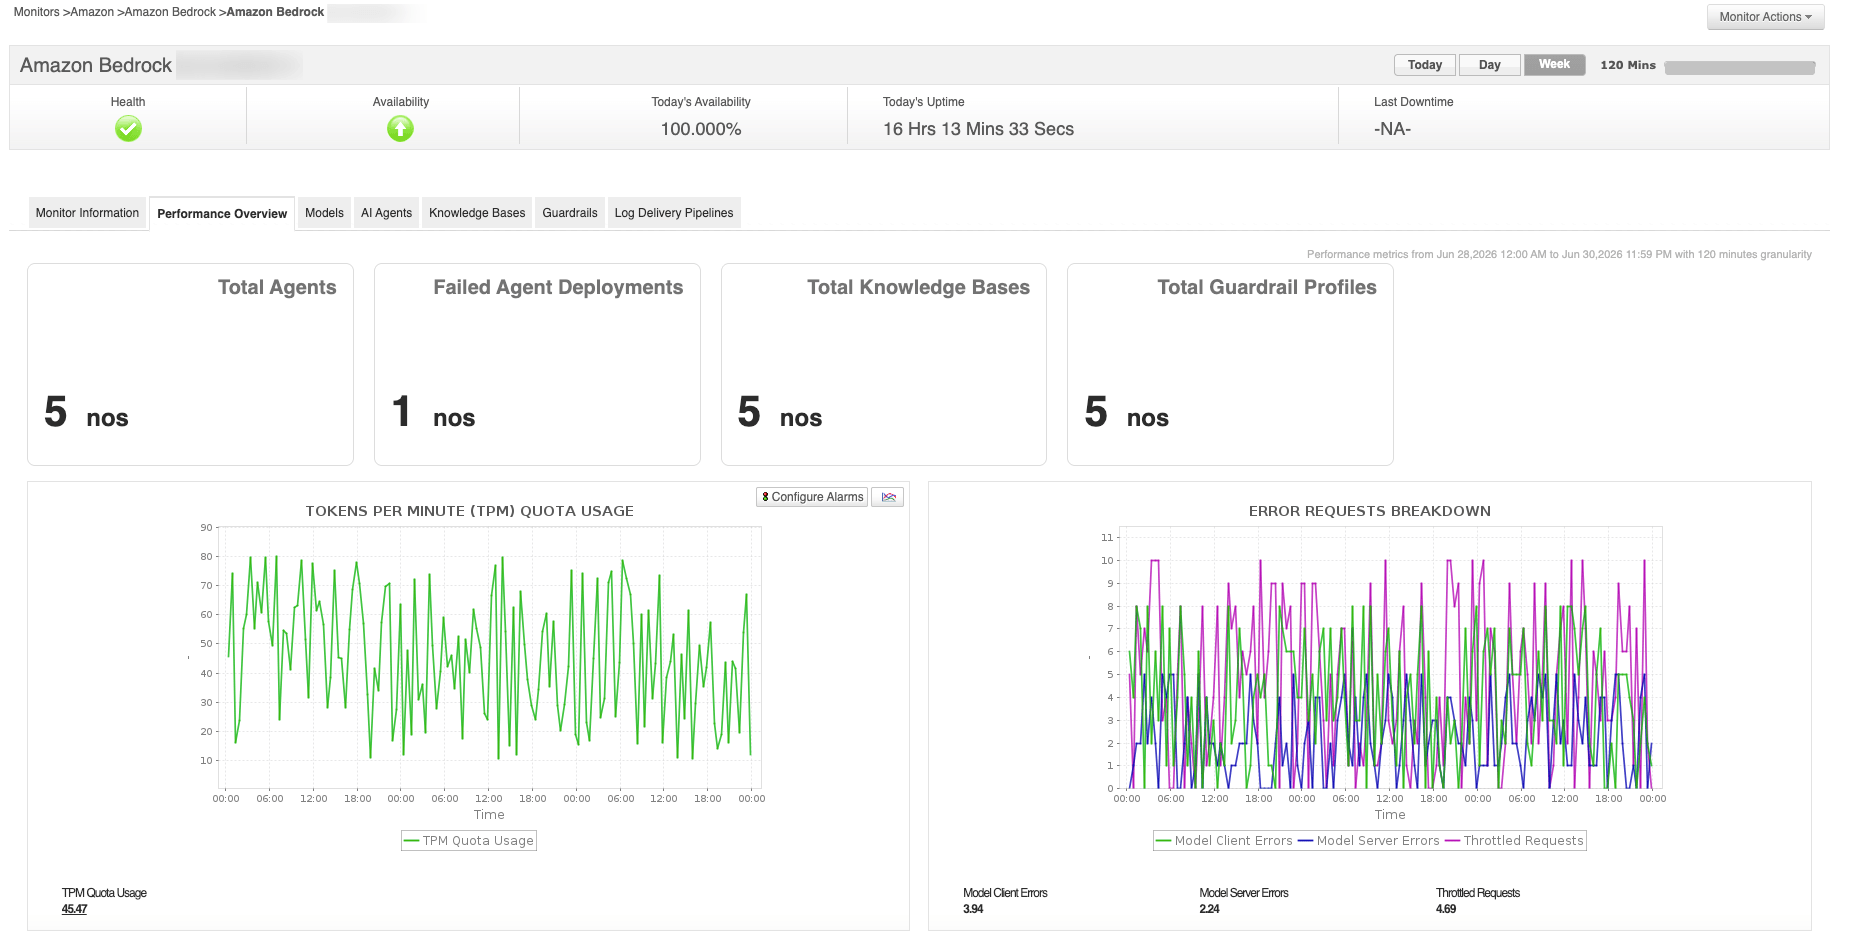
Applications Manager monitors the regional Bedrock environment by providing visibility into foundation model invocations and performance of your Bedrock resources at the regional level. With Applications Manager, you can:
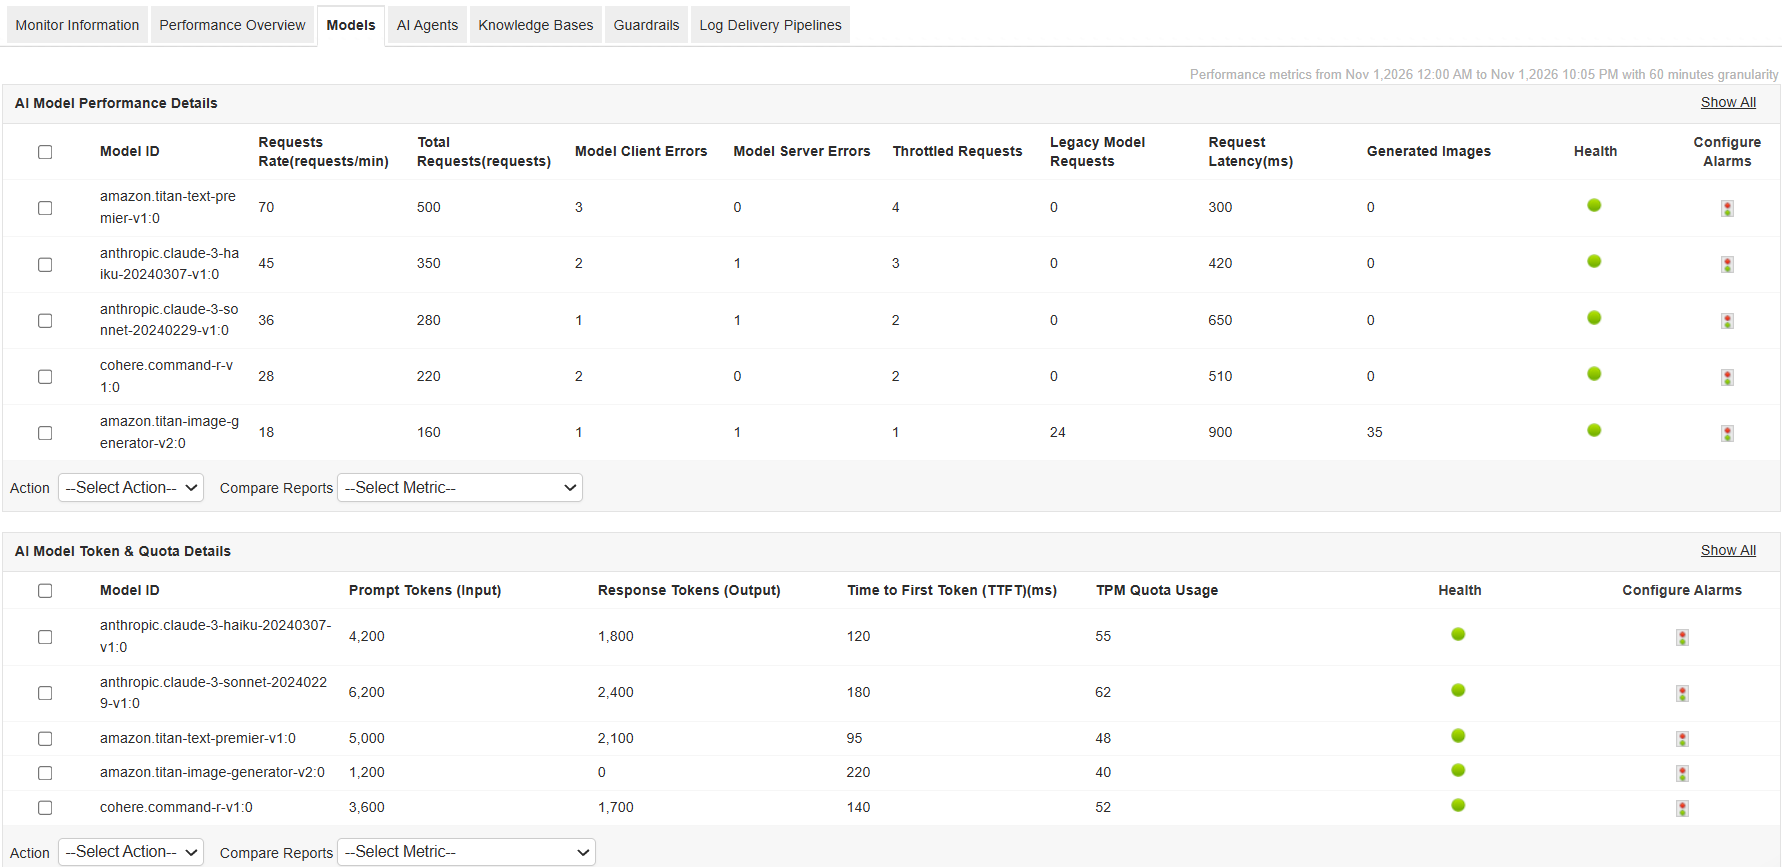
- Track Prompt Tokens (Input), Response Tokens (Output), and Generated Images to monitor foundation model usage and manage generative AI costs.
- Monitor TPM Quota Usage by region and foundation model to identify high token consumption and prevent throttling.
- Measure Request Latency and Time to First Token (TTFT) to evaluate responsiveness for standard and streaming requests.
- Track Total Requests, Model Client Errors, Model Server Errors, and Throttled Requests to identify traffic spikes, failures, and quota-related issues. Use the model-level view to compare individual foundation models.
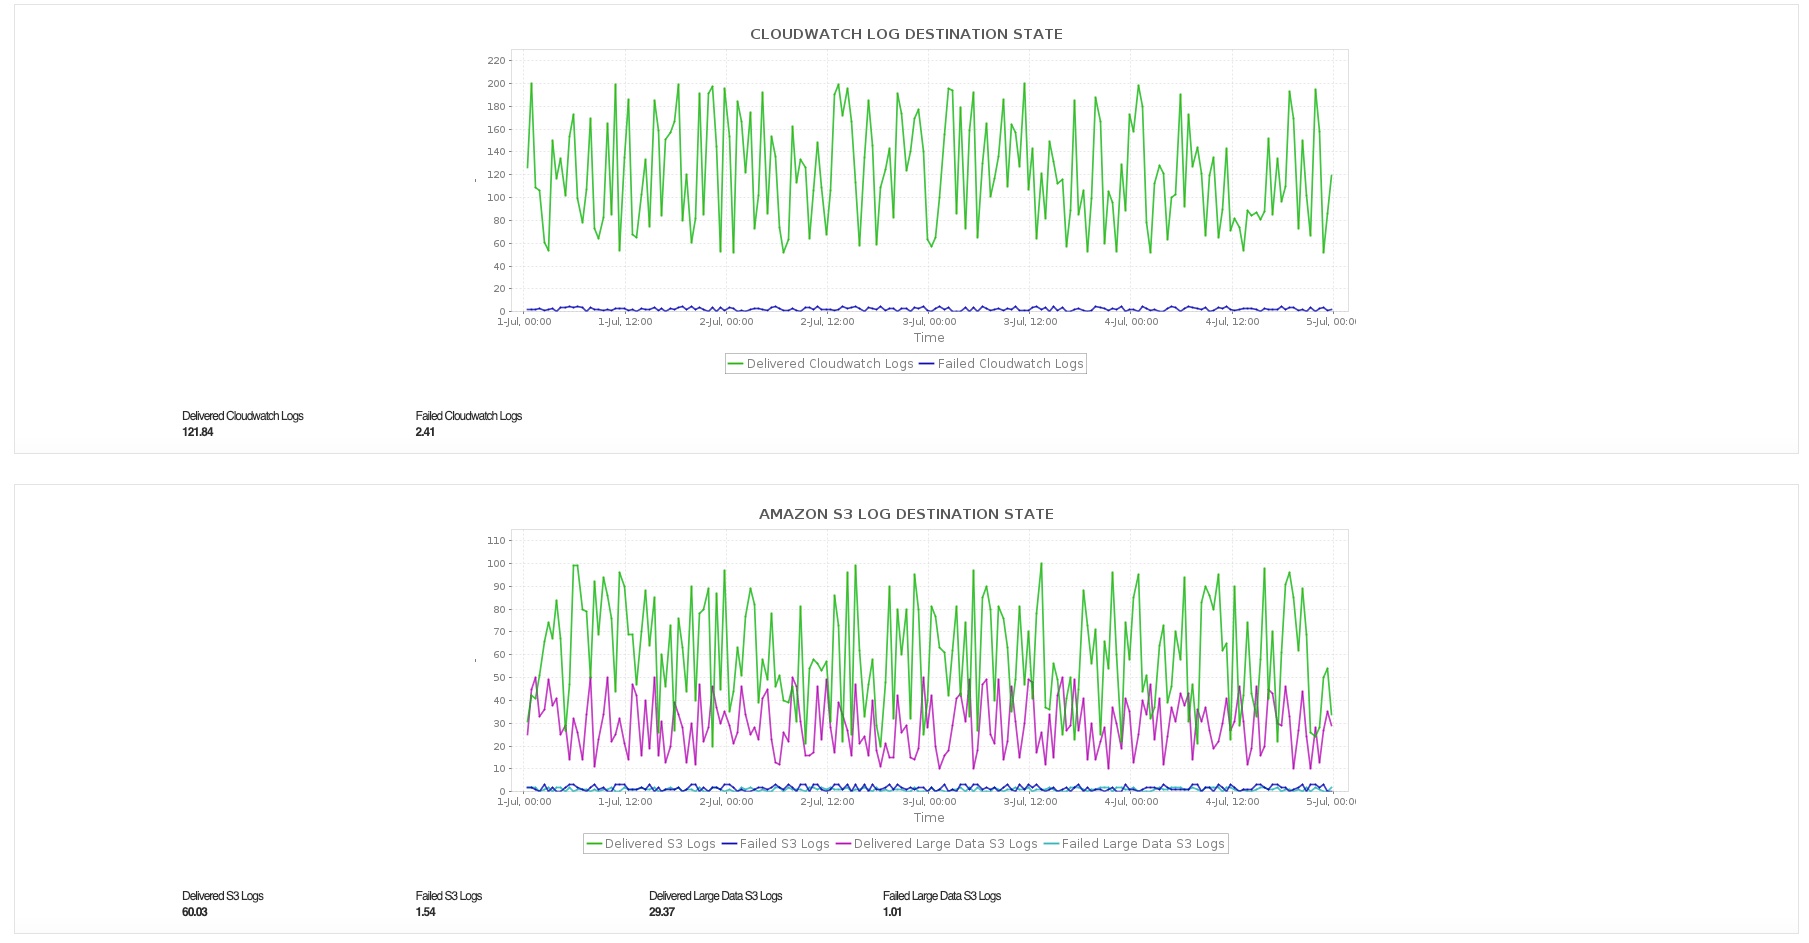
- View the inventory of agents, knowledge bases, and guardrails, including the Agent ID associated with Amazon Bedrock Agents Classic, and track successful and failed log deliveries to CloudWatch Logs and Amazon S3, including large data logs.
Amazon Bedrock Agents Classic monitoring
Amazon Bedrock Agents is a feature of Amazon Bedrock that enables developers to build autonomous AI agents capable of executing multi-step tasks by orchestrating foundation models, APIs, and knowledge bases. Agents interpret natural language instructions, break down complex requests into sequences of actions, invoke tools such as Lambda functions and knowledge bases, and return coherent responses, without requiring custom orchestration logic.
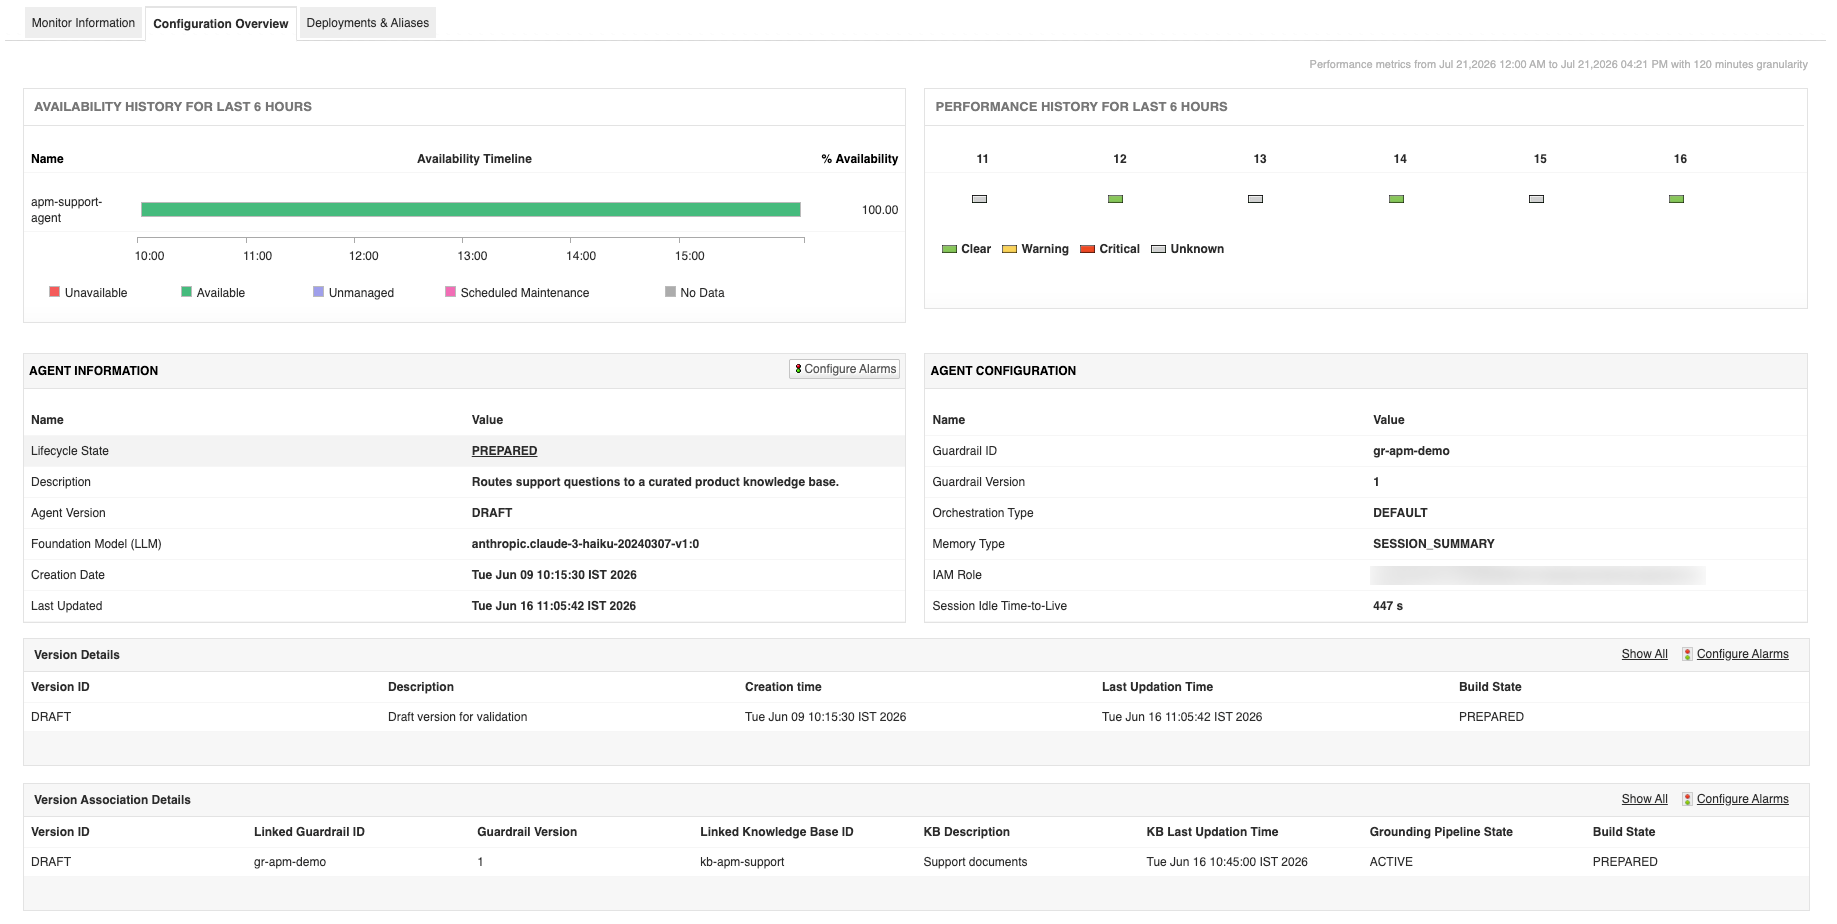
With Applications Manager, you can:
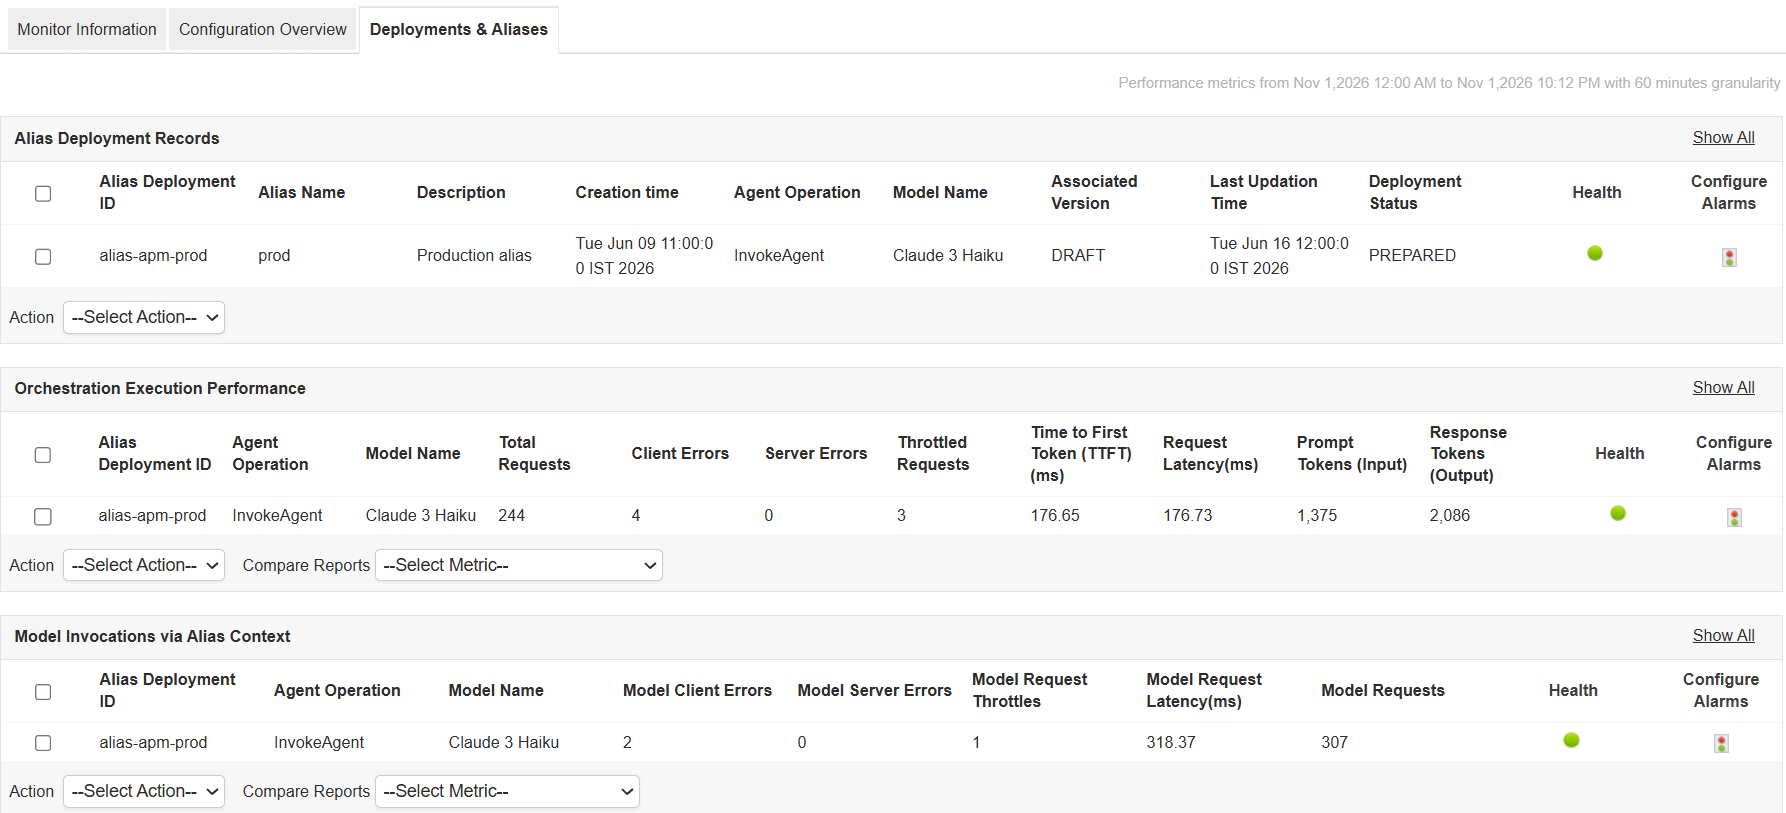
- Monitor alias availability, Deployment Status, and Associated Version to identify affected deployments and verify agent routing.
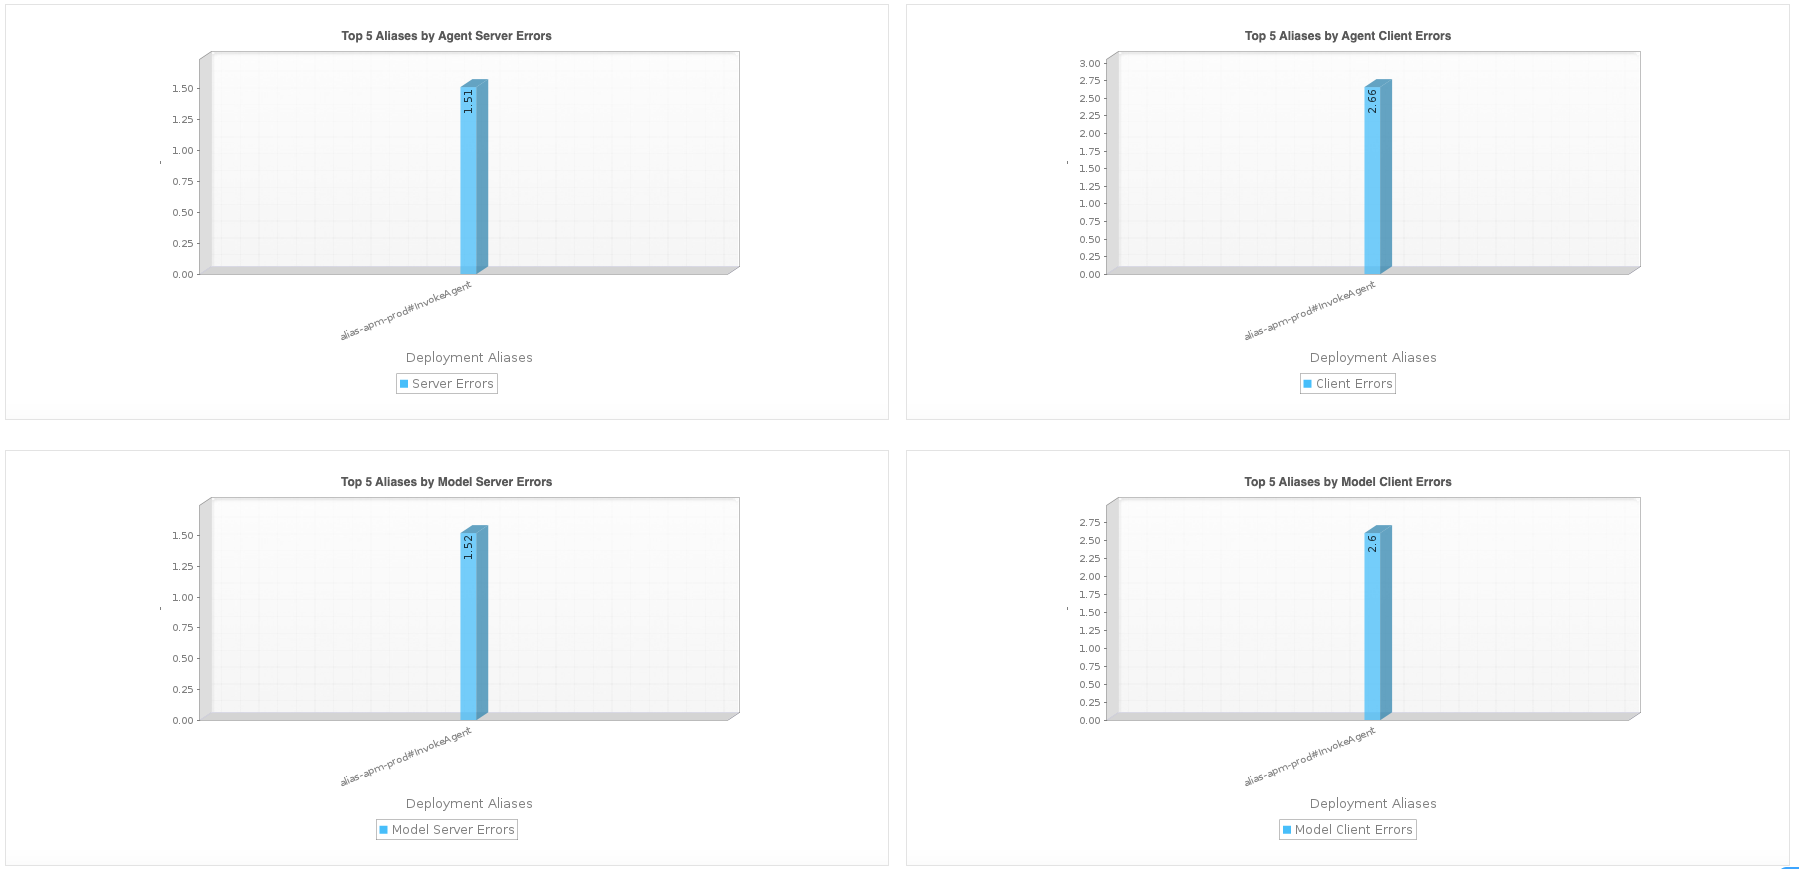
- Track Total Requests, Client Errors, Server Errors, and Throttled Requests per alias, operation, and model to identify orchestration failures.
- Measure Request Latency and Time to First Token (TTFT), and monitor Prompt Tokens (Input) and Response Tokens (Output) per alias to evaluate responsiveness and manage costs.
- Isolate foundation model issues using Model Requests, Model Request Latency, Model Request Throttles, Model Client Errors, and Model Server Errors.
- Review the agent's Lifecycle State, Agent Version, and Foundation Model (LLM), along with its associated Guardrail and Knowledge Base.
Amazon Bedrock AgentCore Harness monitoring
Amazon Bedrock AgentCore Harness is a managed agent harness in Amazon Bedrock AgentCore that runs the agent loop on your behalf. You define the foundation model, tools, memory, and limits, and the harness handles reasoning steps, tool calls, and conversation history, serving callers through endpoints that run on an AgentCore Runtime.
With Applications Manager, you can:
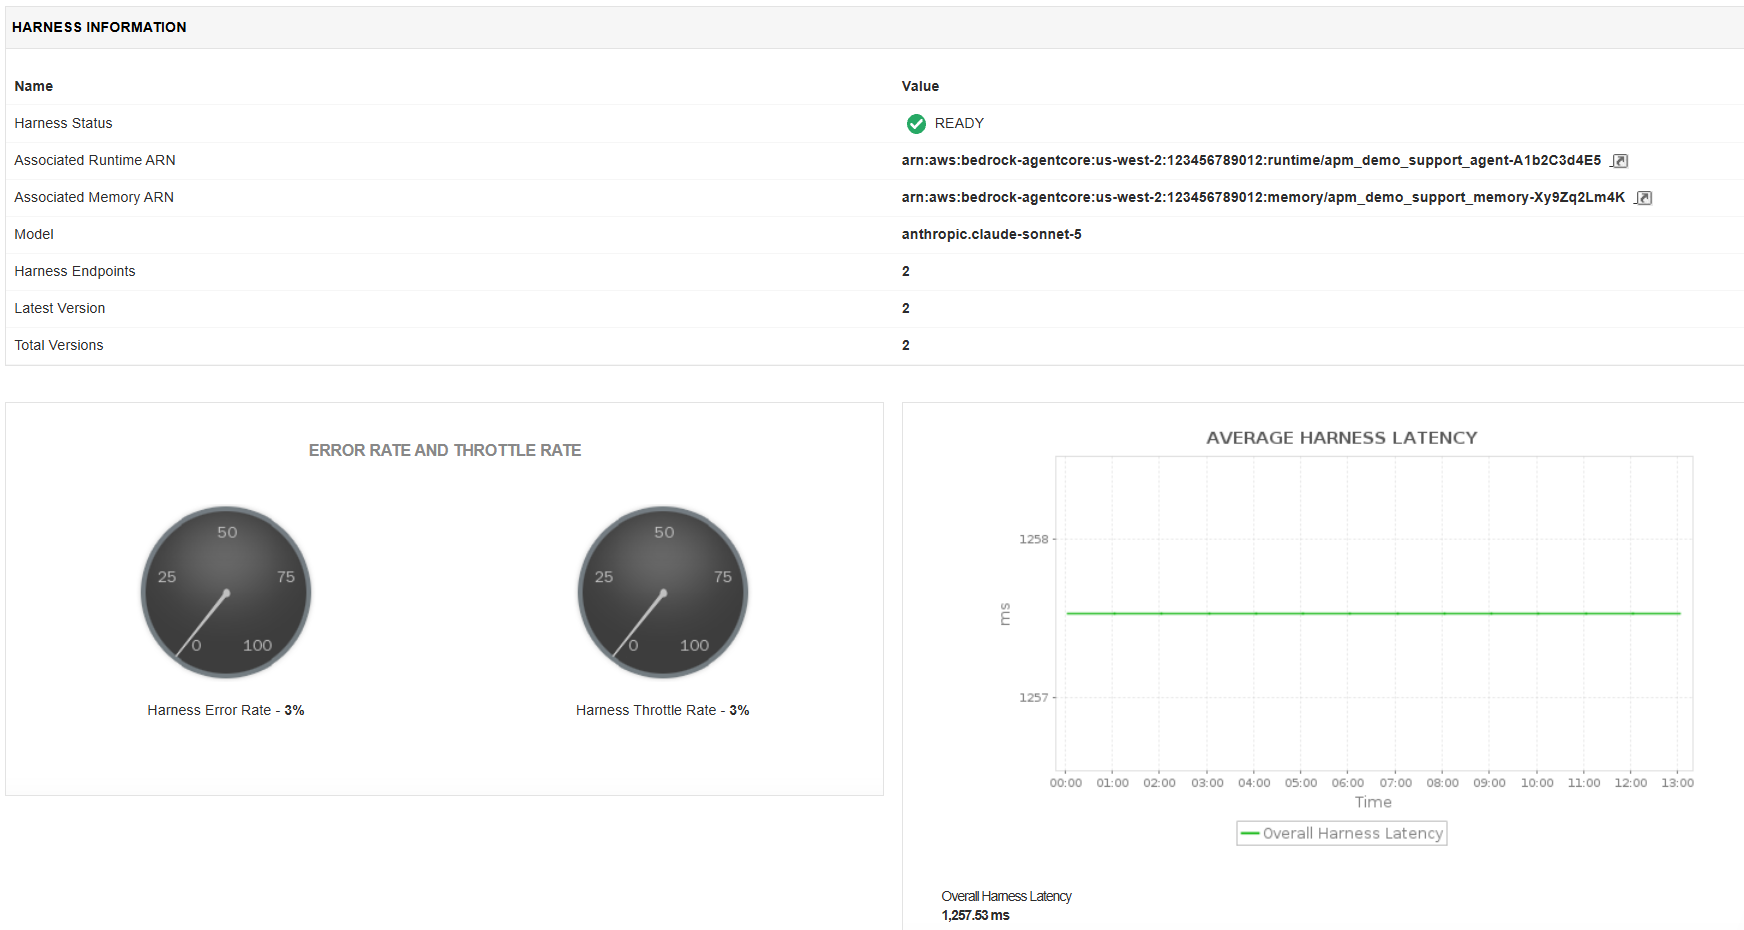
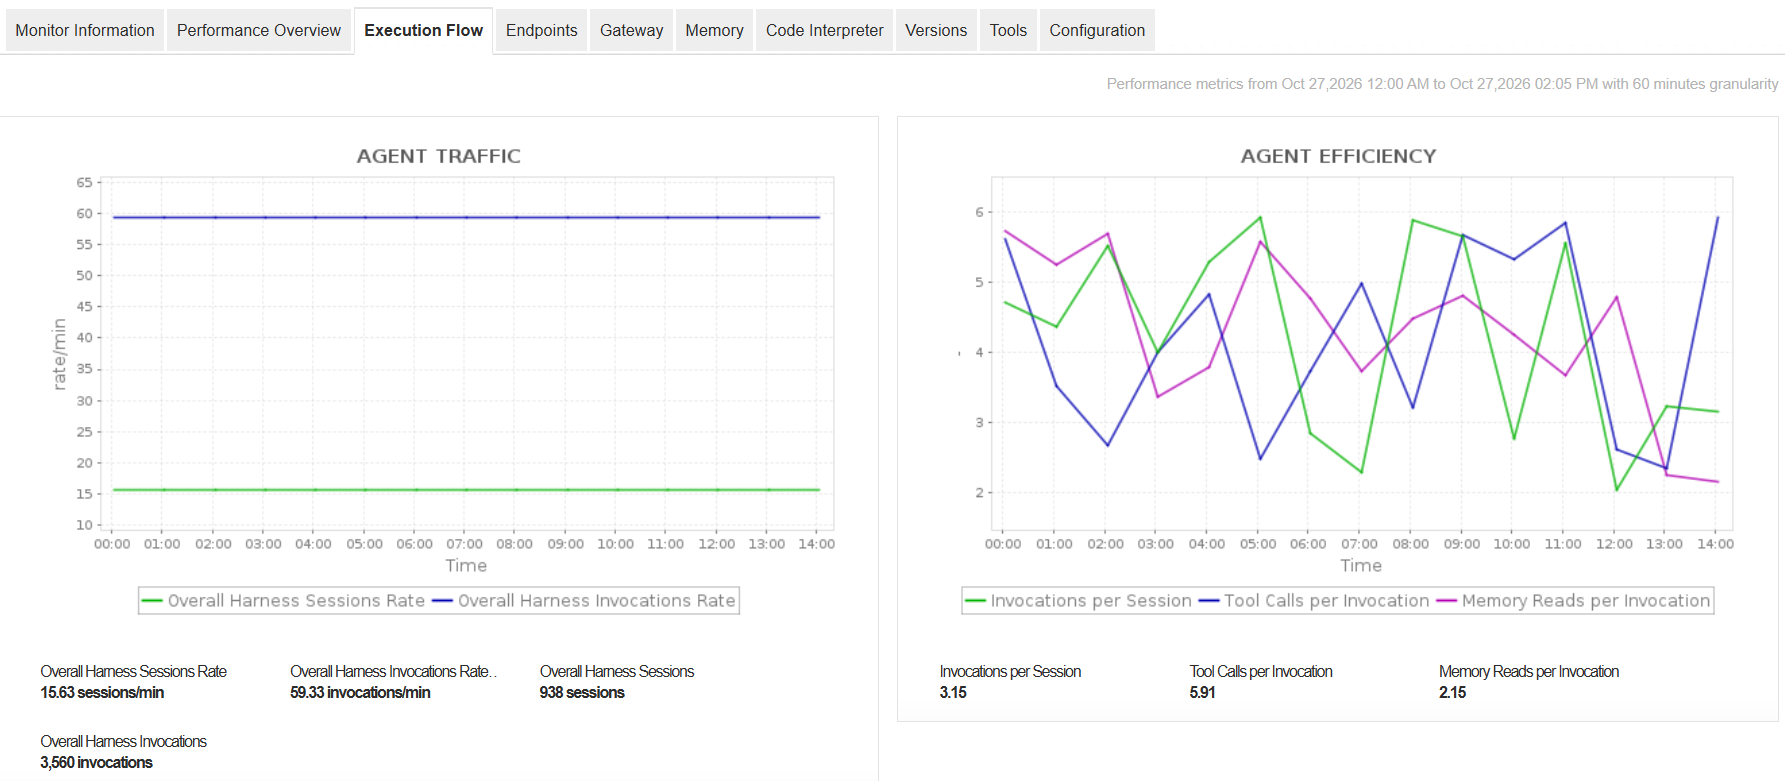
- Monitor Harness Status and overall traffic with Harness Invocations and Sessions, their per-minute rates, and Harness Latency. Track the Harness Error Rate and Harness Throttle Rate to identify failures and quota limits.
- Analyze Agent Efficiency using Invocations per Session, Tool Calls per Invocation (gateway tool calls), and Memory Reads per Invocation.
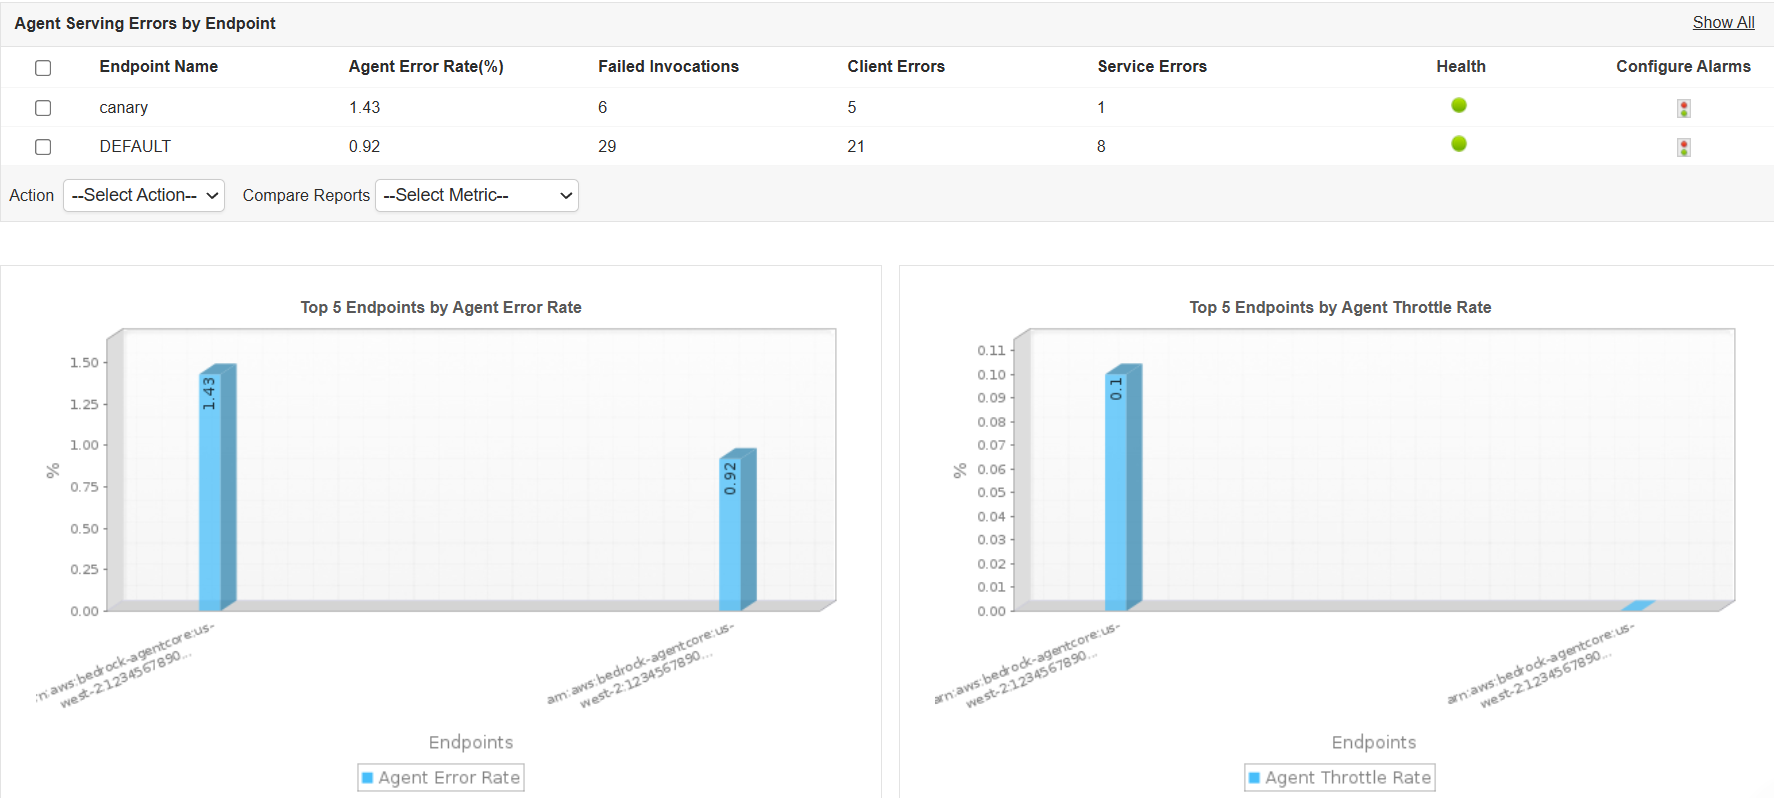
- Review associated endpoints and their Agent Invocations, Agent Sessions, Agent Latency, Agent Error Rate, and Agent Throttle Rate to compare endpoint performance.
- Identify problematic endpoints using the endpoint state breakdown (Ready, Failed, and In Transition) and the Top 5 Endpoints graphs by Agent Error Rate and Agent Throttle Rate.
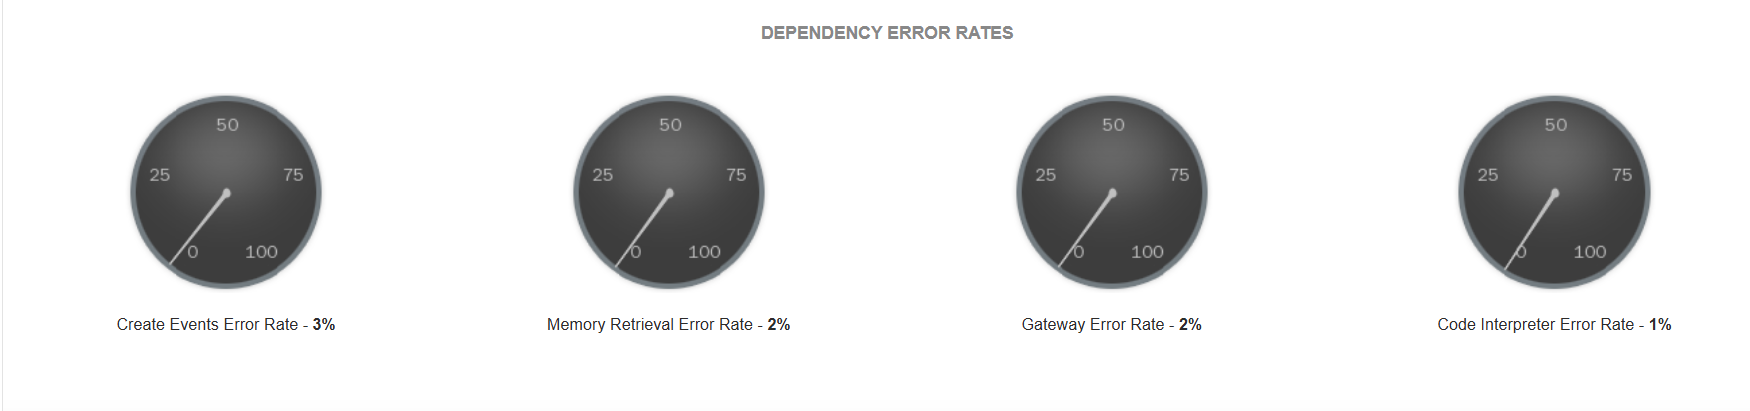
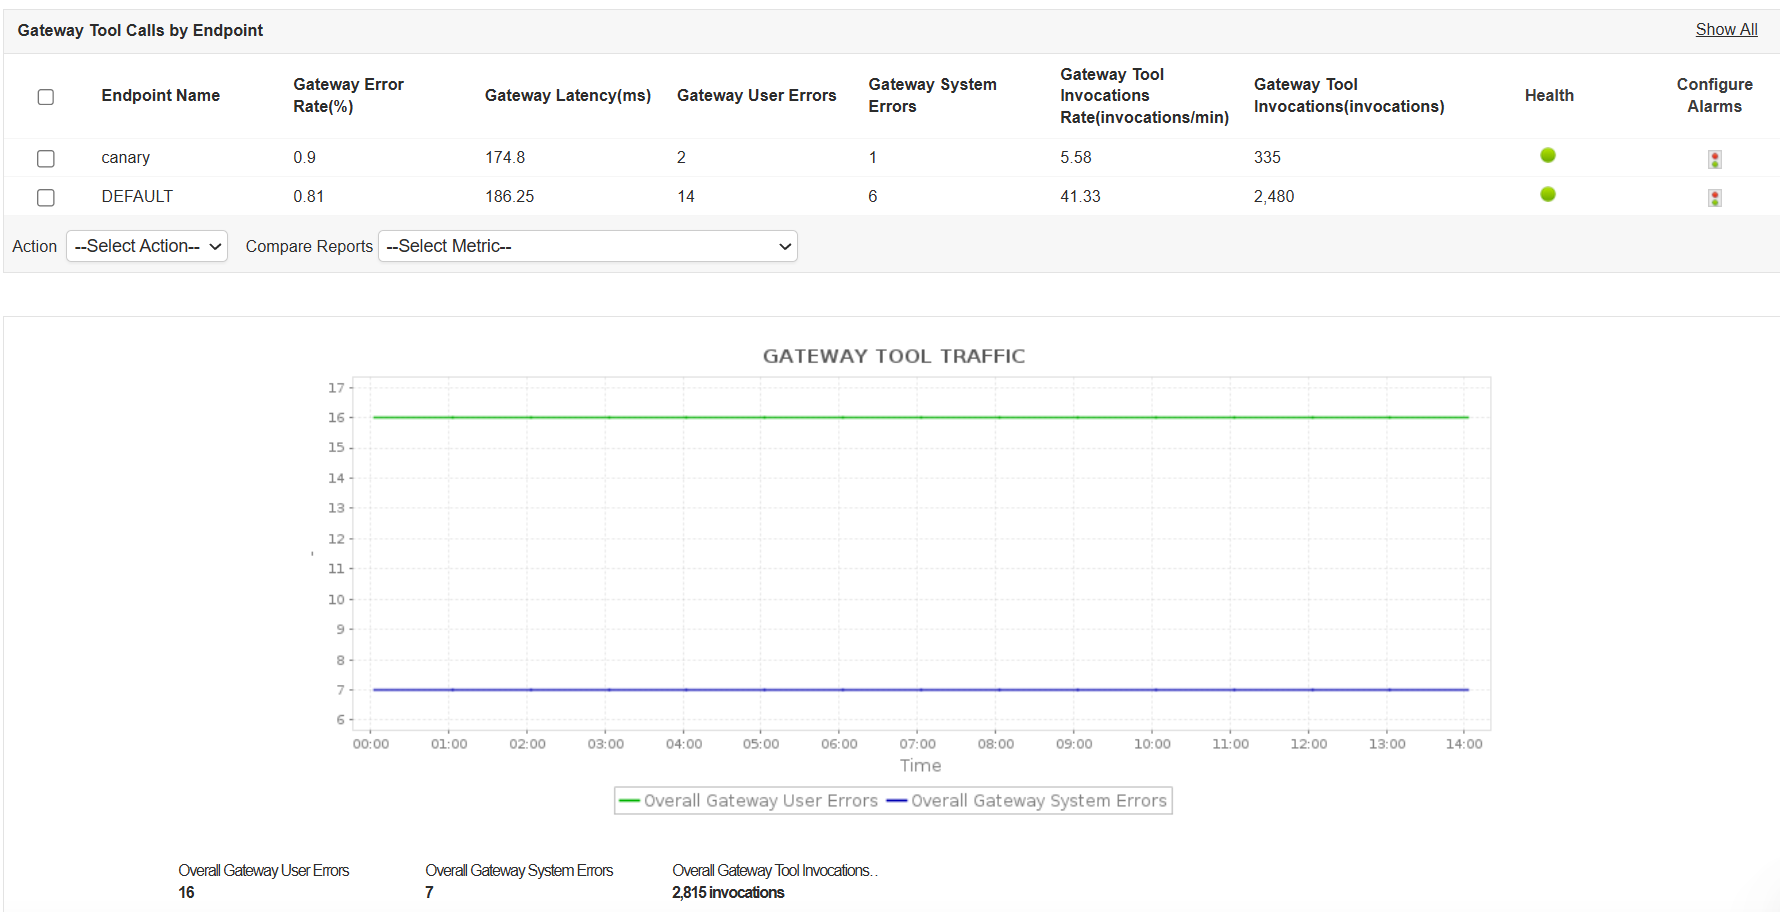
- Monitor Gateway activity with Gateway Tool Invocations, Gateway Latency, and Gateway Error Rate.
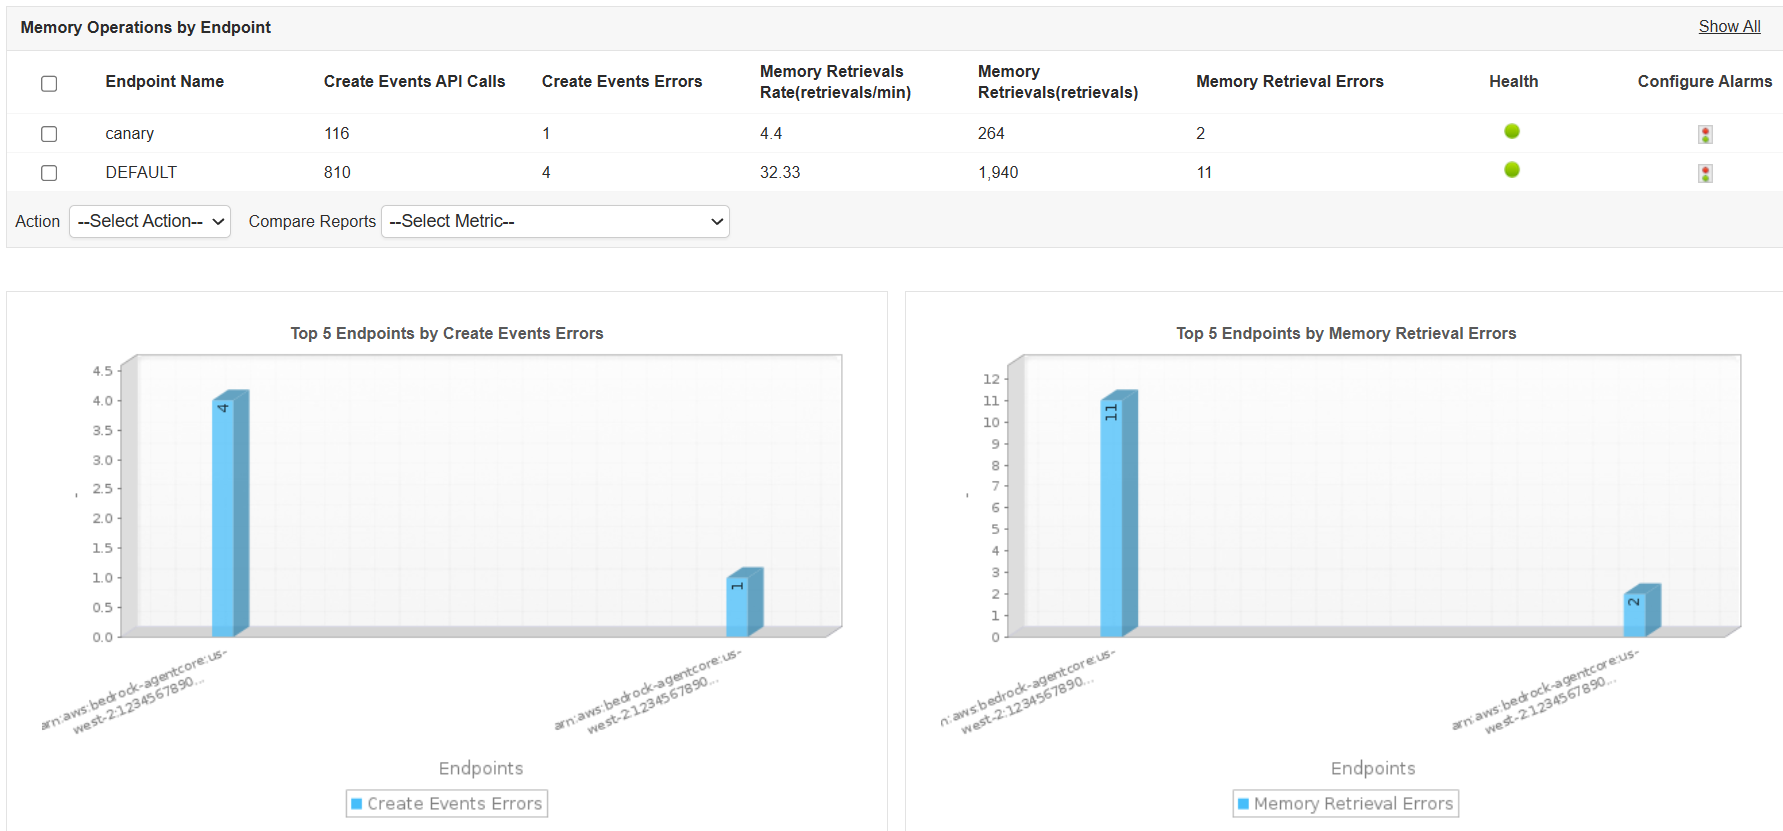
- Track Memory activity through Create Events API Calls and Memory Retrievals, along with their respective error rates, and monitor Code Interpreter usage through Sessions, Invocations, and Error Rate.
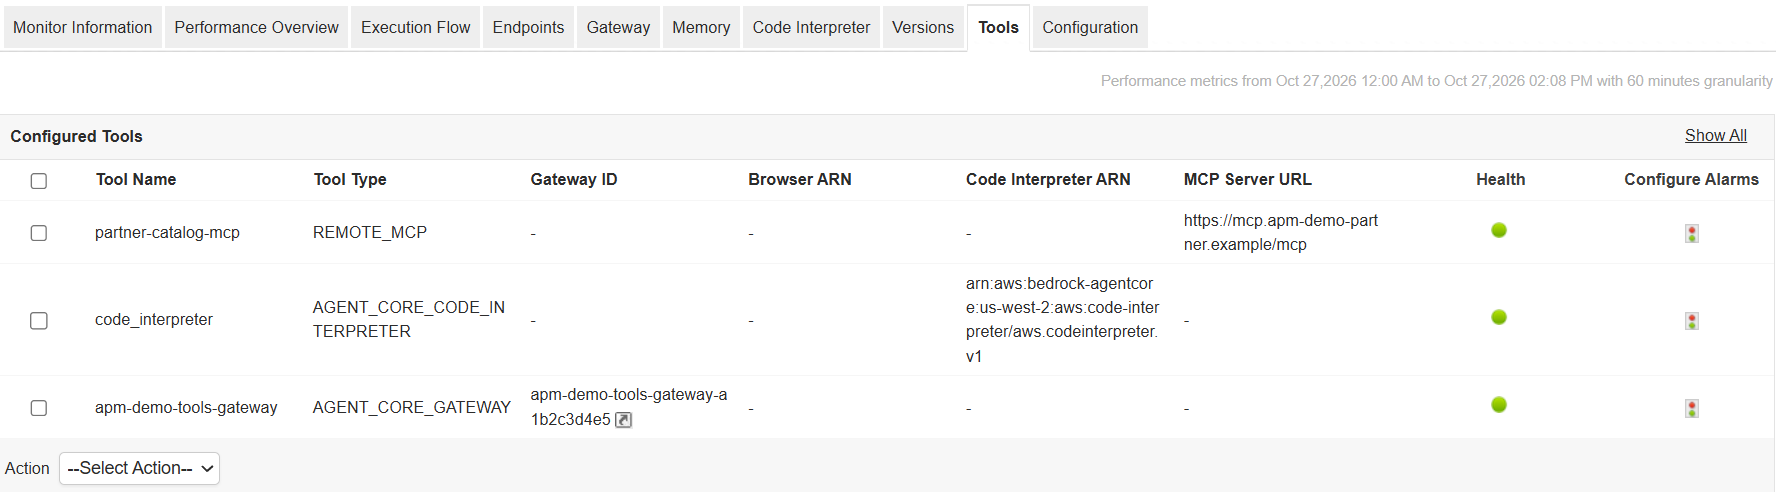
- Review Configured Tools by Tool Name and Tool Type, including their associated Gateway, Browser, Code Interpreter, or MCP Server.
- Verify harness versions using Version Status and Version Failure Reason, and view the associated Runtime, Memory, and Model. Runtime, Memory, and Gateway can be opened directly when monitored in Applications Manager.
Amazon Bedrock AgentCore Runtime monitoring
Amazon Bedrock AgentCore Runtime is a secure, serverless runtime for deploying and running AI agents and tools, with support for the MCP, HTTP, A2A, and AGUI server protocols. It hosts agent code in isolated sessions and exposes it through versioned endpoints, without requiring you to manage the underlying infrastructure.
With Applications Manager, you can:
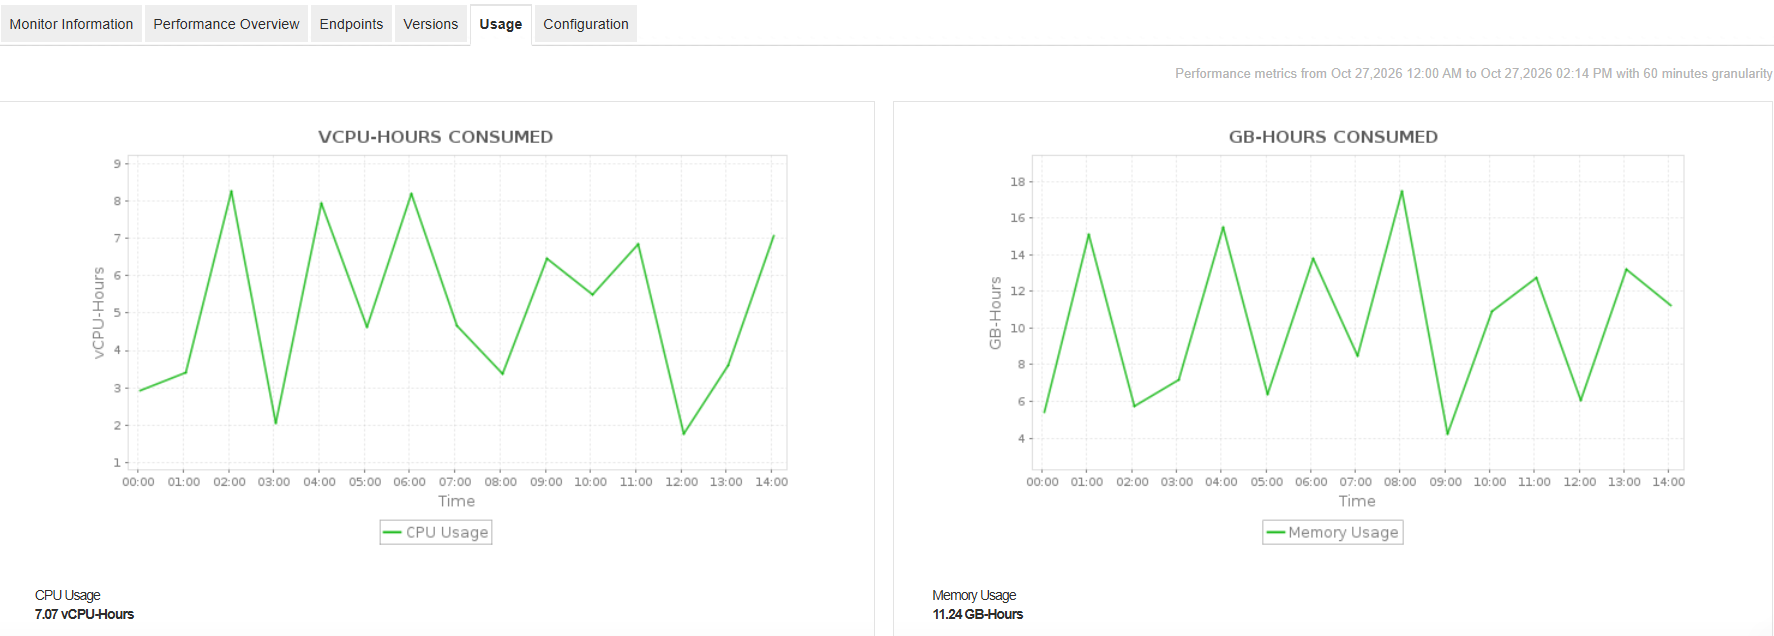
- Monitor resource consumption through CPU Usage and Memory Usage, reported in vCPU-Hours and GB-Hours, to manage compute costs.
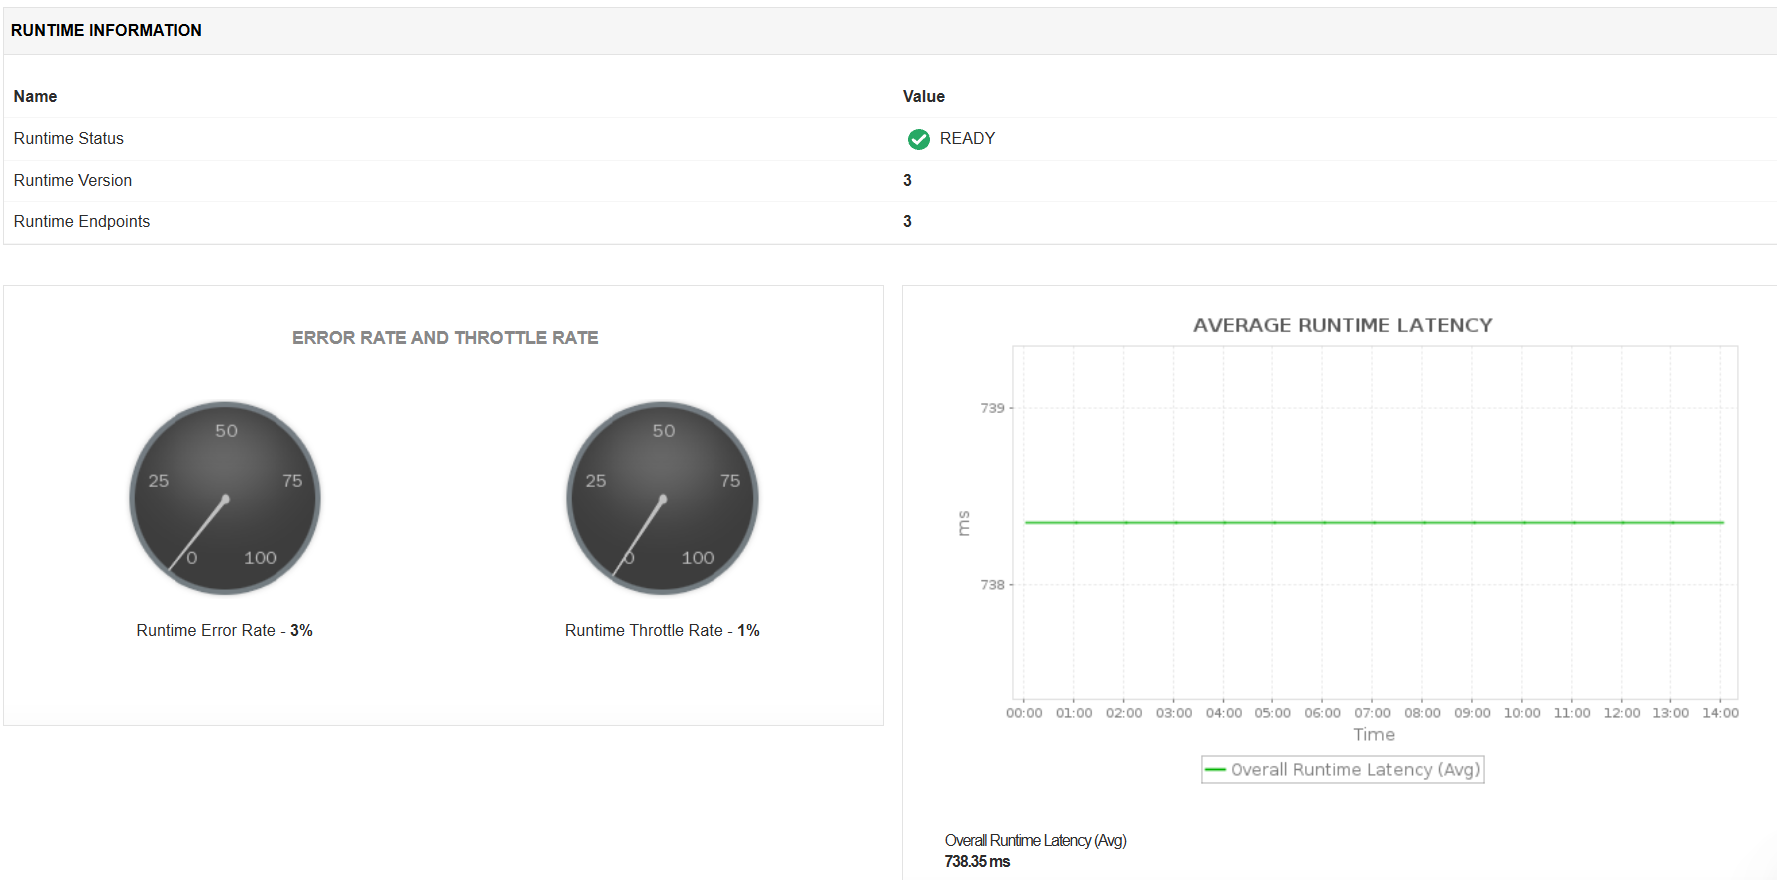
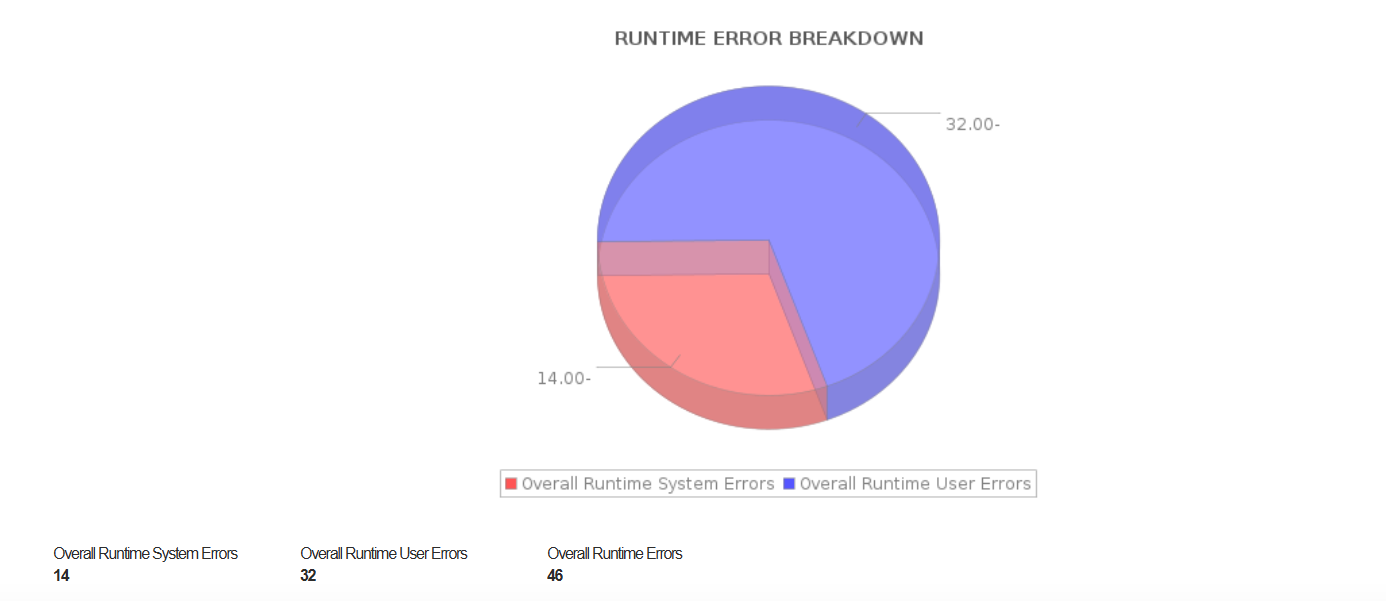
- Track Invocations, Sessions, and Latency, including per-minute invocation and session rates, along with the Runtime Error Rate and Runtime Throttle Rate to assess traffic and reliability.
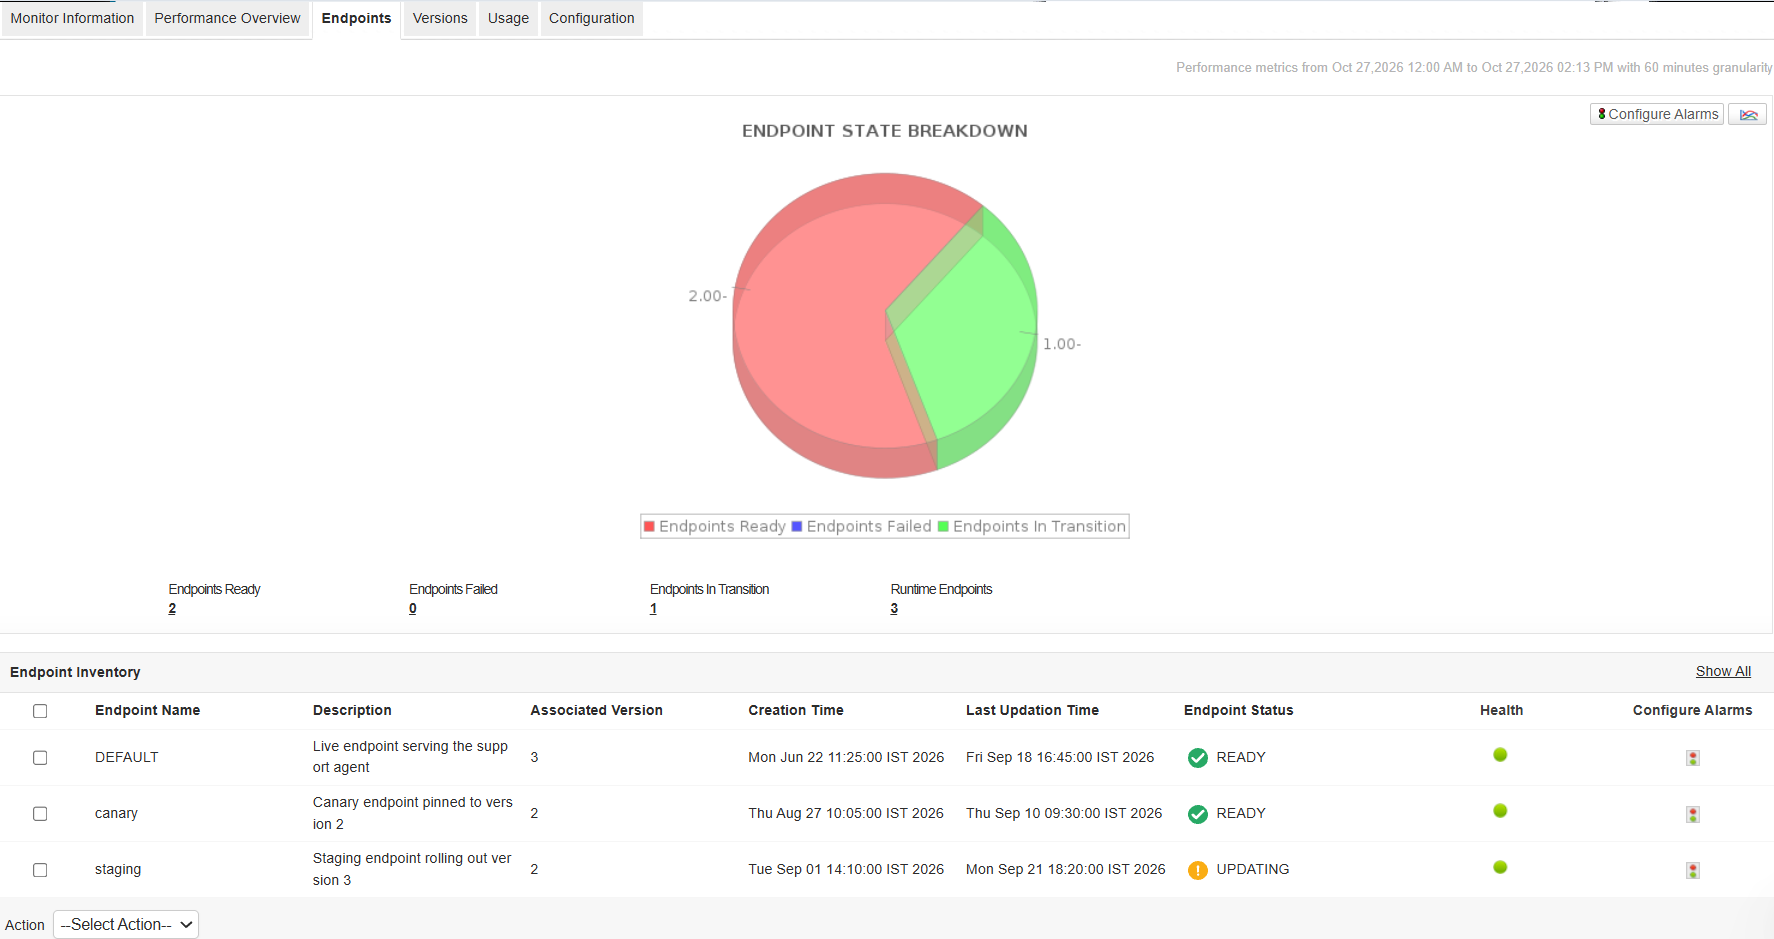
- Review monitored endpoints and their invocations, sessions, latency, error rate, and throttle rate to identify performance issues.
- Monitor the endpoint state (Ready, Failed, and In Transition), Failure Reason, and Top 5 Endpoints by Error Rate and Throttle Rate to identify problematic deployments.
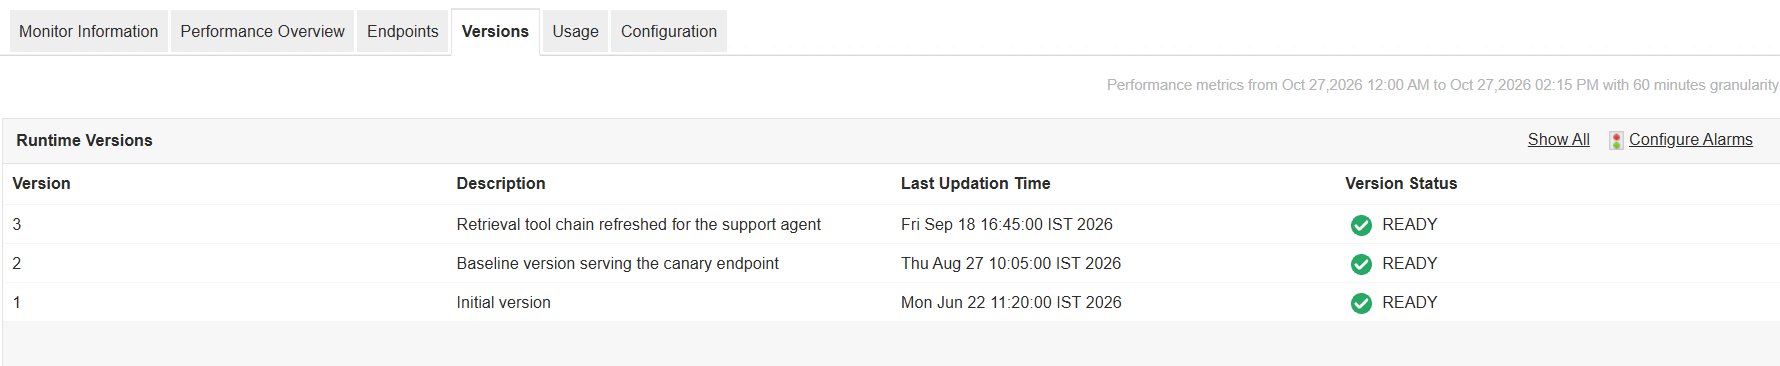
- Review the runtime's Runtime Status, Runtime Version, Server Protocol, and Version Status to verify its configuration and deployment readiness.
Amazon Bedrock AgentCore Memory monitoring
Amazon Bedrock AgentCore Memory gives AI agents both short-term memory, which holds the events of an ongoing conversation, and long-term memory, which holds records of facts and preferences extracted across sessions. Memory strategies define how events are extracted and consolidated into long-term memory records.
With Applications Manager, you can:
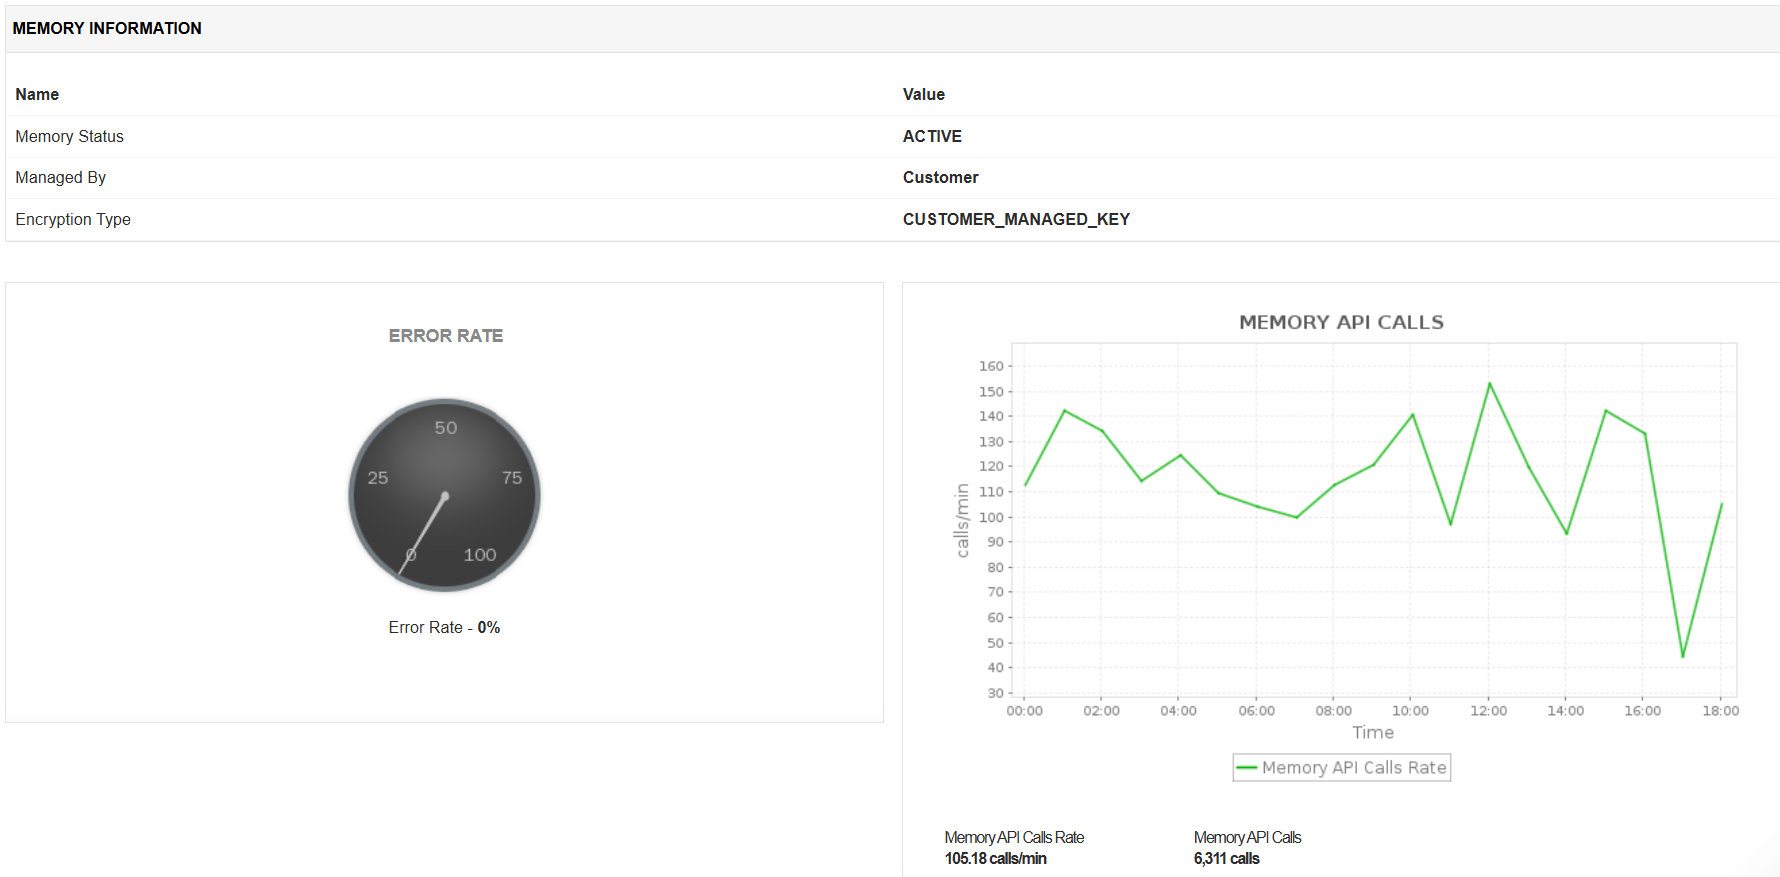
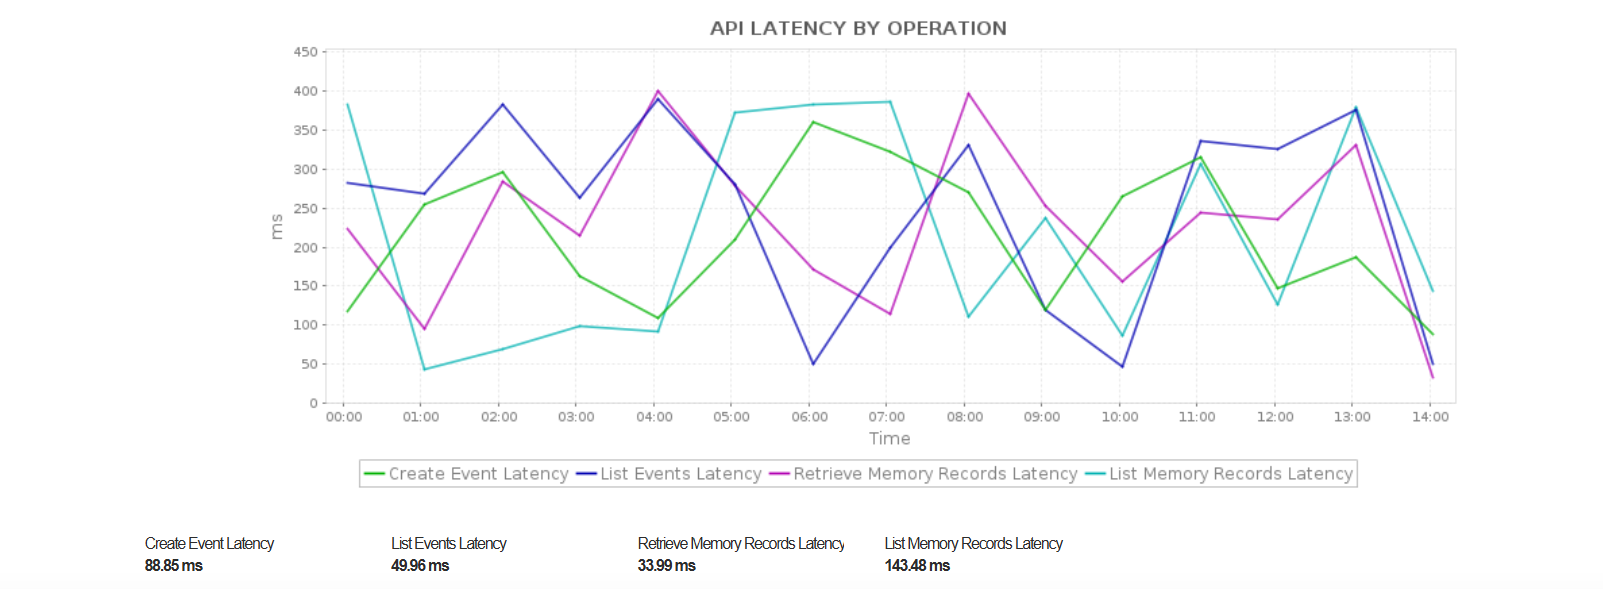
- Monitor the health of Create Event, List Events, Retrieve Memory Records, and List Memory Records operations through API calls, latency, and errors.
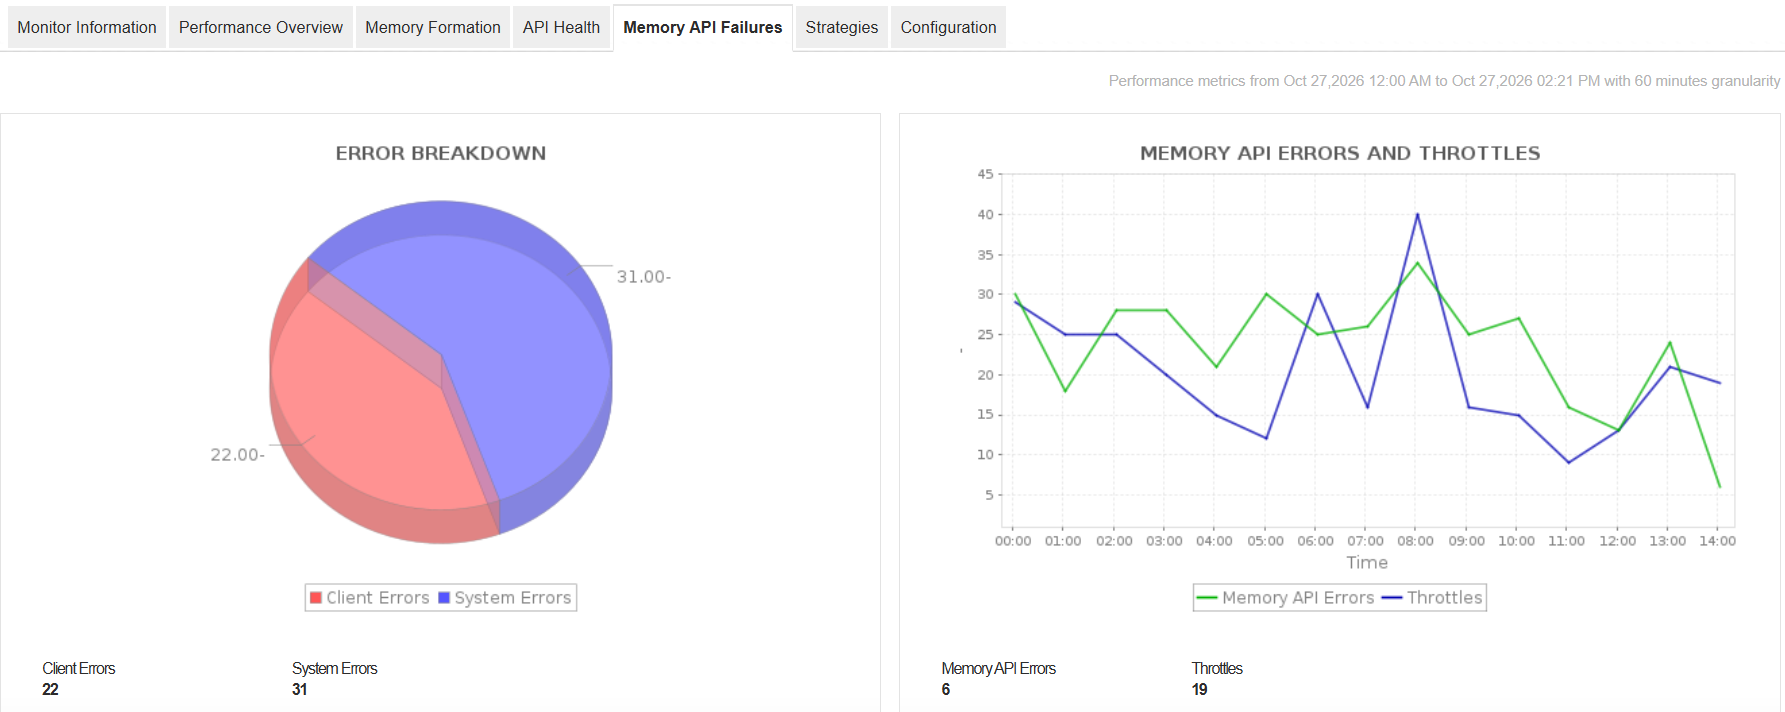
- Identify memory API failures by operation using Errors, User Errors, System Errors, Throttles, and Error Rate.
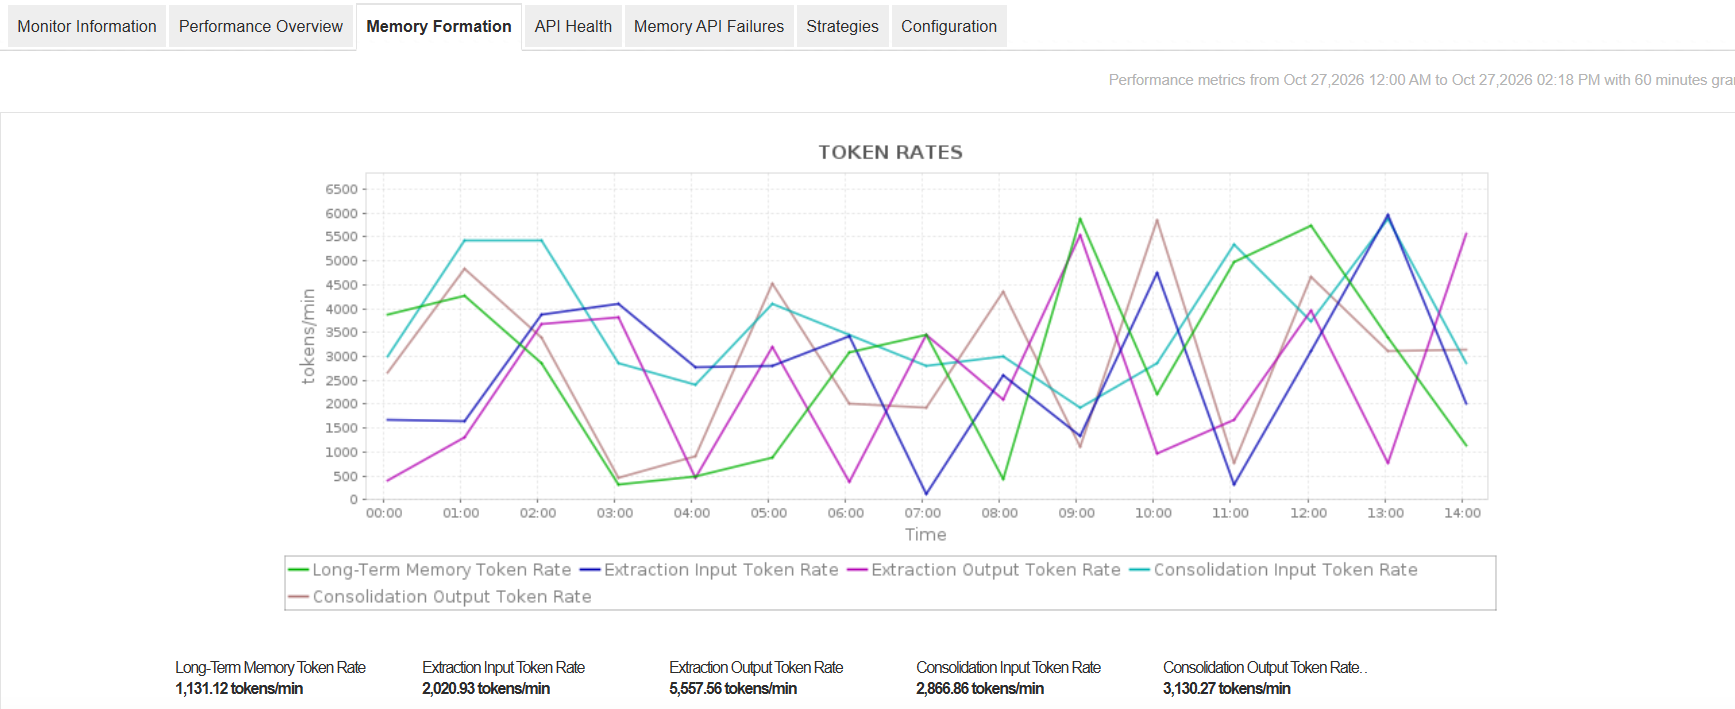
- Track memory formation through Short-Term Memory Events, New Long-Term Memory Records, Memory Formation Ratio, and Extraction and Consolidation Input and Output Tokens.
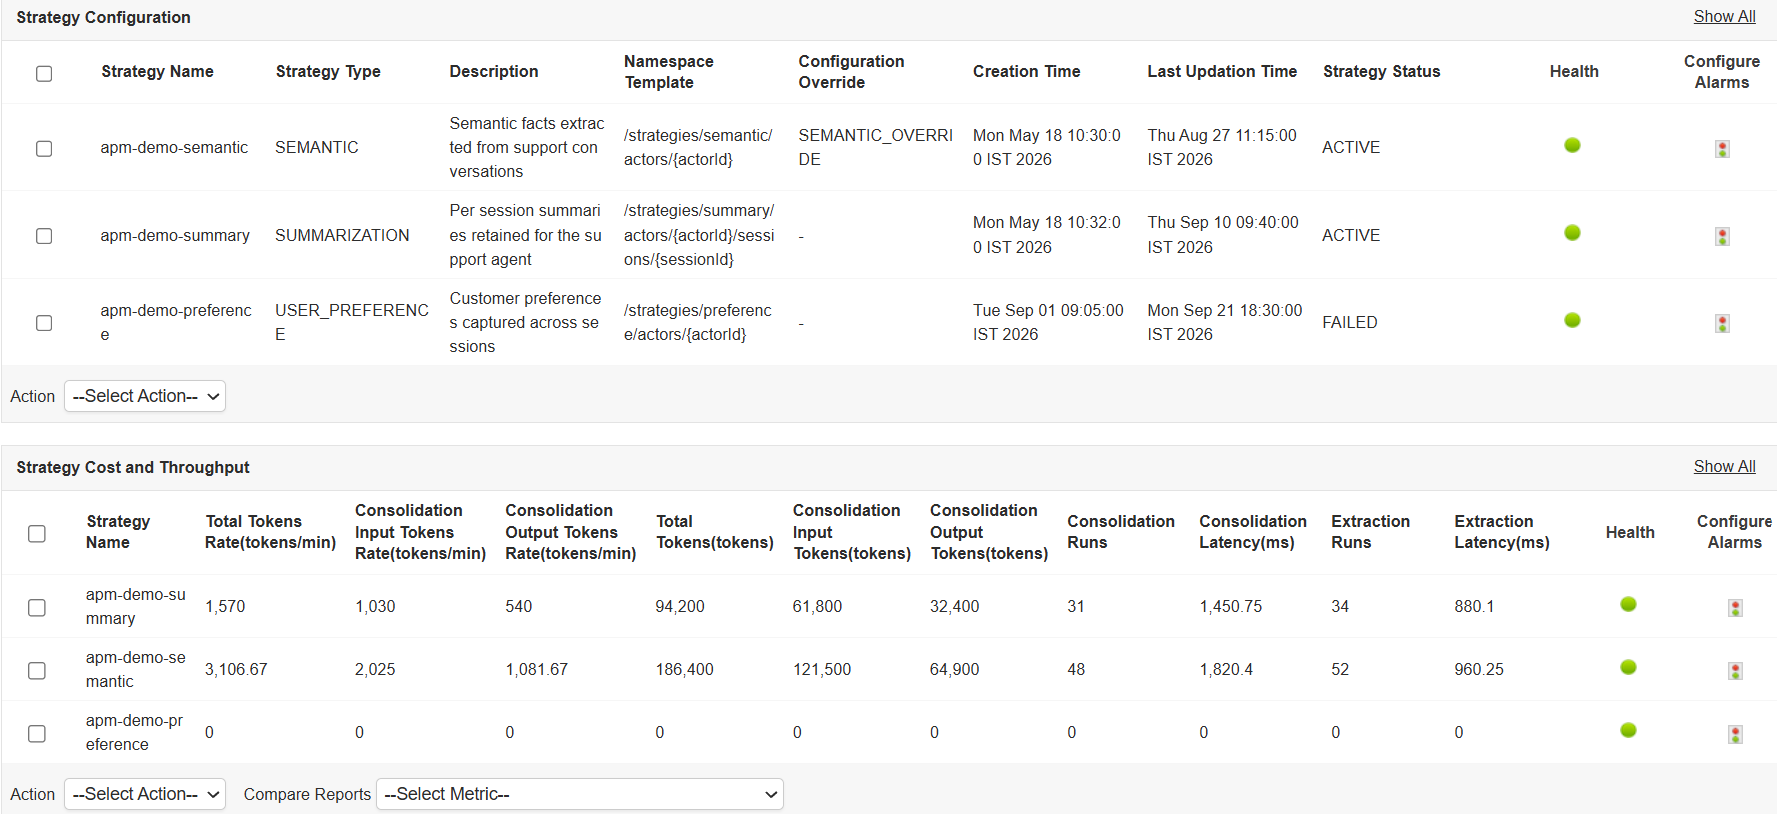
- Review memory strategies using Active and Failed counts, Extraction and Consolidation Runs and Latencies, and Top Strategies by Consolidation Latency and Total Tokens. Check Memory Status, encryption, and the associated KMS key.
Amazon Bedrock AgentCore Gateway monitoring
Amazon Bedrock AgentCore Gateway gives agents a single, secure MCP endpoint through which they can discover and call tools. It connects backend targets, such as Lambda functions, OpenAPI and Smithy APIs, API Gateway stages, and MCP servers, and exposes them to agents as tools.
With Applications Manager, you can:
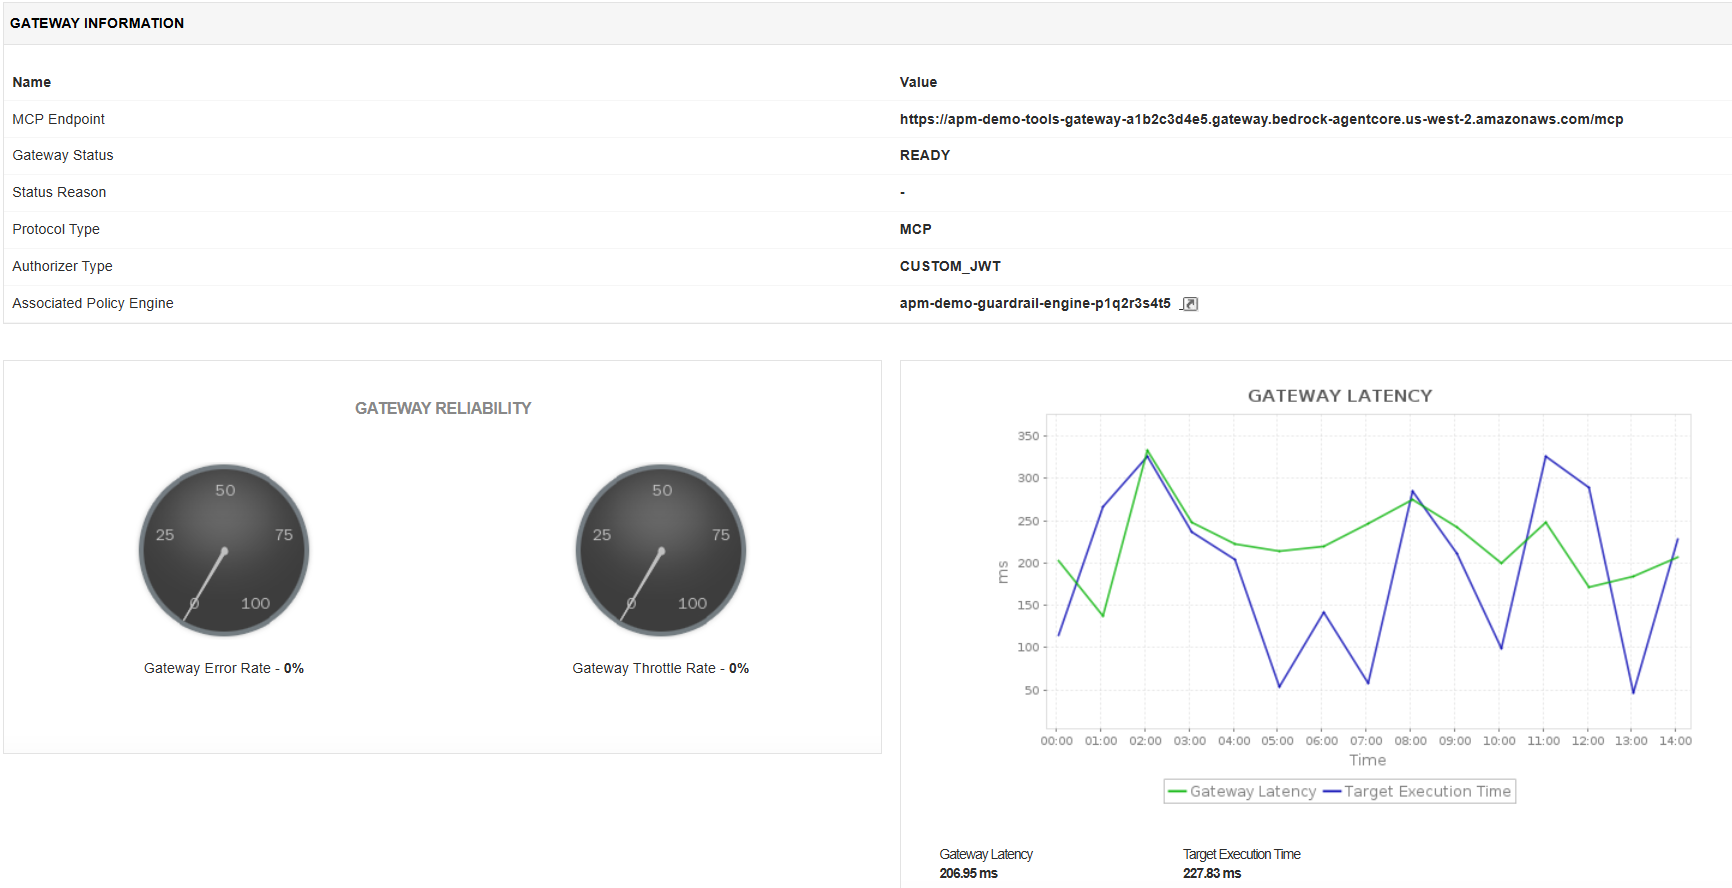
- Monitor Gateway Invocations, Gateway Throttles, Gateway Latency, Gateway Error Rate, and Gateway Throttle Rate to evaluate MCP endpoint reliability and responsiveness.
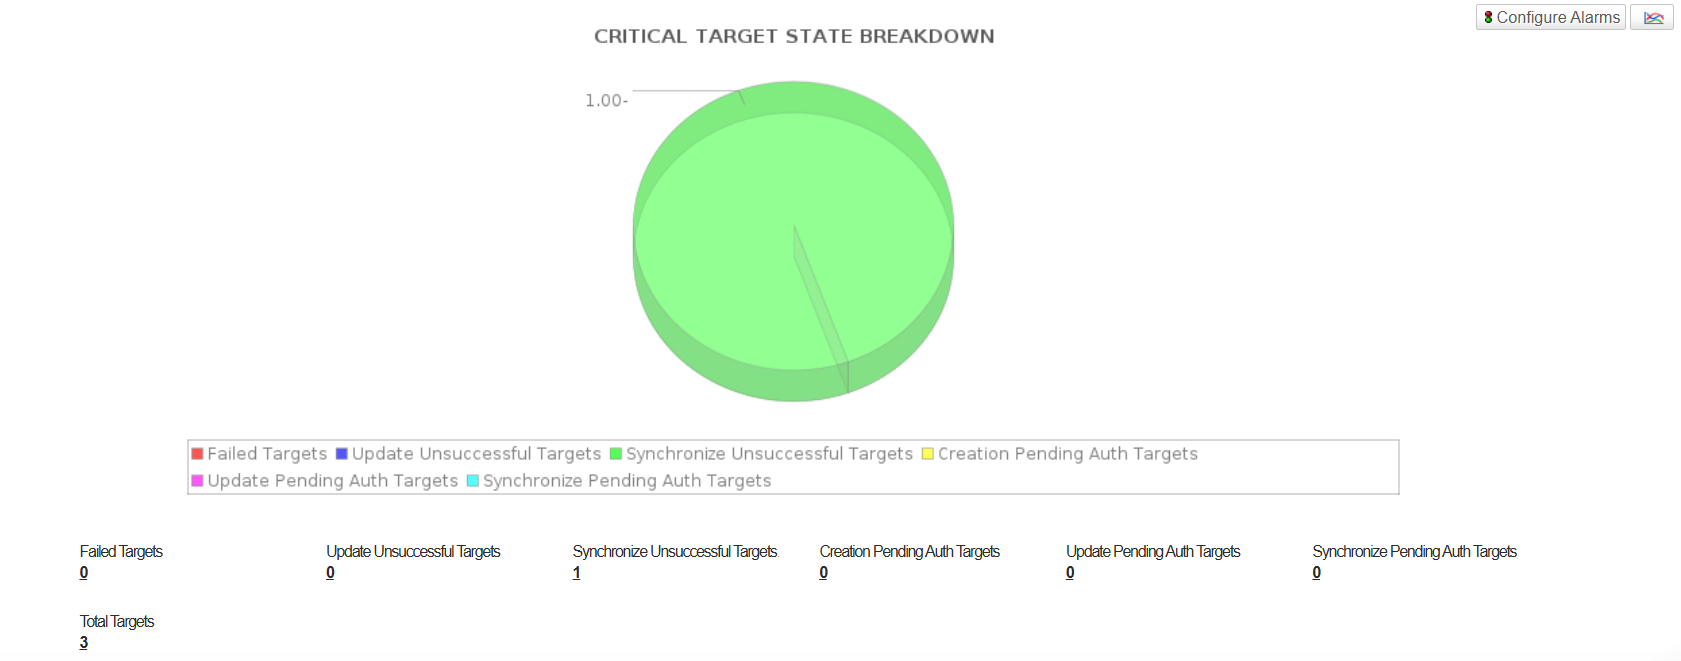
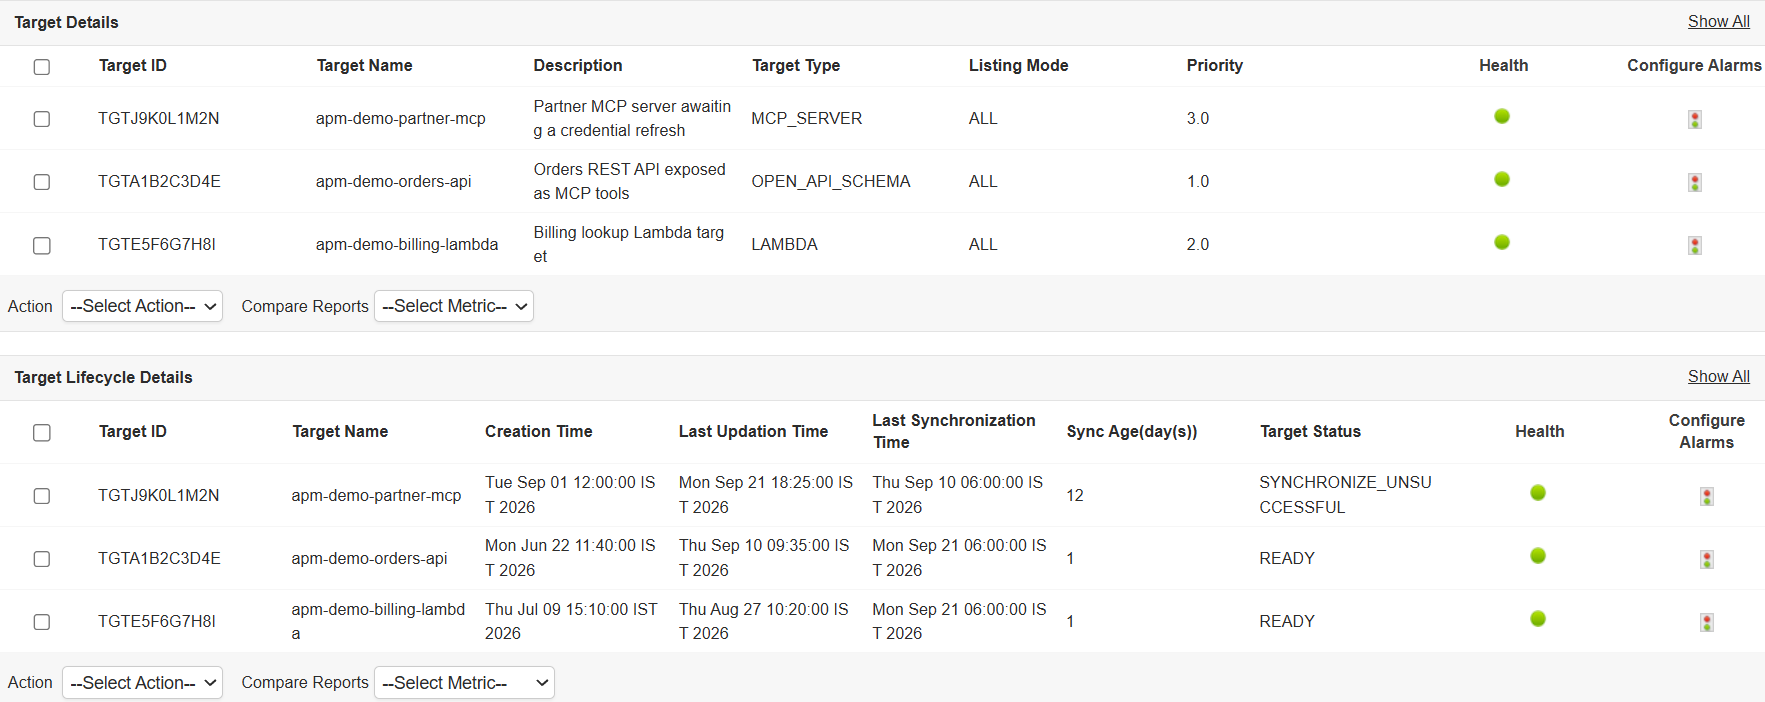
- Identify targets requiring attention using the Critical Target State Breakdown (Failed, Update Unsuccessful, Synchronize Unsuccessful, and Pending Auth) and track Sync Age to identify stale tool schemas.
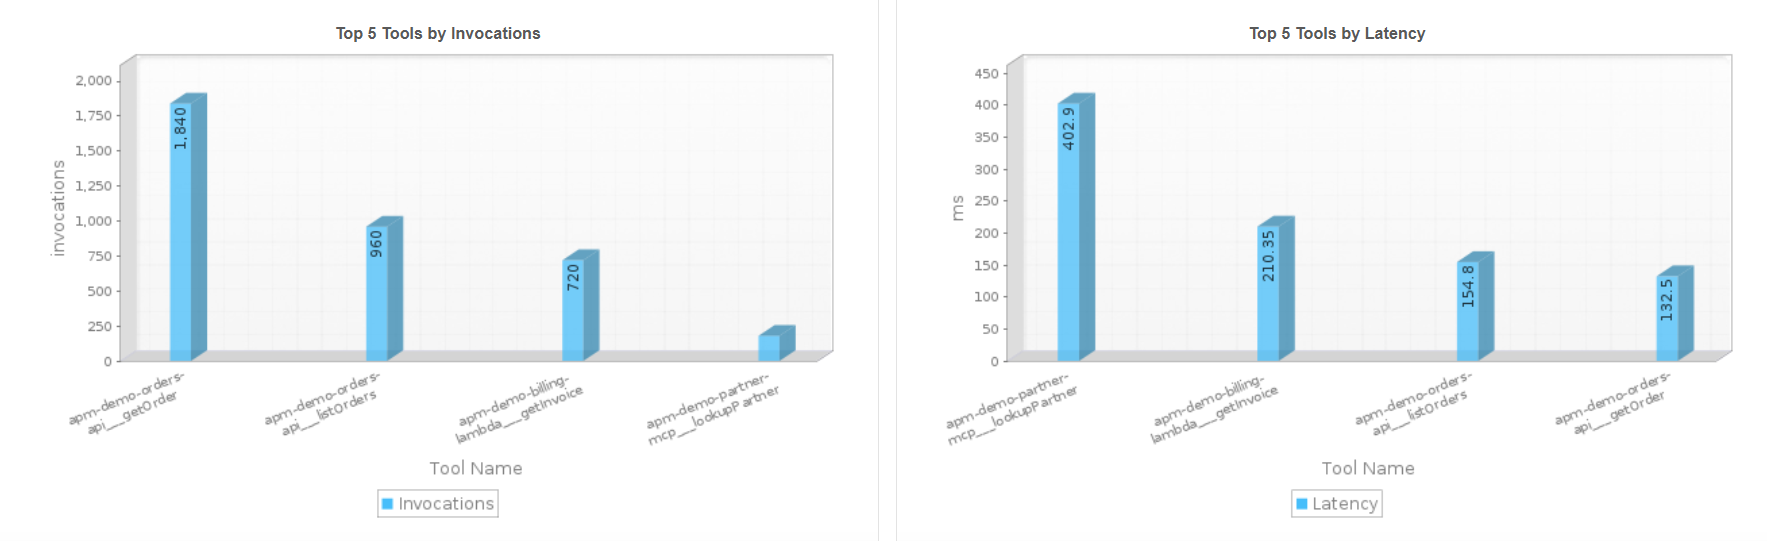
- Analyze per-tool traffic and errors through invocations, latency, execution time, system errors, user errors, and throttles, with Top 5 Tools graphs to identify problematic tools.
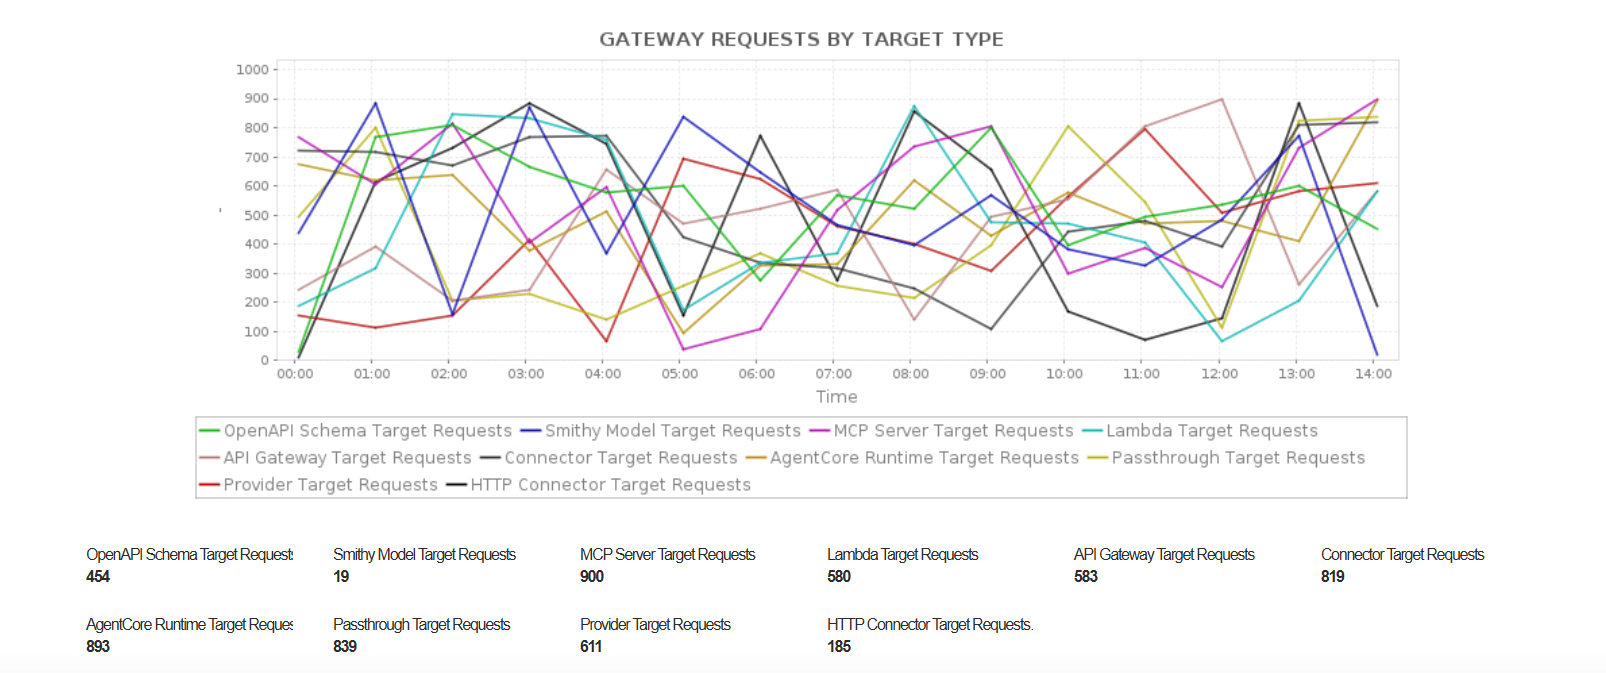
- View Gateway Requests by Target Type across all ten supported types (Lambda, OpenAPI Schema, Smithy Model, MCP Server, API Gateway, Connector, AgentCore Runtime, Passthrough, Provider, and HTTP Connector) to understand traffic distribution.
- Track authorization through Allow Decisions, Deny Decisions, Mismatched Policies, and Determining Policies by authorization operation. Review Gateway Status, MCP Endpoint, and associated Policy Engine, Lambda, KMS, and WAF resources.
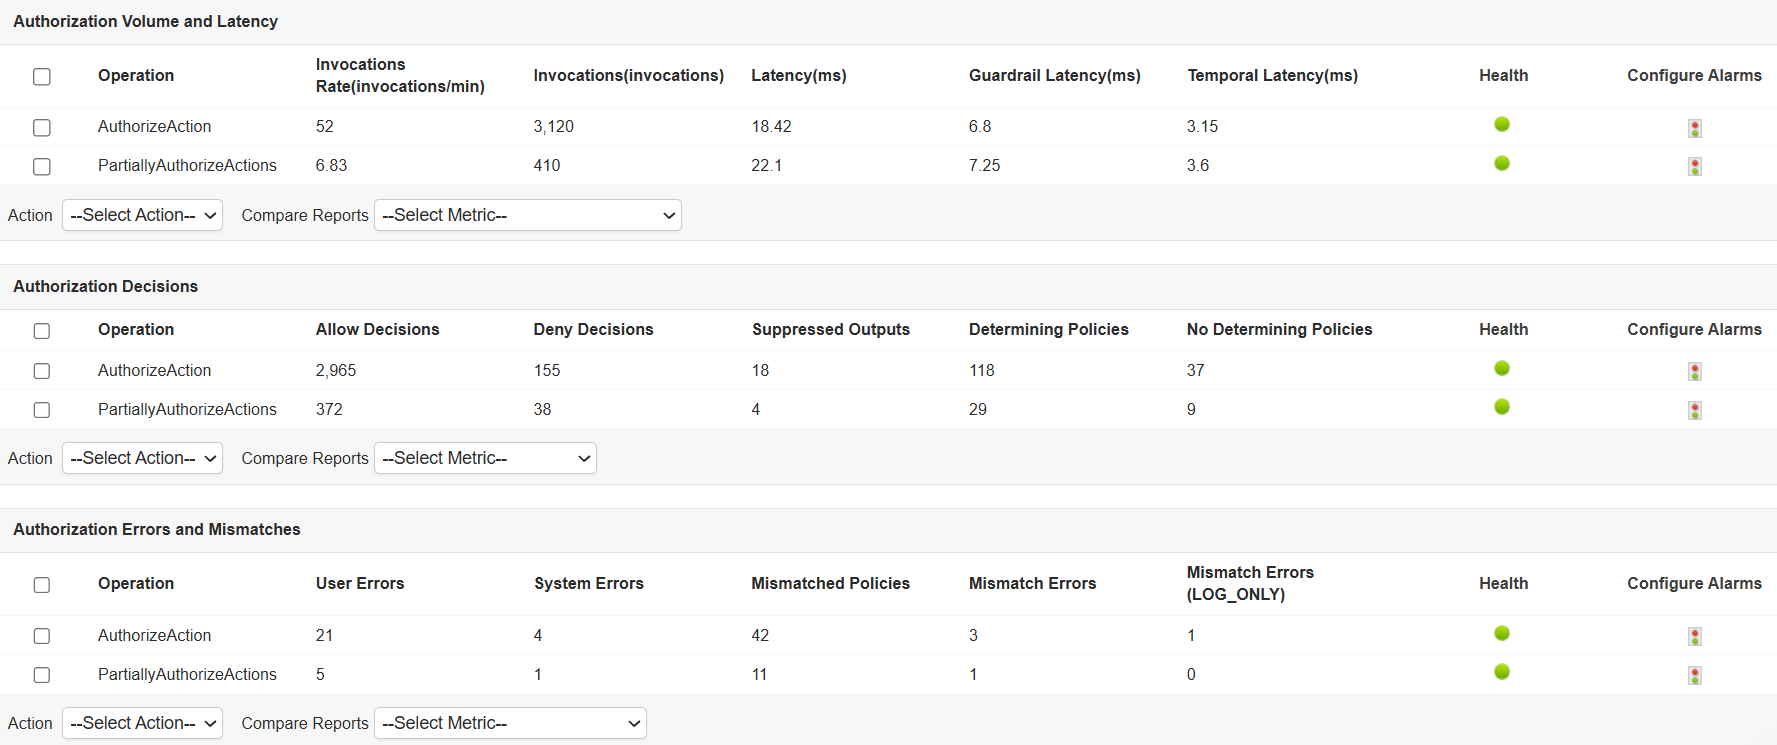
Amazon Bedrock AgentCore Policy Engine monitoring
Amazon Bedrock AgentCore Policy Engine controls what your agents are allowed to do by evaluating authorization requests, such as tool calls made through an AgentCore Gateway, against a set of policies and returning an allow or deny decision. Policies can run in ACTIVE mode, which enforces the decision, or in LOG_ONLY mode, which records what would have happened without blocking requests.
With Applications Manager, you can:
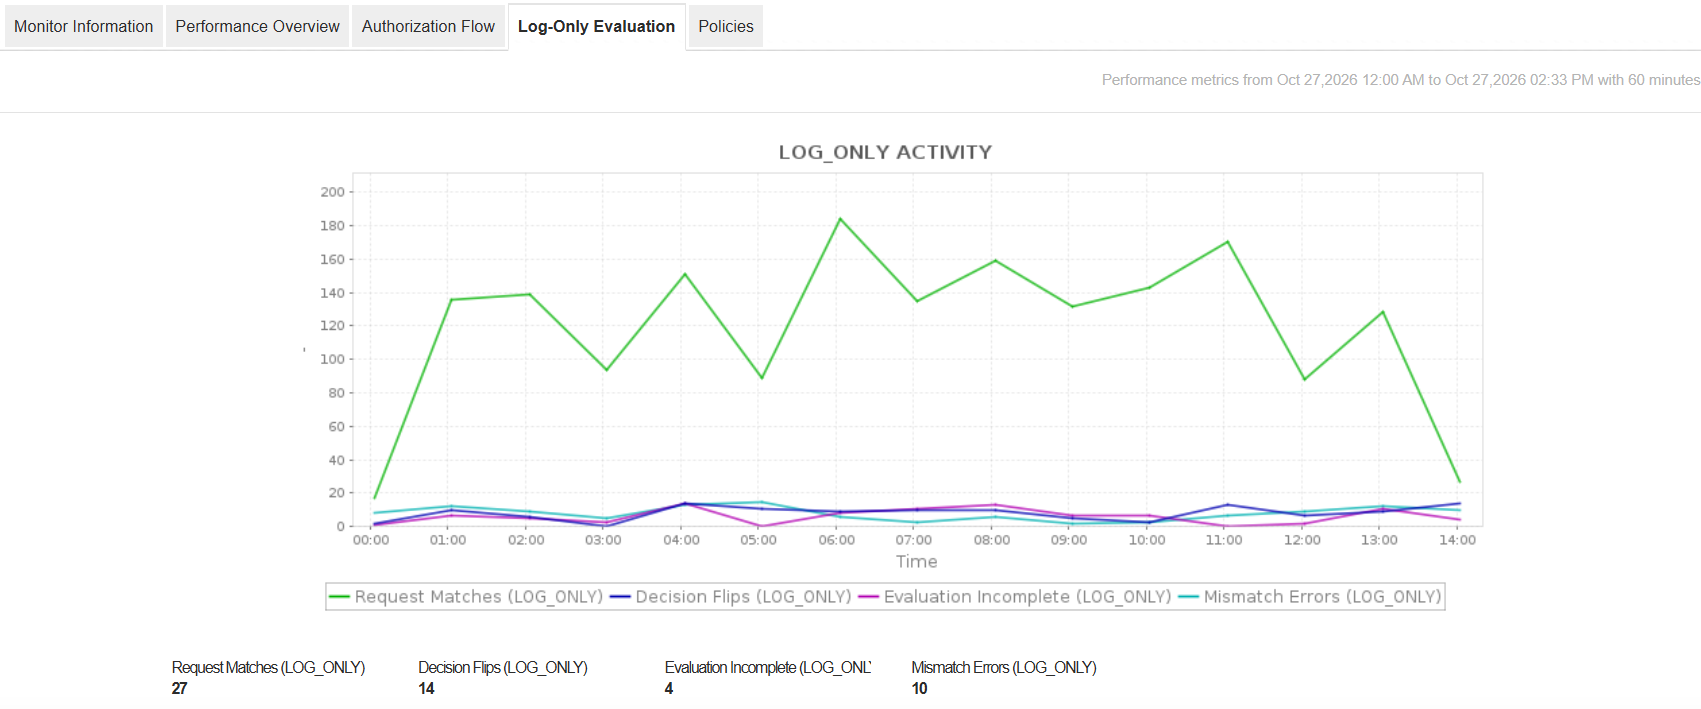
- Assess policy changes before enforcement using LOG_ONLY evaluation metrics: Request Matches, Decision Flips, Evaluation Incomplete, Flip Rate, and Mismatch Errors. Identify policies with the most decision flips using the Top 5 Policies graph.
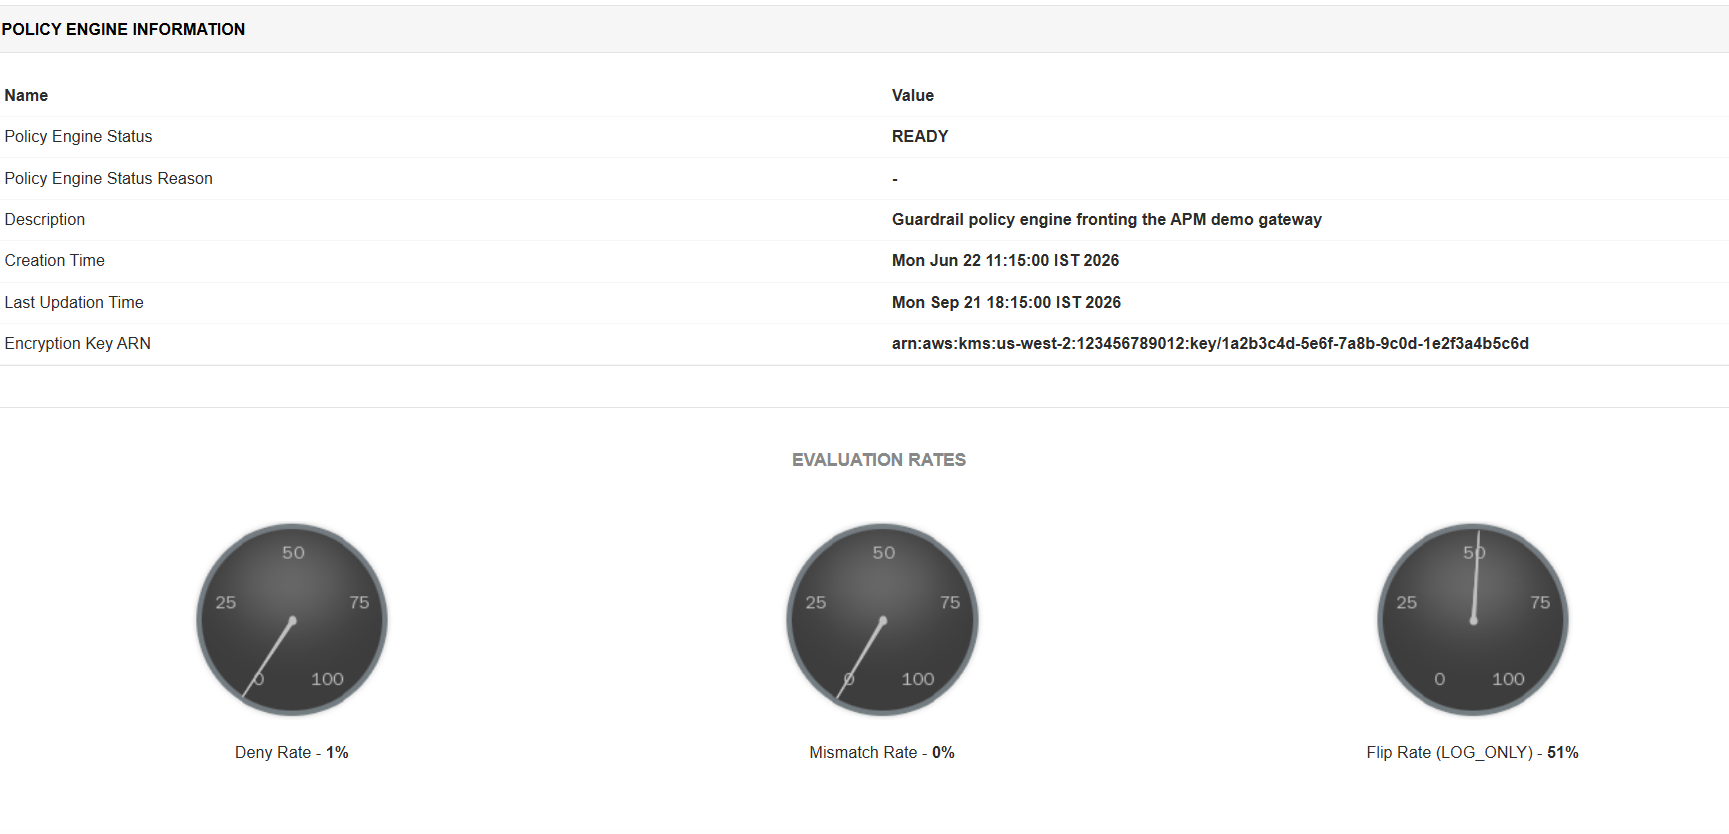
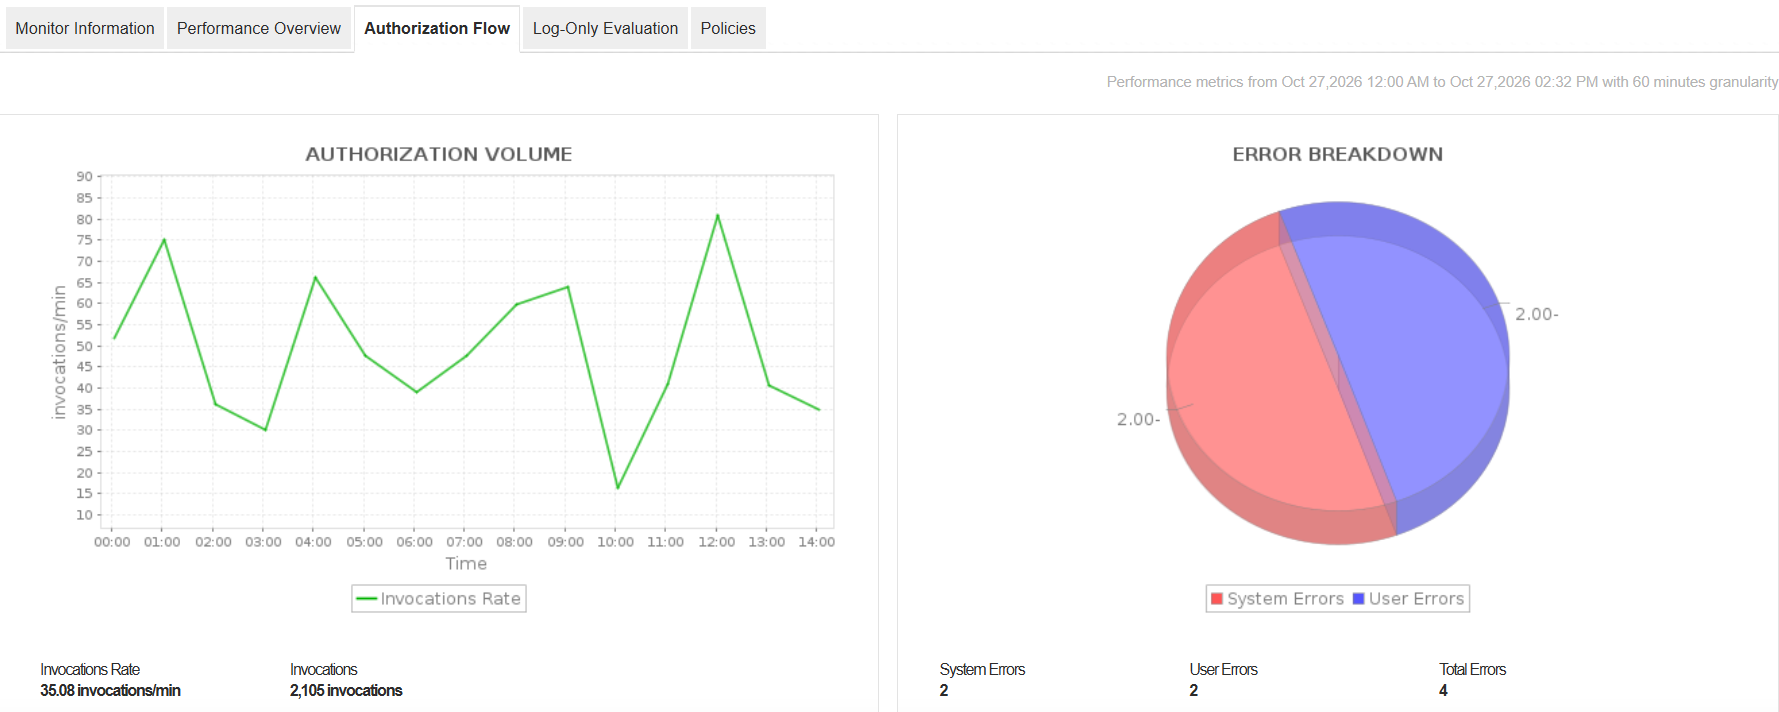
- Monitor authorization volume and decisions through Invocations, Allow Decisions, Deny Decisions, their per-minute rates, Deny Rate, Mismatch Rate, and Authorization, Guardrail, and Temporal Latency.
- Evaluate Policy Correctness using Mismatch Errors for active policies and identify policies with the most mismatches through the Top 5 Policies graph.
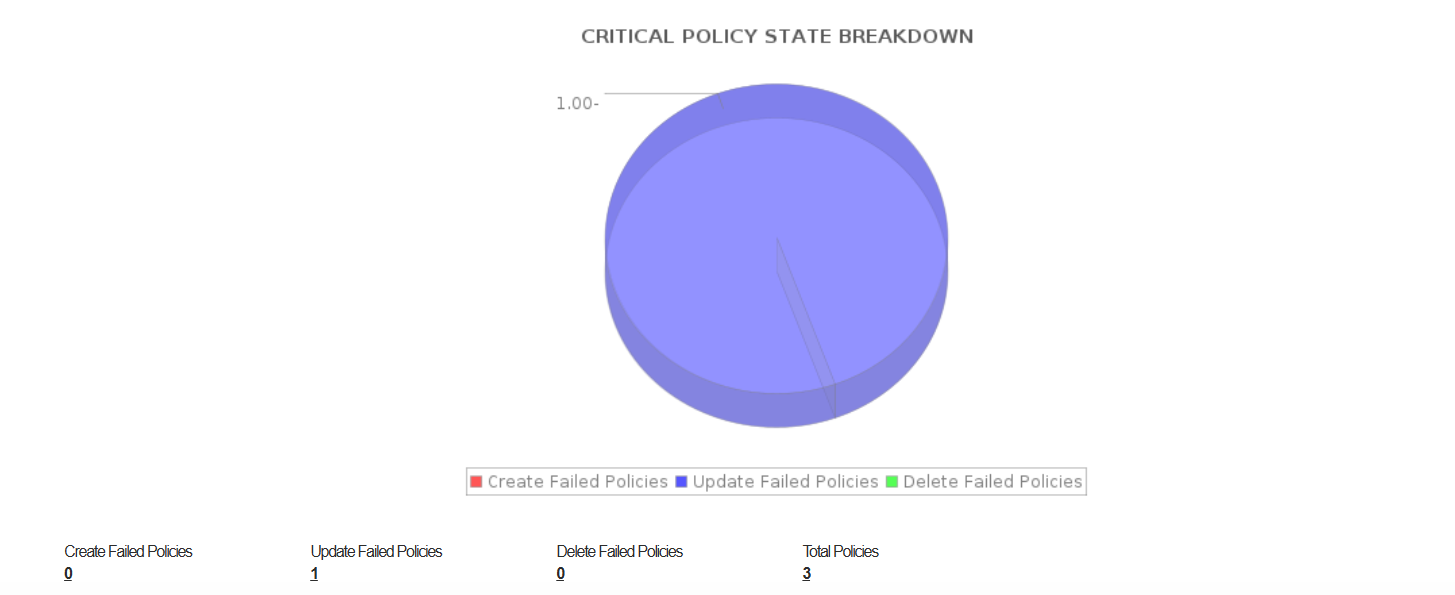
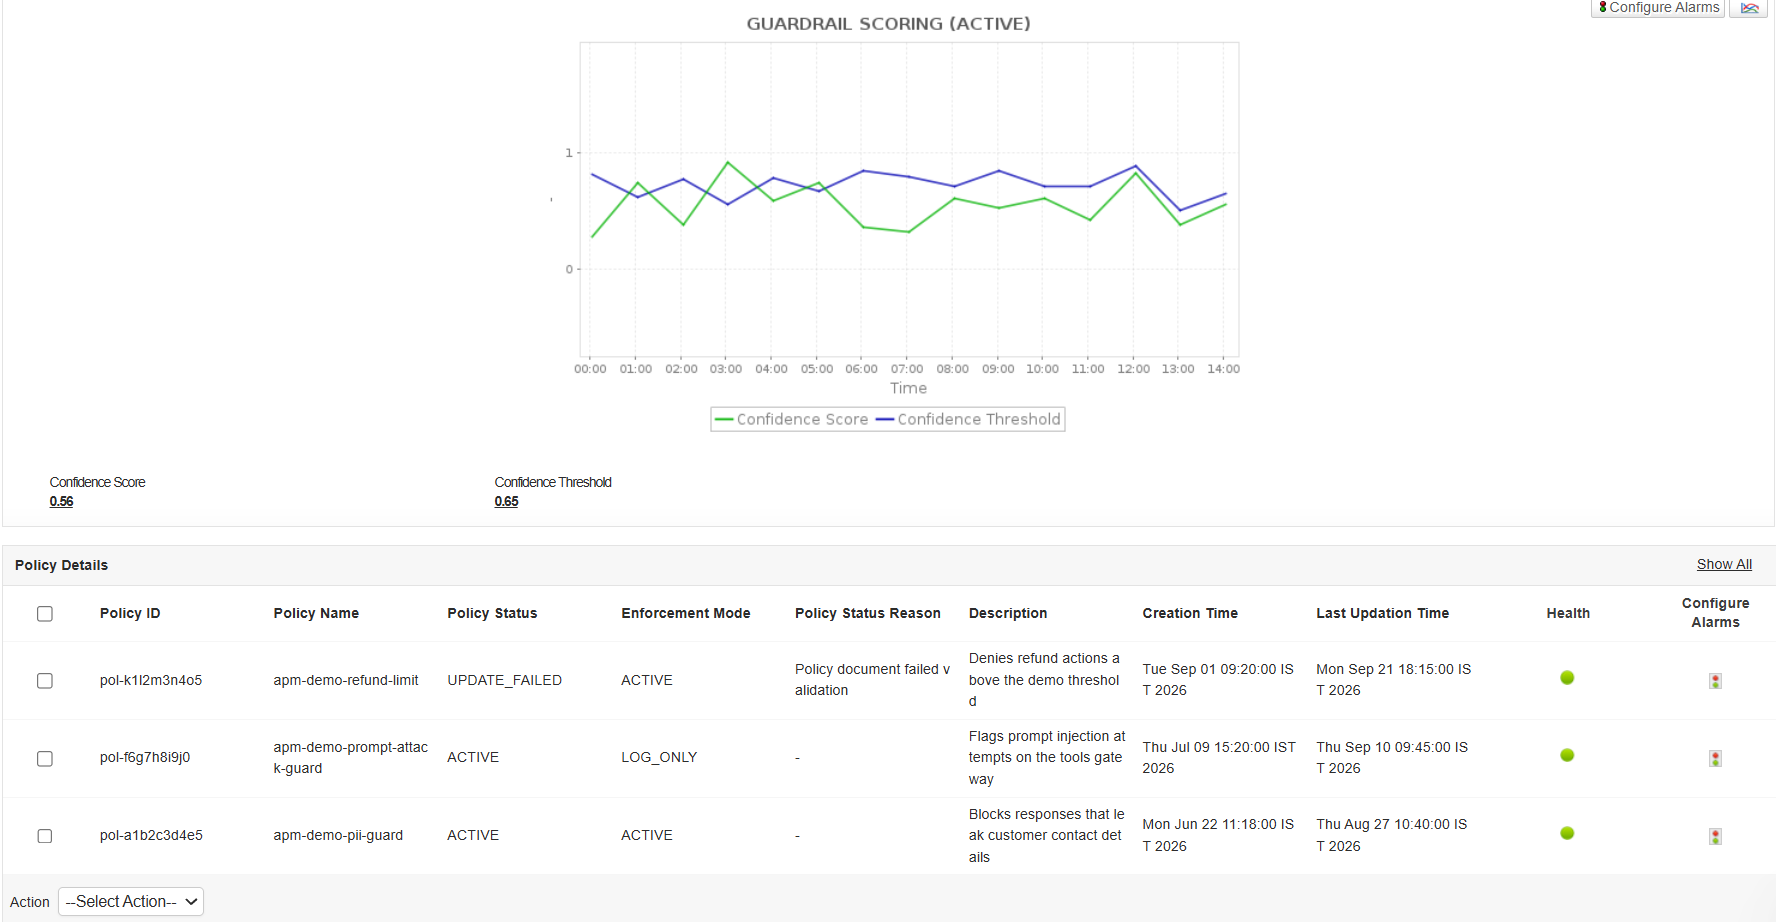
- Review policies and their enforcement modes (ACTIVE or LOG_ONLY), Total Policies, and the Critical Policy State Breakdown (Create Failed, Update Failed, and Delete Failed).
- Monitor guardrail scores for Content Filter, Prompt Attack, and Sensitive Info against their thresholds. Check Policy Engine Status, Policy Engine Status Reason, and the associated KMS key.
Looking to monitor your Amazon AI & ML Services?
Applications Manager is an all-in-one monitoring tool that effectively monitors a wide range of Amazon services. Start monitoring your AWS AI and machine learning workloads in minutes with Applications Manager's comprehensive AWS monitoring solution and ensure reliable, cost-effective generative AI operations. Download a 30-day free trial today!
Do more with Applications Manager's AWS monitoring with:
- Amazon Analytics Services Monitoring
- Amazon Compute Services Monitoring
- Amazon Container Services Monitoring
- Amazon Database Services Monitoring
- Amazon Management Services Monitoring
- Amazon Migration & Transfer Services Monitoring
- Amazon Network Management and Content Delivery Monitoring
- Amazon Networking Infrastructure Monitoring
- Amazon Storage Services Monitoring
- Amazon Integration Services Monitoring
- Amazon Security Services Monitoring