Amazon Redshift Monitoring
Eliminate Redshift slowdowns before they impact your business
Slow queries, timeouts, and downtime in Amazon Redshift can bring analytics and operations to a standstill. When performance dips, every team—finance, operations, analytics, and customer-facing—feels the pain. Costs rise, reports lag, and decision-makers suffer.
ManageEngine Applications Manager's Amazon Redshift monitoring helps you stay ahead of performance and cost challenges. Gain real-time visibility into your Redshift clusters—so you can detect issues early, optimize performance, and keep your analytics running smoothly.
Gain visibility into Redshift health and performance
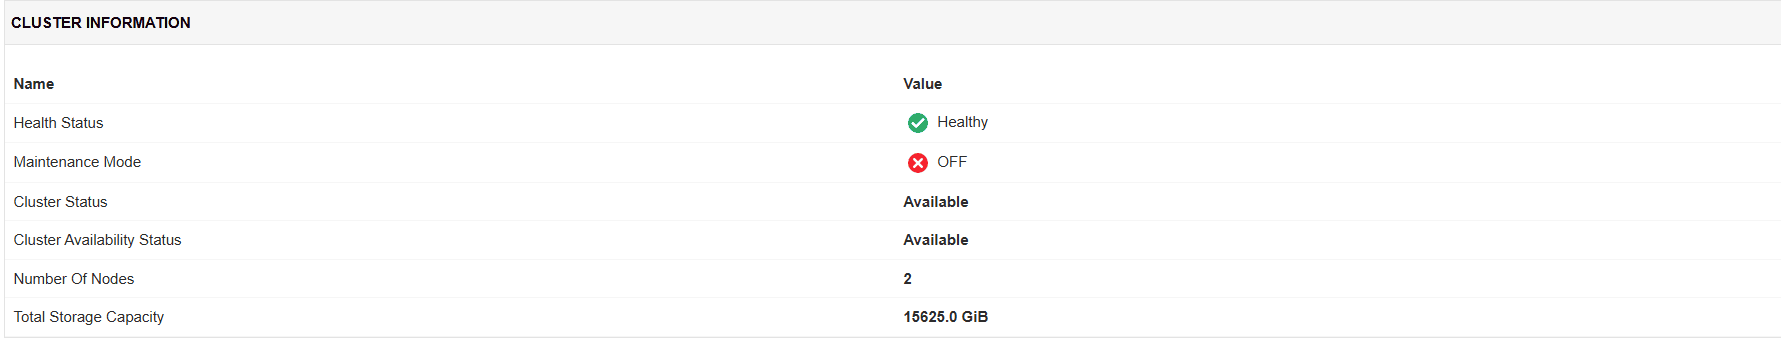
Applications Manager's Amazon Redshift monitoring collects a range of metrics categorized by resource utilization, network throughput, storage health, and query performance. These metrics are essential for tracking the health and performance of the Redshift cluster as well as the leader and compute nodes.
Keep tabs on resource utilization
Monitoring resource utilization prevents resource contention, improves parallel performance, and ensure balanced workloads across all nodes.
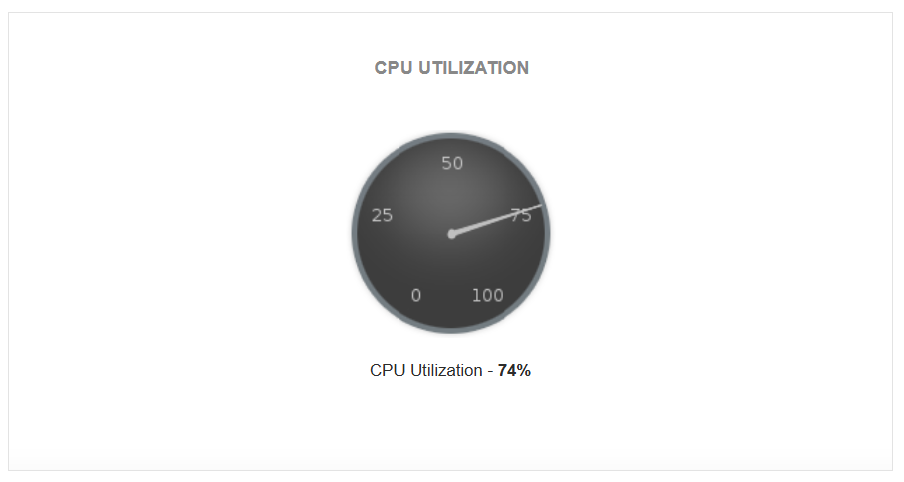
CPU utilization
High CPU usage often signals inefficient queries or resource-intensive workloads causing bottlenecks. Identify bottlenecks quickly by measuring the aggregate CPU usage across all nodes (leader and compute) in a cluster.
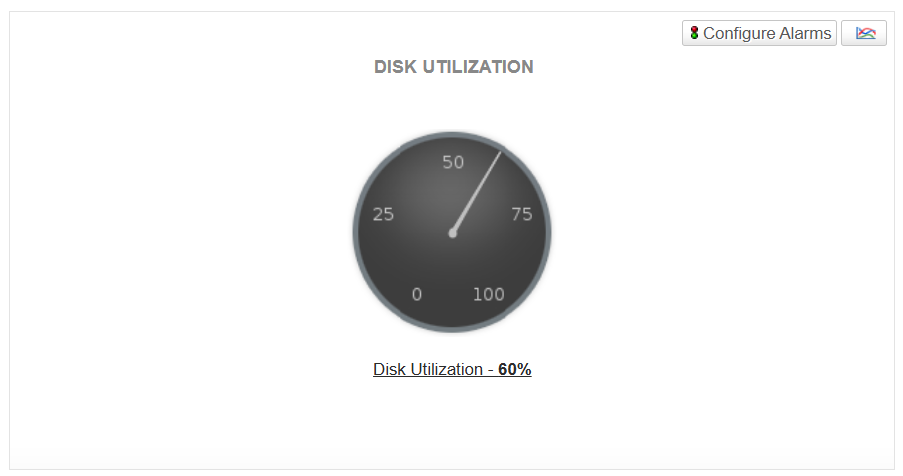
Disk utilization
Monitoring the percentage of disk space used provides warnings of low storage. Prevent disk saturation by triggering cleanup, vacuum, or resize operations before performance is affected.
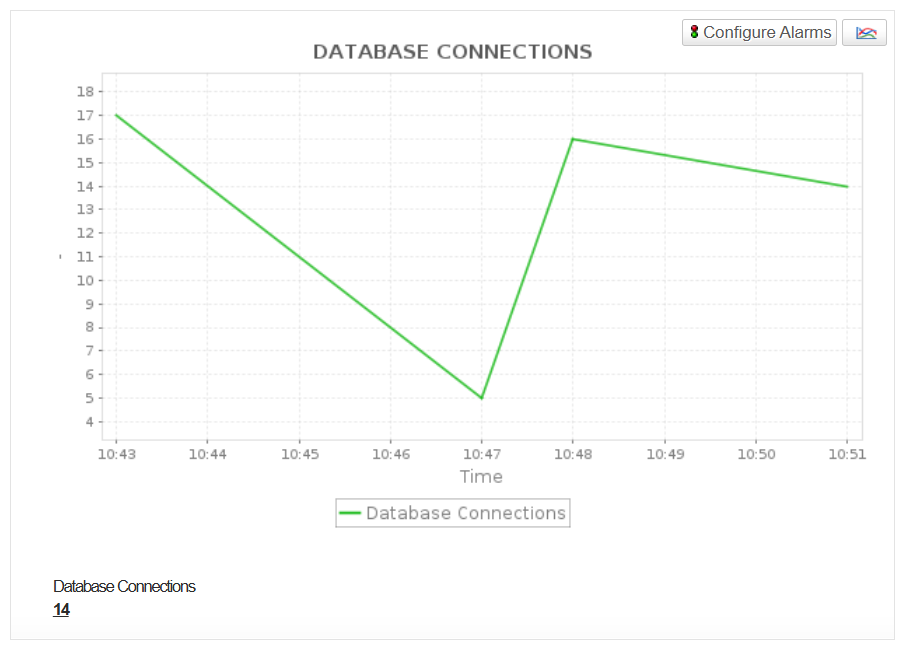
Database connections
Measure the number of active database connections to ensure your cluster operates within capacity and avoids resource contention.
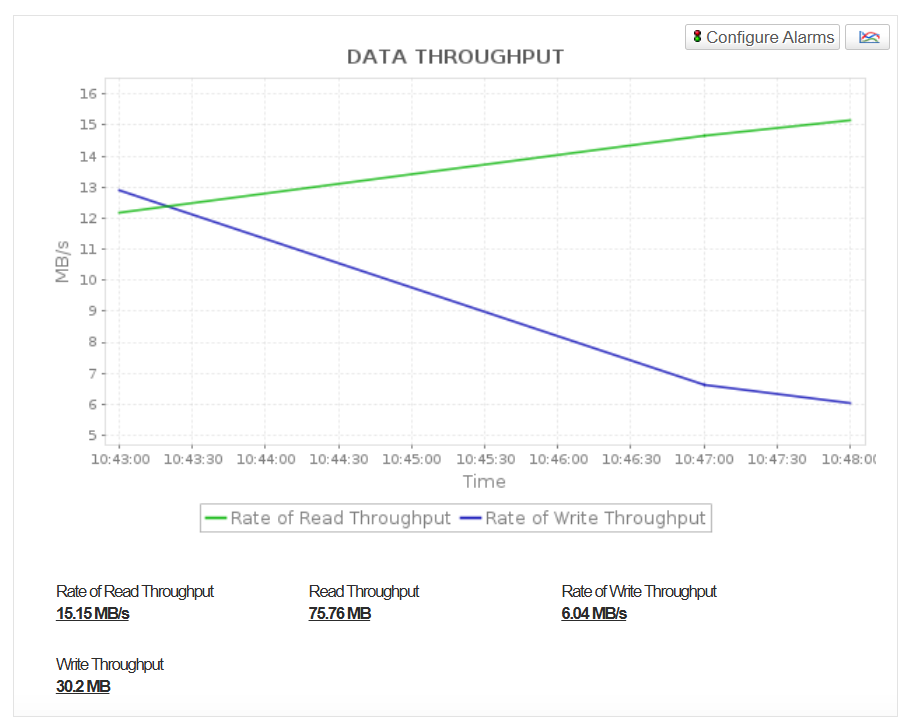
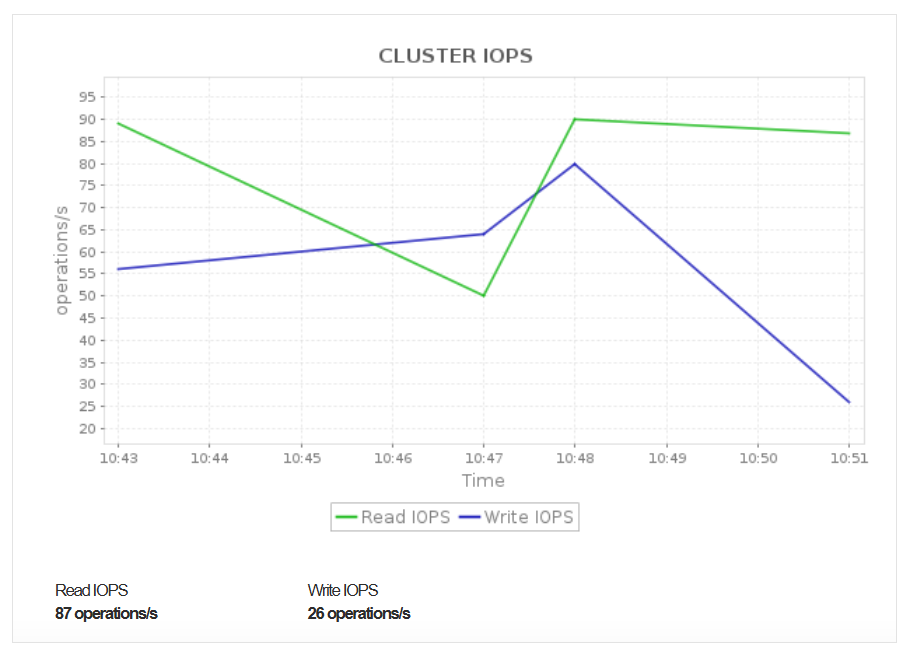
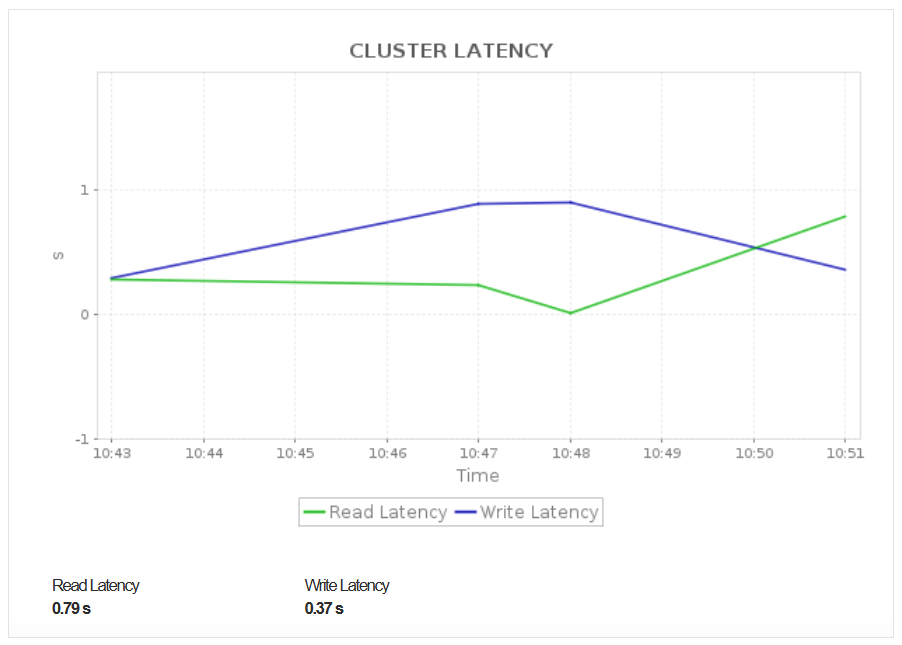
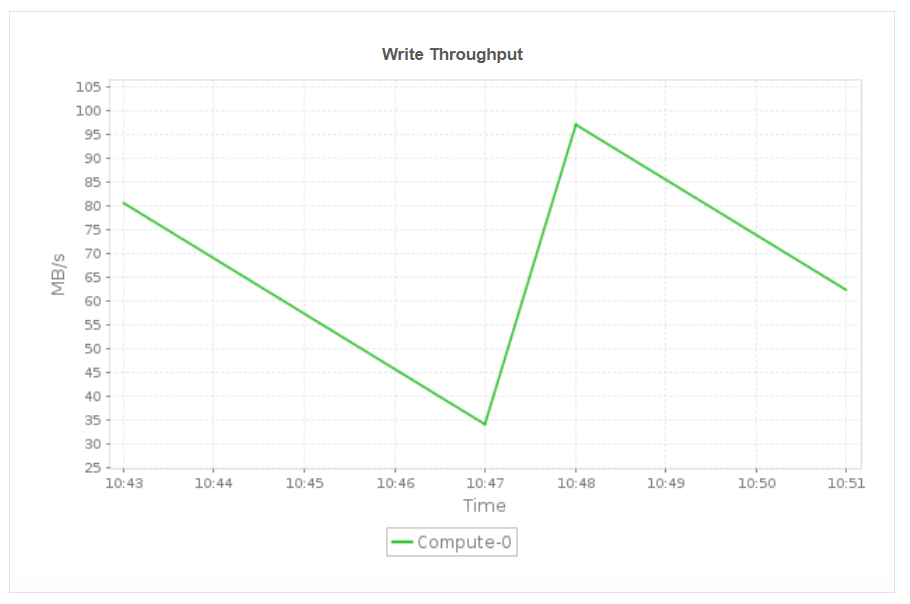
Read/Write throughput
Track data throughput to measure storage I/O efficiency and detect imbalanced workloads or disk contention.
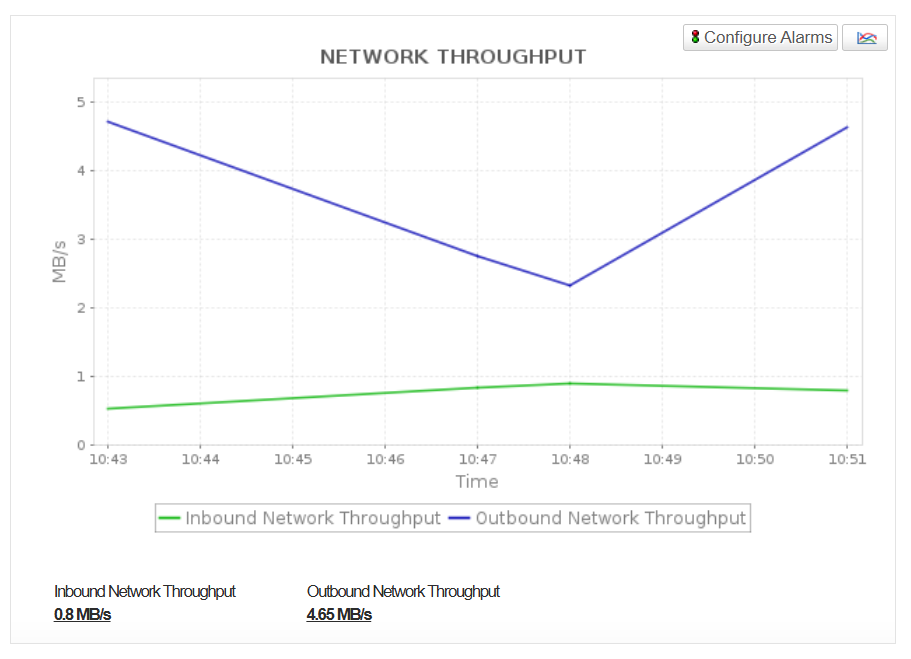
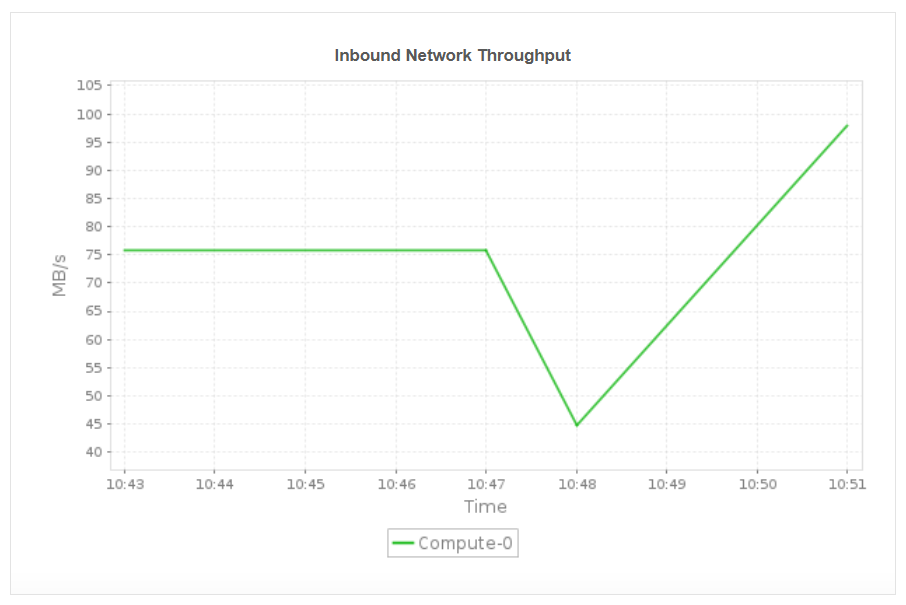
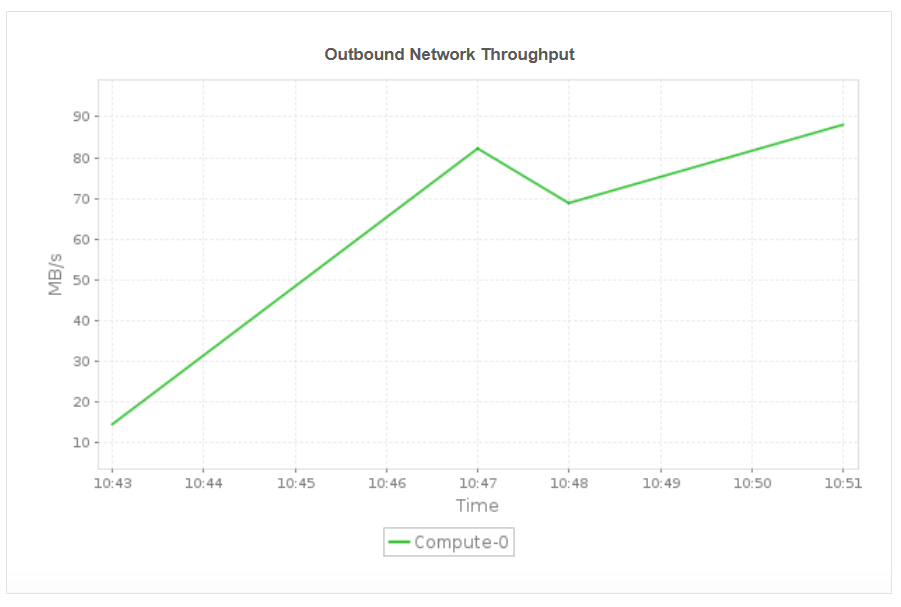
Network throughput (Inbound/outbound)
Monitor the volume of data transferred between cluster nodes and clients to detect network bottlenecks that could affect query performance or data ingestion speeds.
Monitor Query health and Database workloads
Track a comprehensive set of metrics across several critical areas, including query performance, resource utilization, workload management, and storage health. Quickly pinpoint query slowdowns, eliminate inefficient scans and maintain predictable response times, even during peak loads.
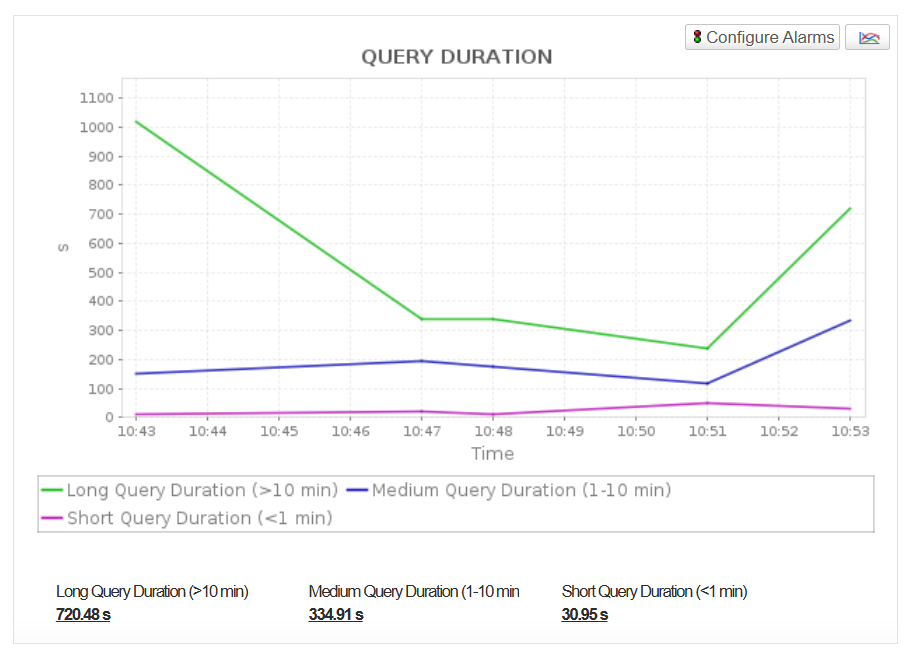
- Monitor query duration (long,medium,short) to identify slow or inefficient queries that impact user experience.
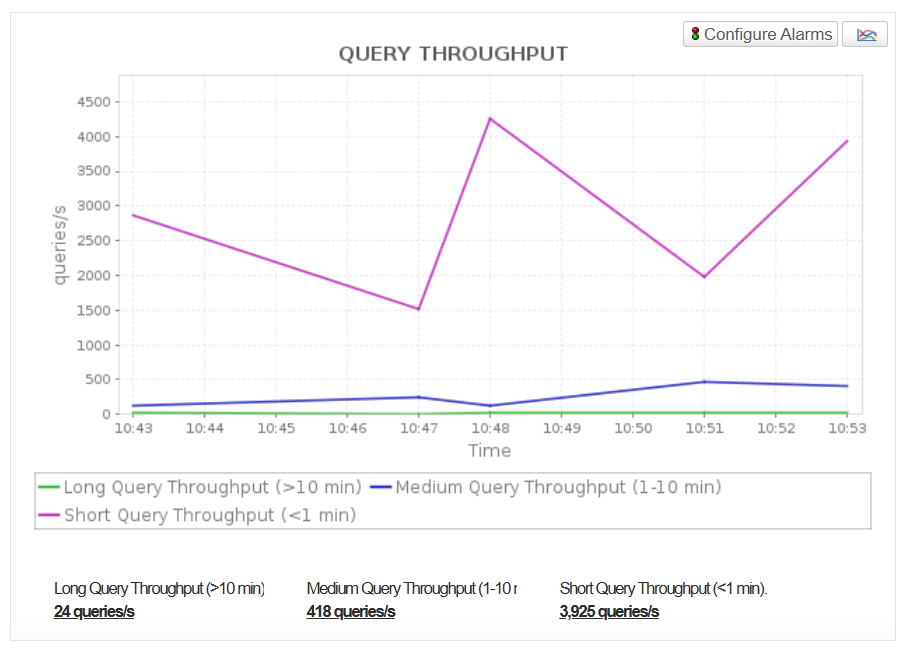
- Track the number of queries executed per second (Query Throughput) for long queries, medium queries and short queries. This helps you measure workload intensity and adjust concurrency for optimal performance.
- Get a detailed view of query lifecycle phases and understand how much time is spent on parsing and optimizing SQL statements (Query Planning Time), time spent waiting in the WLM queue (Query Waiting Time), time spent committing (Query Commit Time), etc.
- Track the time spent on various stages such as QueryExecutingRead, QueryExecutingUnload, QueryExecutingInsert, QueryExecutingDelete, QueryExecutingUpdate, QueryExecutingCtas, QueryExecutingCopy, etc.
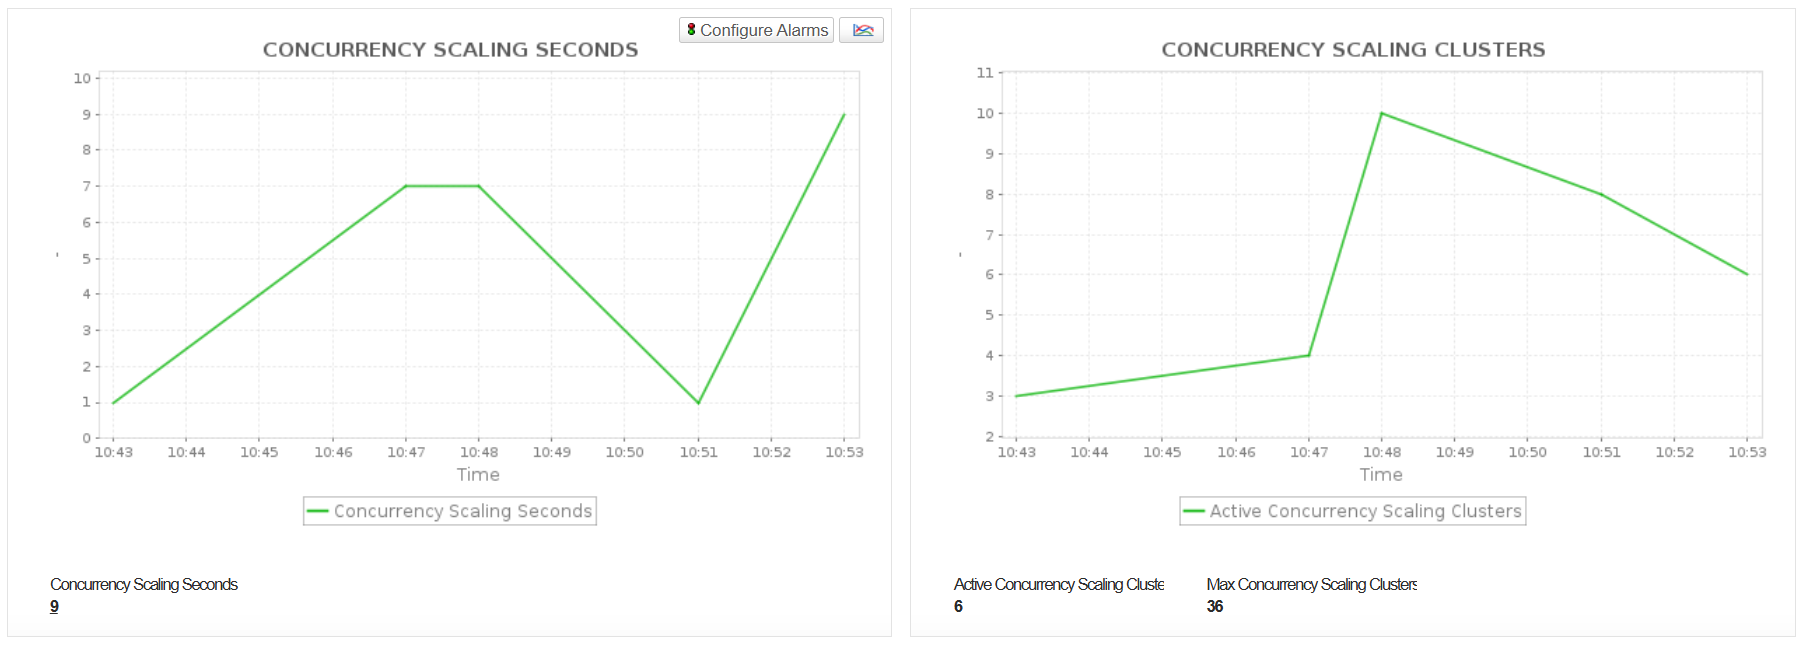
- Monitor Concurrency Scaling metrics including ConcurrencyScalingClusters and ConcurrencyScalingSeconds to track how frequently and for how long additional clusters are automatically launched to manage spikes in query workloads. These metrics help you evaluate dependency on concurrency scaling to maintain performance during peak demand, optimize cluster sizing, manage costs by minimizing unnecessary scaling, and identify opportunities to enhance query efficiency and workload distribution.
Ensure Reliable Cluster Operations and Network Performance
View connection health, network throughput, and cluster availability in real time. Monitoring the maintenance mode status (Cluster State) helps ensure that operations or deployments are not negatively impacting system availability or query execution, as queries may run slower immediately after cluster maintenance or reboots.
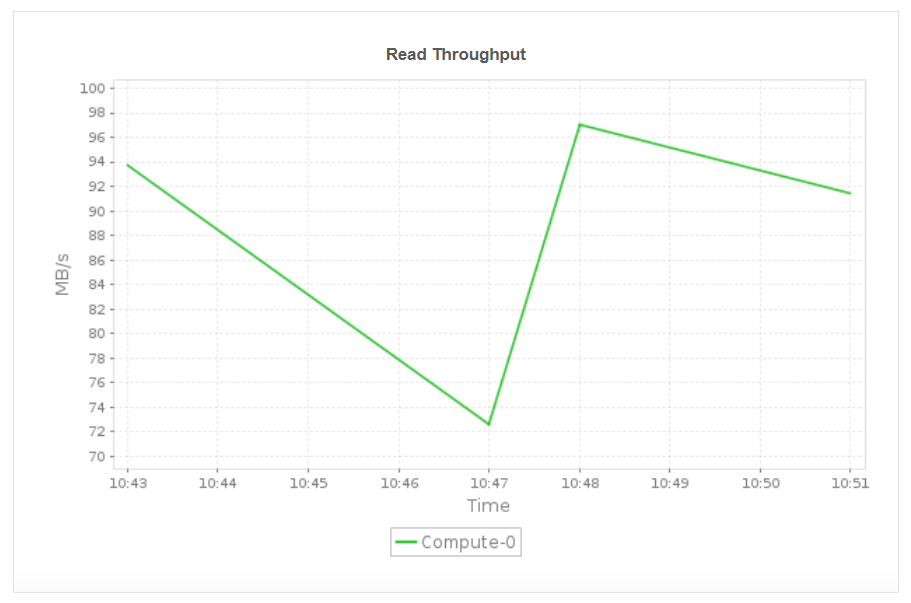
Optimize Cluster Efficiency with Node-Level Insights
Monitor key node-level metrics such as read and write throughput, inbound and outbound network throughput, and node disk activity. These insights help you identify node specific bottlenecks, detect uneven workload distribution, and ensure that each compute node is operating efficiently. By understanding performance at the node level, you can proactively resolve throughput issues, balance workloads, and maintain consistent cluster performance across all nodes.
Applications Manager also offers monitoring support for Amazon services like:
Get started with Amazon Redshift monitoring in minutes!
Take the first step toward optimizing your Amazon Redshift cluster's performance and availability. Download a 30-day free trial of Applications Manager and explore the Amazon Redshift monitoring capability on your own!
