APM Insight - An Overview
DevOps can get complete visibility into application performance and various components of the web application using Applications Manager's APM Insight, an application performance monitoring tool. This is a perfect tool for IT operations, developers, and application teams to use to collaborate and ensure high application uptime. It provides end-to-end insight into the performance of individual web transactions and highlights issues no matter where they originate.
APM Insight gives you visibility into the way your applications behave for your end users. You get comprehensive end-to-end transaction awareness across your entire infrastructure, enabling you to isolate performance issues and resolve them quickly without degrading the performance of your applications. Drill down to the root cause of problems quickly and perform first-level troubleshooting.
APM Insight Architecture
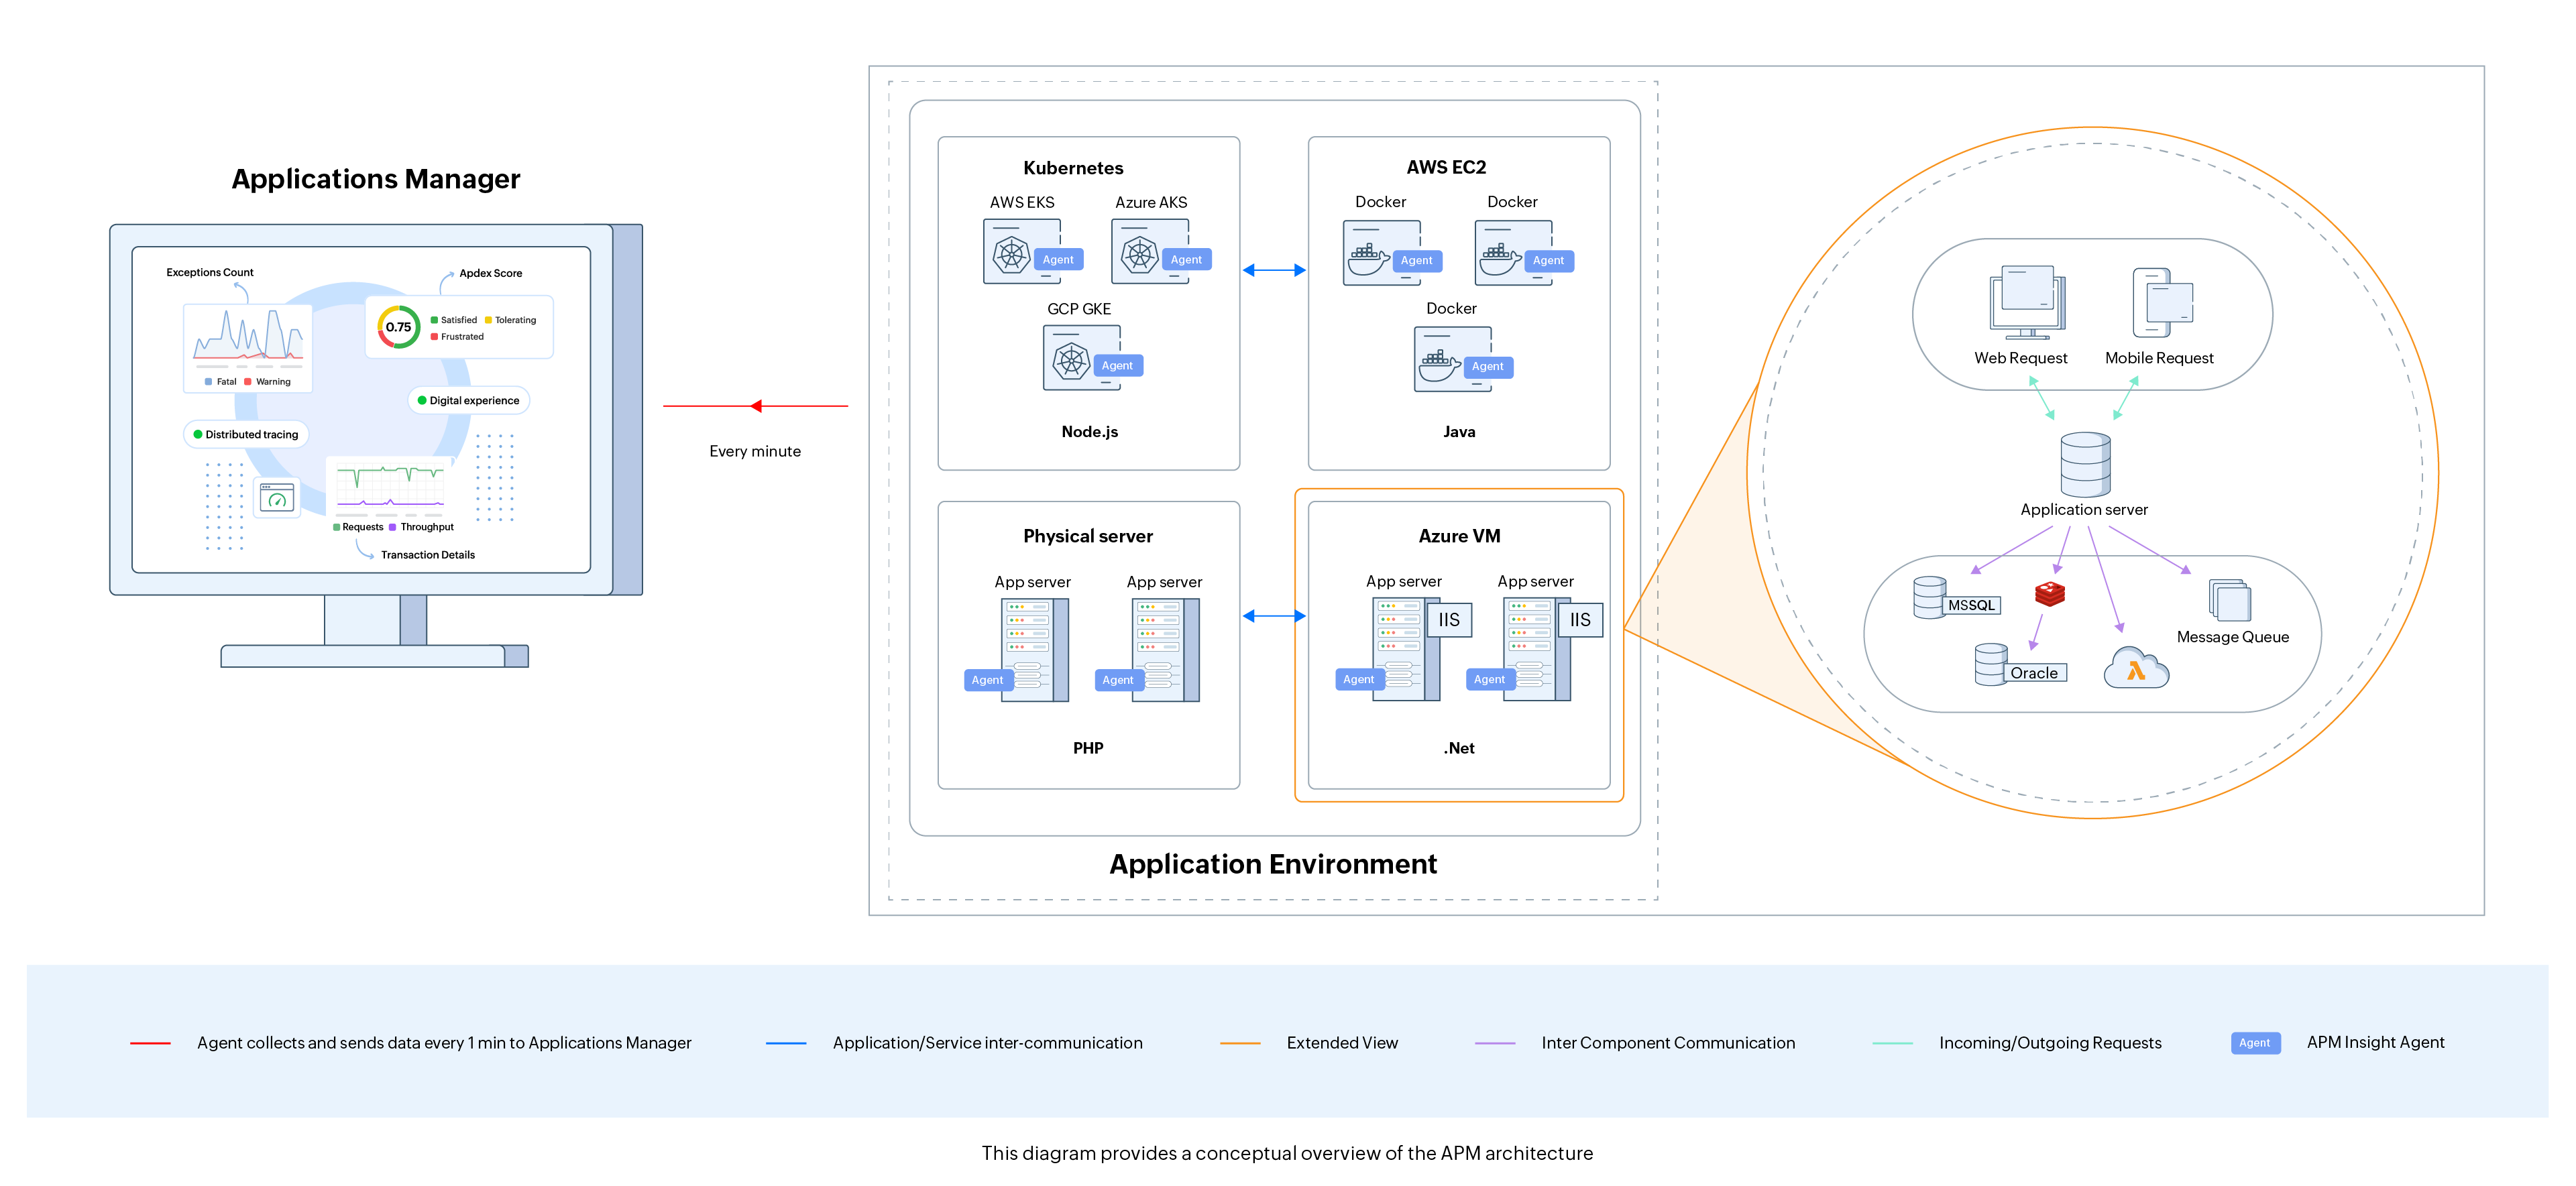
The Applications Manager's APM Insight Agent needs to be downloaded and installed on every app server. Data collection happens every minute through a one-way HTTPS connection, and the collected data gets pushed to Applications Manager's Data Collector. This also ensures incessant agent-server communication. In the case of the .NET agent, the agent sends the collected metrics to the Windows service, which, in turn, pushes the data to the Data Collector. Using the data, users can keep track of application response time, identify slow database queries, measure user satisfaction levels using Apdex scores, isolate slow invocations in code, and keep track of individual method traces, etc.
Working
To learn how APM Insight works in Applications Manager, refer here.
APM Insight agents and supported platforms
Gain deep insight into your application's performance with Applications Manager's APM Insight. Supported platforms include Java, .NET, Ruby on Rails, PHP, Node.js, and Python application monitoring. Get started with any of the following agents to monitor your applications:
| APM Insight agent | Supported platform version |
|---|---|
| Java | Java 8 or above. |
| .NET | Microsoft .NET Framework version 4.0 or above hosted on IIS 7.0 or above. |
| Ruby | Ruby - 1.8.7 or above, Rails - 3.0 or above, Sinatra - 1.4.0 or above. |
| PHP | PHP 7.0 or above. |
| Node.js | Node.js version 16.20.2 or above. |
| Python | Python 3.7 or above. |
APM Metrics
Monitor application-critical performance metrics on the APM Insight dashboard, which offers a visual representation of the performance metrics of all the components, starting from URLs to SQL queries, APDEX scores to measure user satisfaction,n and transaction tracing. Browse through the following topics to learn more about the performance metrics that are monitored in APM Insight:
Configuration
Besides the performance metrics monitored, APM Insight allows you to perform configuration settings that enable you to monitor the performance of custom application components and their key transactions with deep insights. The following are some of the configuration settings that are available in APM Insight:
Customize your APM Insight agent configuration profile and set thresholds for key parameters of web and background transactions.
Note: For Applications Manager v15060 and below, agent configuration settings can be set up only in the apminsight.conf file. Learn more
- Monitor custom transactions, classes, methods, and frameworks using custom instrumentation for code-level insights.
Additional features
APM Insight offers additional configurations that aid you in monitoring the performance of additional application components with in-depth visibility. The following are some of the additional features that are supported in APM Insight:
- Efficiently monitor instances using autoscaling for cloud-based applications.
- Monitor important metrics in your application using App parameters
- Use thread profiling to identify and eliminate bottlenecks in your code
- Track transaction traces made from one application to another with Distributed Tracing
- Use Service Maps to gain a topological view of your application components along with their connection to other dependent resources in your infrastructure.
