Python Monitoring
Stop guessing why your Python apps are slow. Get real-time visibility into response times, database queries, and exceptions across Django, Flask, and FastAPI. Detect N+1 queries automatically and trace requests through distributed microservices.
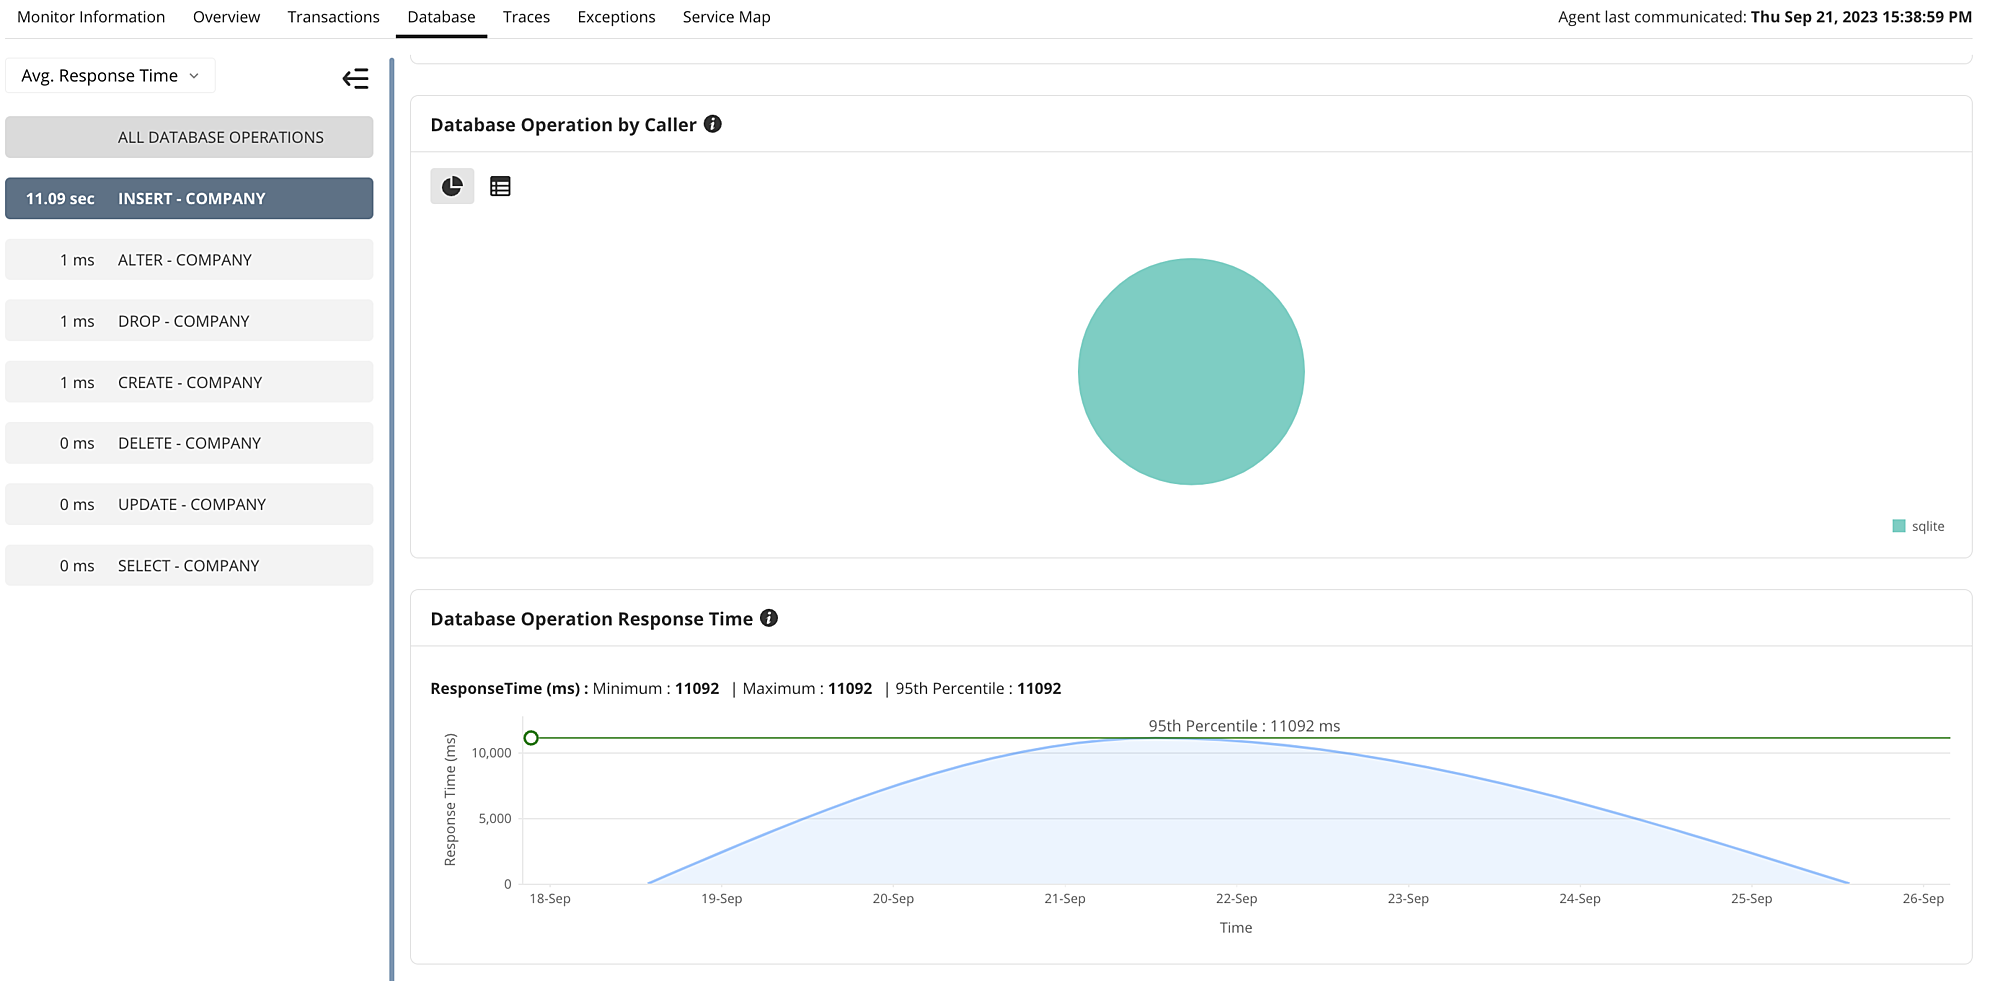
Database Query Analysis & N+1 Detection
Visualize database call patterns with intuitive dashboards that surface delayed queries and high utilization. Automatically detect N+1 queries and duplicate database calls across ORMs like SQLAlchemy and Django ORM, then drill down to the exact code path causing slowdown.
- Detect N+1 queries in Django ORM and SQLAlchemy
- Identify duplicate and redundant database calls
- Monitor query execution times and patterns
- Track database connection pool utilization
Real-Time Performance Metrics
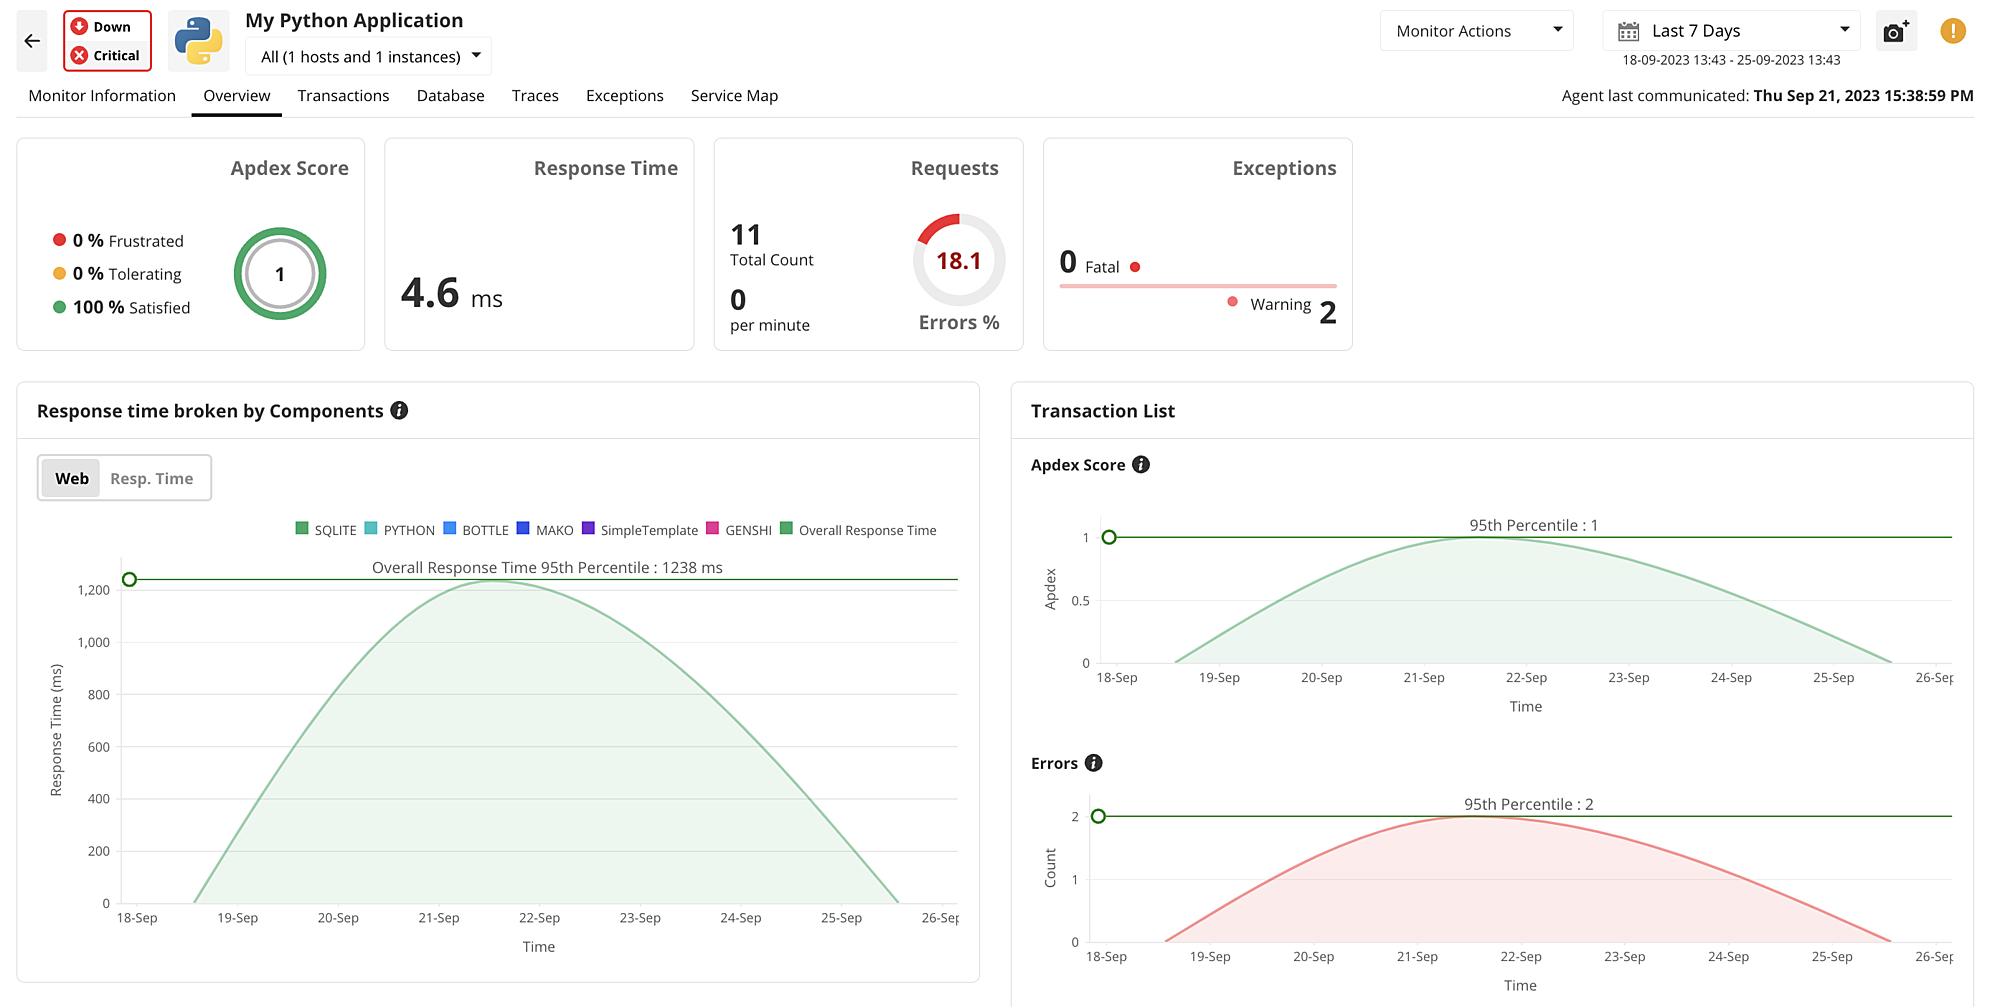
Track the four golden signals of monitoring - latency, throughput, error rates, and resource saturation. Monitor APDEX scores, average and percentile response times, error counts, and CPU or memory utilization to catch bottlenecks before they impact users.
- Monitor p95 and p99 latency percentiles
- Track throughput and transaction rates
- Measure APDEX scores and user satisfaction
- Monitor CPU, memory, and GC metrics
Distributed Tracing Across Microservices
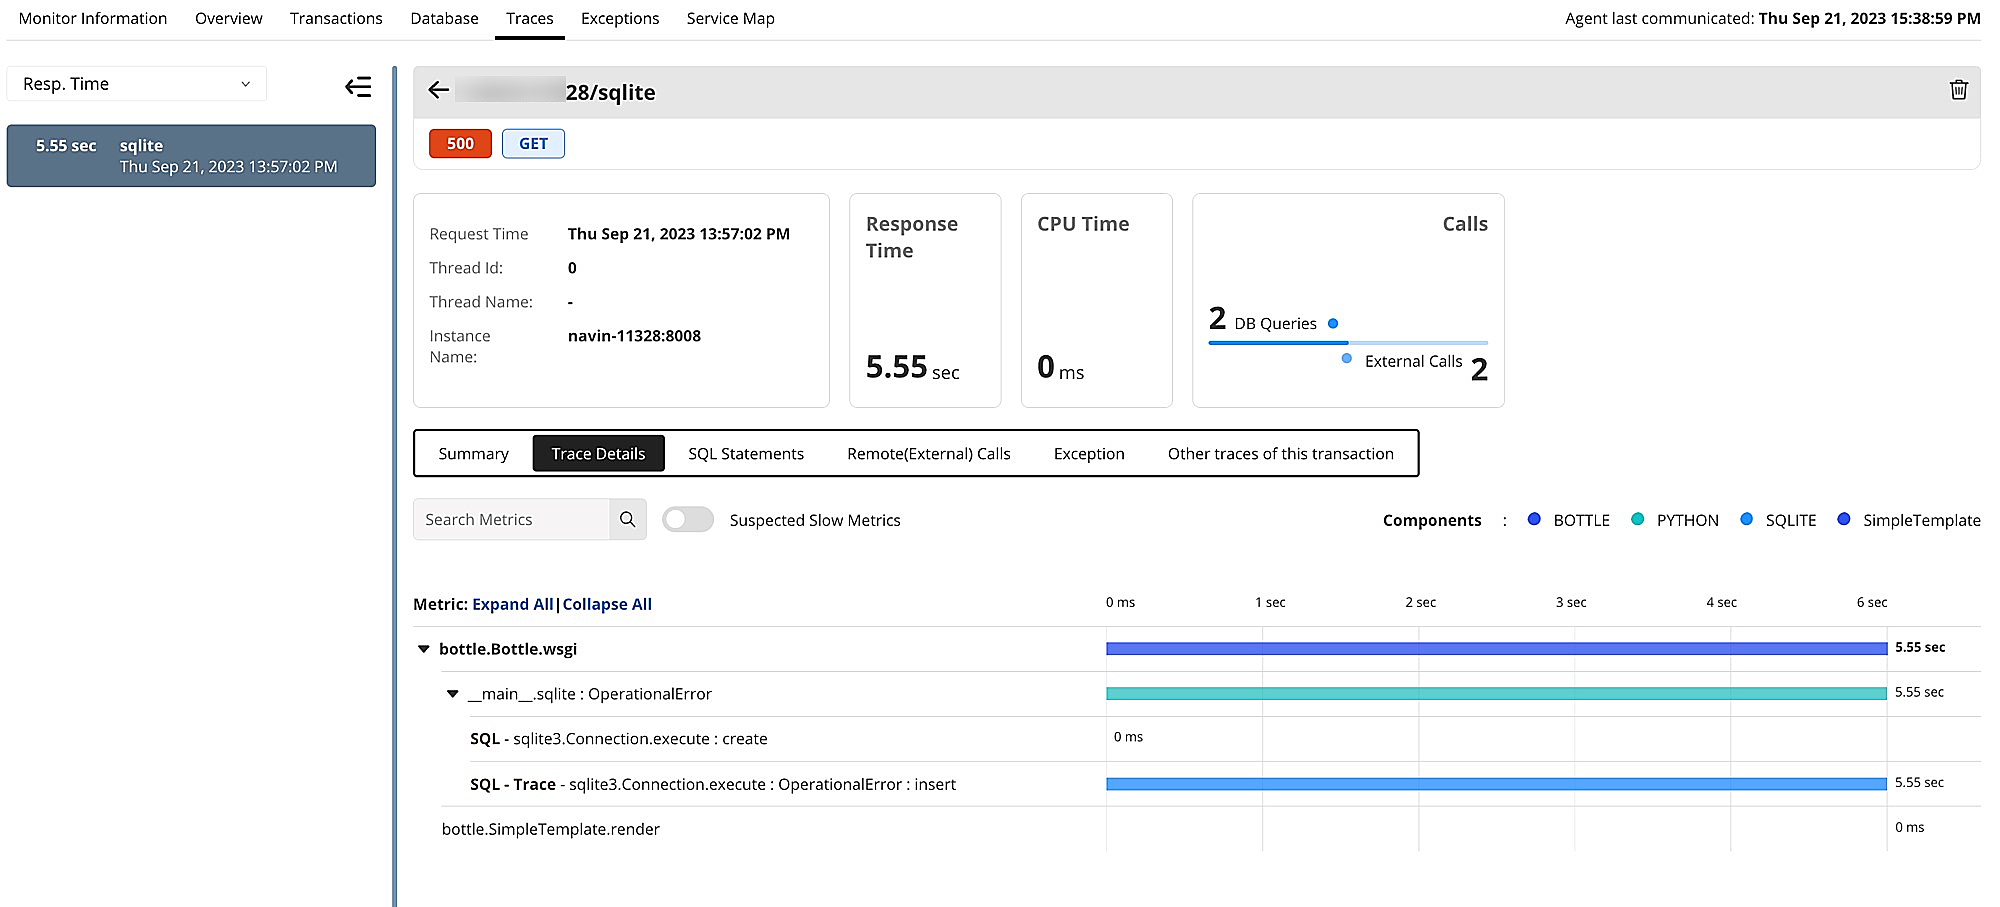
Trace requests through your entire microservices architecture. Automatically propagate context across service boundaries and identify which service in your call chain is causing slow responses or errors.
- Track requests through multiple Python services
- Correlate errors across service boundaries
- Identify service dependencies and bottlenecks
- Monitor async tasks and background workers
FAQs on Python monitoring:
Which Python frameworks are supported?
+Can I monitor asynchronous Python applications?
+How can I detect N+1 queries in Django?
+Does APM Insight support OpenTelemetry for Python applications?
+Can I monitor Celery background tasks?
+What is the performance overhead of Python application monitoring?
+Get started with Python Performance Monitoring in just a few minutes!
Experience the benefits of Python performance monitoring firsthand by downloading Applications Manager's fully featured 30-day free trial.