- Home
- Logging Guide
- Cisco log analyzer
- How to check Cisco switch logs
How to check your Cisco switch logs?
In this page
- Enabling logging on Cisco switches
- Viewing your switch logs
- How ManageEngine EventLog Analyzer helps you gain visibility into your network activity with its out-of-the-box reports
Cisco switches generate valuable logs related to network traffic, which are essential for troubleshooting errors and issues. These log are collected, analyzed, and correlated by a Cisco log analyzer to identify suspicious network activities.
Enabling logging on Cisco switches
To enable logging to the console or a log file, simply log on to your switch's administrative console by following the steps described below and using the required commands:
Log into the Switch:
Access your Cisco switch's administrative console using a console cable, SSH, or Telnet.
Enabling and disabling console logging:
To enable logging to the console, use the following command:
logging console [severity-level]
The severity-level is optional and specifies the minimum level of messages to log.
Use the command no logging console to disable logging to the console.
Cisco devices utilize a system of logging levels to categorize messages based on their severity. This classification helps in managing and filtering log messages effectively. Below is a summary of the logging severity levels used in Cisco systems:
| Level | Severity | Description | Syslog definition |
|---|---|---|---|
| 0 | Emergency | System unusable | LOG_EMERG |
| 1 | Alerts | Immediate action needed | LOG_ALERT |
| 2 | Critical | Critical conditions | LOG_CRIT |
| 3 | Errors | Error conditions | LOG_ERR |
| 4 | Warnings | Warning conditions | LOG_WARNING |
| 5 | Notifications | Normal but significant condition | LOG_NOTICE |
| 6 | Informational | Informational messages only | LOG_INFO |
| 7 | Debugging | Debugging messages (Used during debugging only) | LOG_DEBUG |
Enable Logging to a Log File:
To log messages to a specific log file, use:
logging logfile logfile-name severity-level [size bytes]
Replace logfile-name with your desired file name. The size argument specifies the maximum size of the log file in bytes (optional).
Viewing your switch logs
To view logs or related configuration information, you can use the following commands:
Display Console Logging Configuration:
Use this command to see the current console logging configuration:
show logging console
View recent log entries:
To display a specific number of lines from the end of the log file, use:
show logging last number
Replace number with how many lines you want to see.
Display logs within a time range:
To view logs that fall within a specific time range, use:
show logging logfile [start-time yyyy mmm dd hh:mm:ss] [end-time yyyy mmm dd hh:mm:ss]
Both start-time and end-time arguments are optional; if you omit end-time, it defaults to the current time.
All of these commands help you view your switch logs on your native switch console. However, considering how tough it is to examine thousands of raw logs, it is advisable to use the logging server command to configure a remote syslog server to capture your switch logs.
EventLog Analyzer comes with intuitive built-in reports to help you analyze your switch logs and gain insight into relevant traffic events. You can even set up any of the predefined alert profiles to be notified in real time about any events.
How ManageEngine EventLog Analyzer helps you gain visibility into your network activity with its out-of-the-box reports
EventLog Analyzer is a centralized log management solution that collects, parses, and analyzes your Cisco switch logs and provides valuable insights through intuitive graphical reports. With a switch log monitoring tool like this one, here's what you can do:
Get an overview of network traffic and attack trends
EventLog Analyzer generates the following traffic trend reports by analyzing your Cisco switch logs:
- Accepted/denied connections based on source, destination, ports, and protocol.
- Logon trends based on users and devices.
- Attack events like UDP snork attack, ICMP redirect, and IP fragments overlap.
The solution reports presents data through customizable visual graphs and charts to help you discover anomalous events with ease.
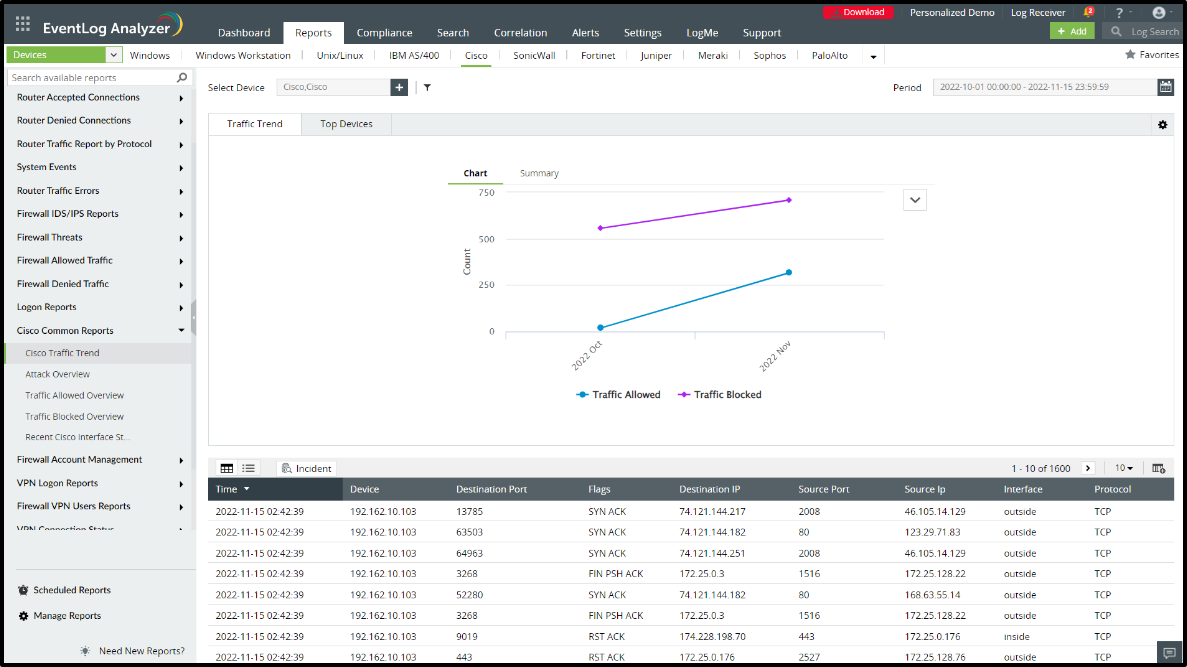
This is a visual representation of the number of requests allowed and blocked over a certain period of time.
Examine system events and conduct root cause analysis
Monitor important system and hardware events, troubleshoot errors, and investigate the root cause with EventLog Analyzer’s reports on switch interface status, configuration changes, commands executed, link state changes, memory allocation failures, crashes, and reboots.
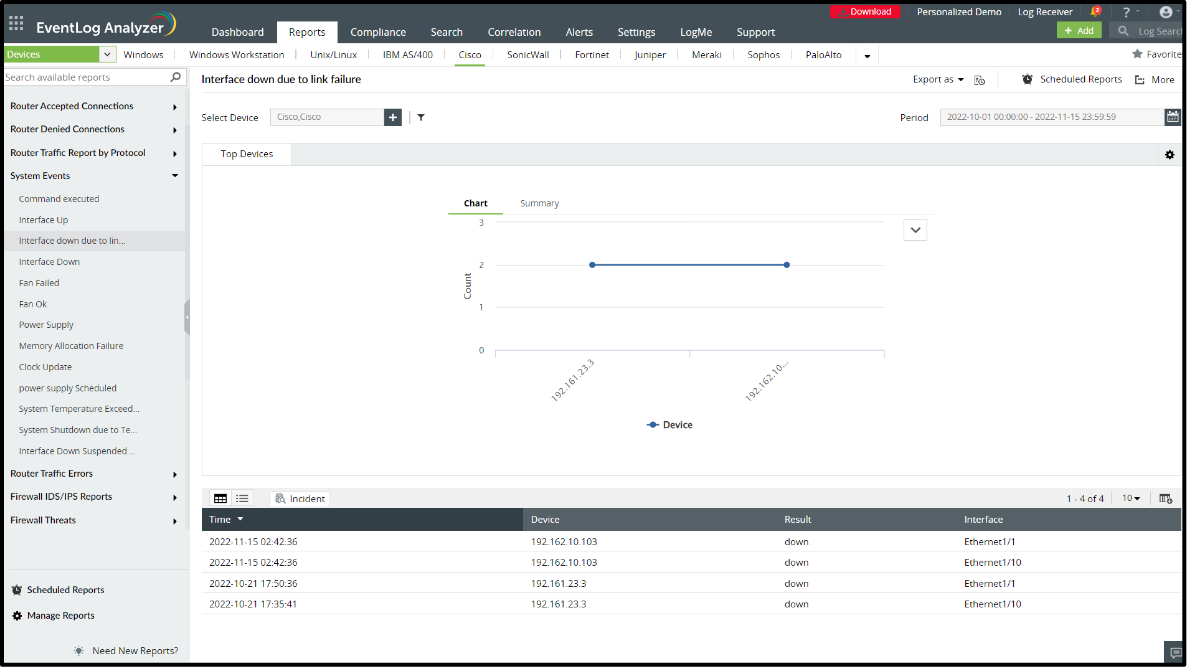
This graph represents a total number of interface failures across available devices.
Enjoy a real-time alerting system
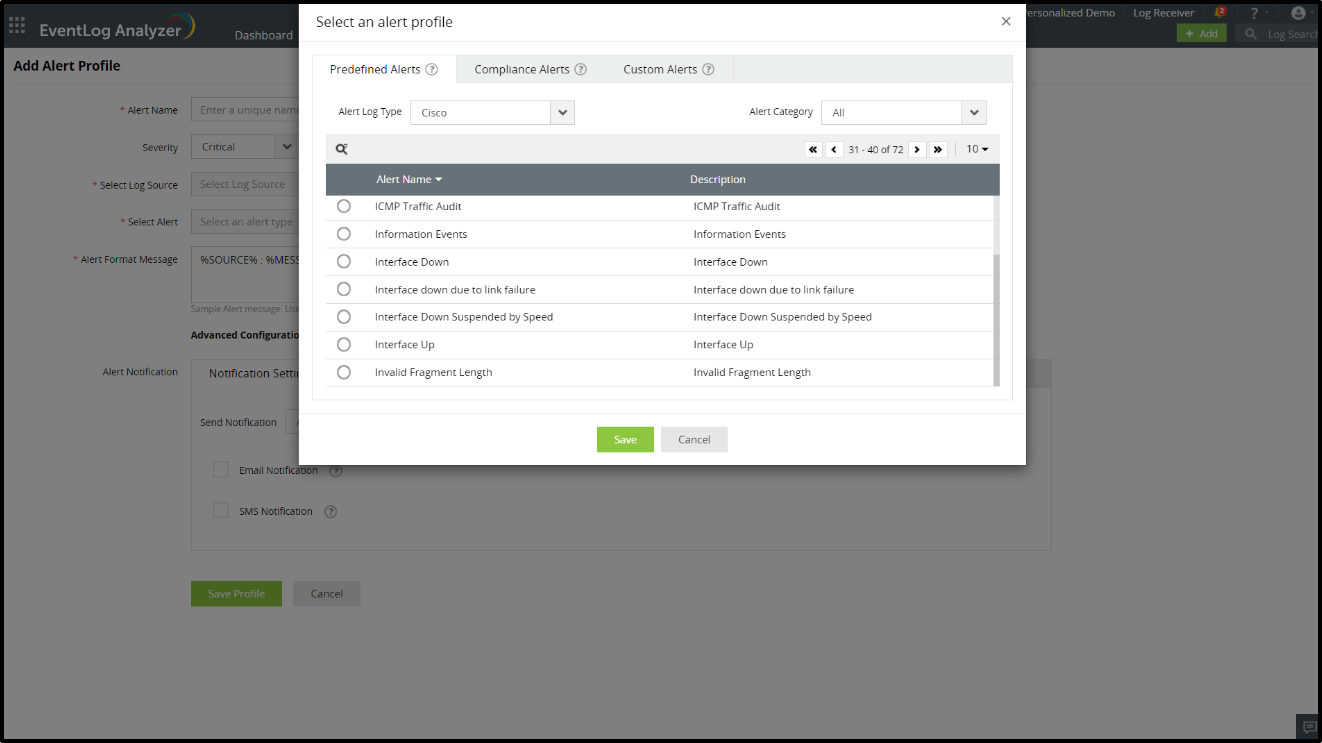
Get notified on critical events, warnings, and errors through EventLog Analyzer’s real-time alerting feature. Access the predefined alert profiles constructed based on Cisco switch logs. You can also customize the alerts and enable response workflows.
Frequently asked questions
How do I check logs on a Cisco switch?
Enter privileged EXEC mode with enable, then run show logging to view the log buffer. Messages appear with timestamps and severity levels. To narrow results, pipe the output: show logging | include ERROR. For centralized retention across multiple switches, forward logs to a Cisco log analyzer via syslog.
How do I check Cisco switch logs from the CLI?
Connect over console or SSH, run enable, then show logging to see buffered messages. Live output appears on a VTY session once you enable terminal monitor. For historical searches beyond the buffer, configure the switch to forward events to a syslog server that archives Cisco logs.
What are the main Cisco log commands?
Common commands: show logging displays the buffer, logging buffered <size> sets buffer size, logging host <ip> defines a syslog destination, logging trap <level> sets severity, and clear logging empties the buffer. Add terminal monitor on a remote session for live output. Feed to a switch log monitoring tool for retention.
What does the show log Cisco command do?
The correct syntax is show logging. It prints the configured logging destinations along with every message held in the local buffer since the last clear. Cisco switches don't retain logs across reloads, so pair the command with a syslog server for persistent storage and search.