Ticketing Tool Integration
With EventLog Analyzer, you can efficiently manage security incidents by raising tickets and assigning them to administrators for alerts that are generated. You can easily manage the incident within the EventLog Analyzer console itself or use an external help desk software for raising tickets. Under Alert Configurations, click on ticketing tool integration to configure an external help desk - ServiceNow, ManageEngine ServiceDesk Plus, Jira Service Desk, Zendesk, Kayako, or BMC Remedy Service Desk. Click Assign Rules to automatically assign tickets to admins based on devices/device groups upon the generation of alerts. In the Alerts page, you can always assign or update a ticket manually by clicking on the Update icon.
Manage Incident Configuration
To configure incident management with ticketing tools, click on ticketing tool integration under Alert Configuration. From the Incident Tool drop-down list, select the ticketing tool that you want to configure EventLog Analyzer with. Then, follow the following steps based on the ticketing tool used.
For ServiceNow:
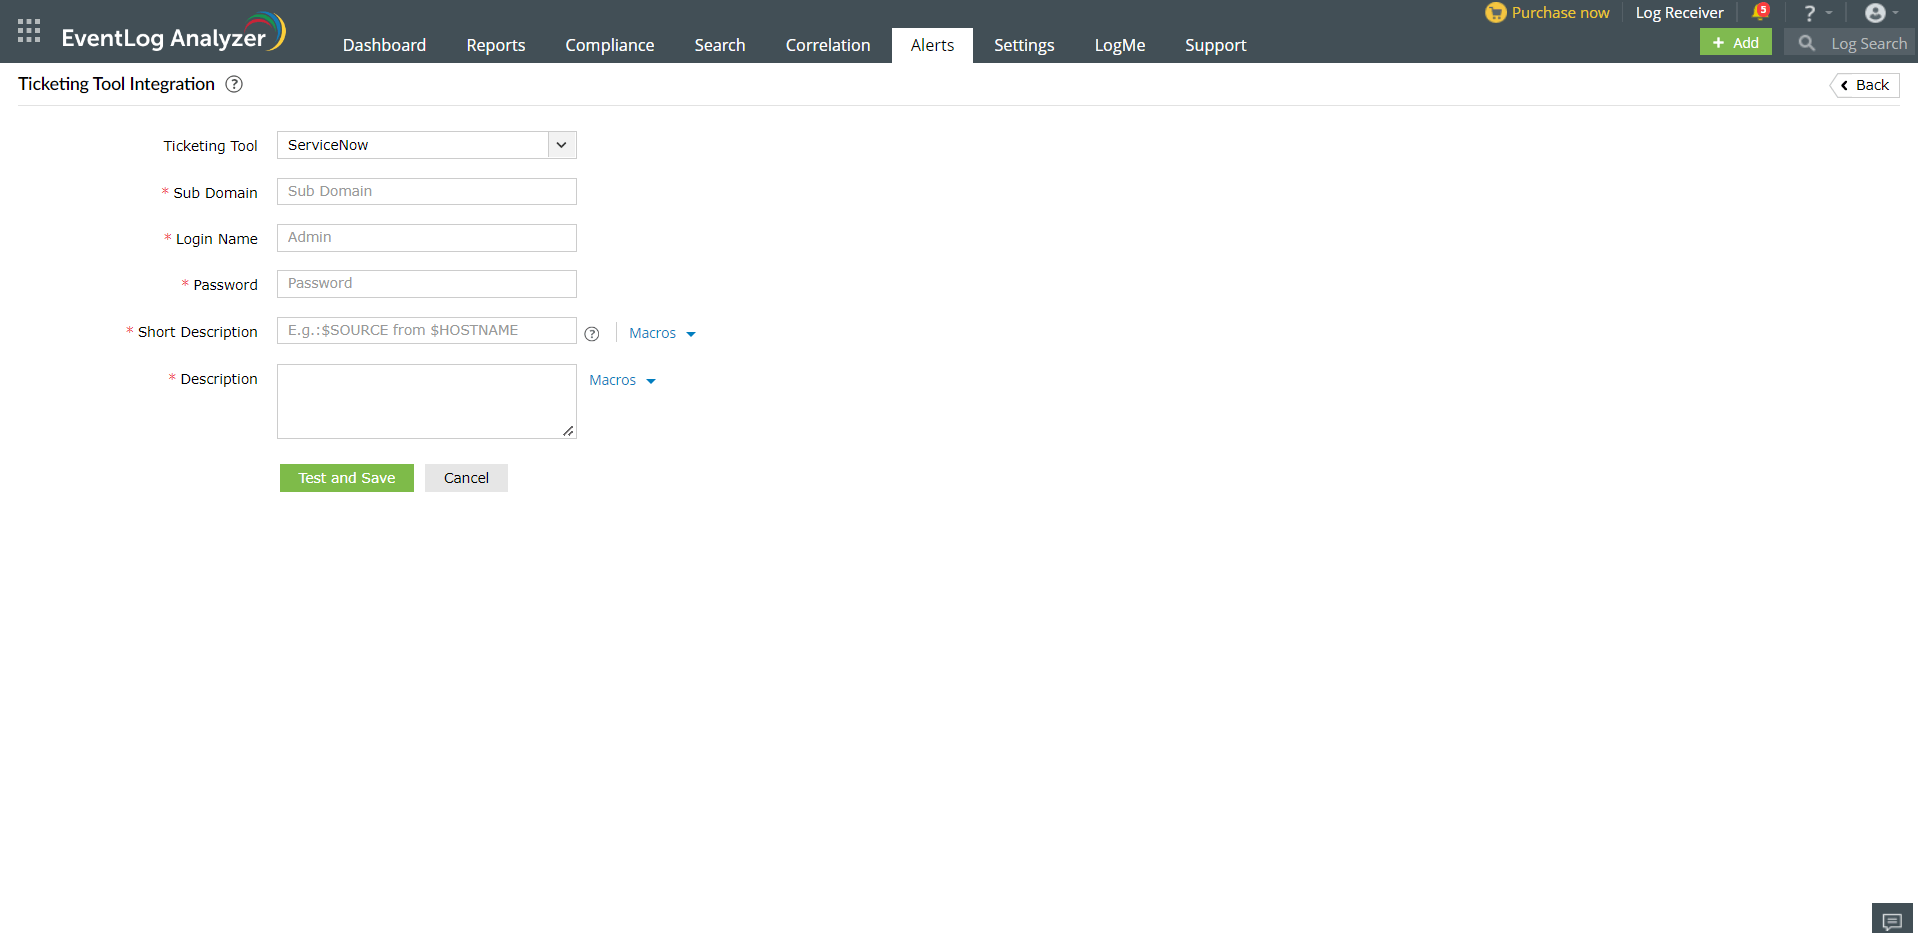
- Enter the ServiceNow subdomain name or IP address.
- Enter the login name and password of a valid account in the ticketing tool.
- Enter a short description and a description for the alert. You can select them from a predefined list available under Macros or type your own descriptions.
- Click the Test and Save button to establish communication and complete configuration.
For ManageEngine ServiceDesk Plus:
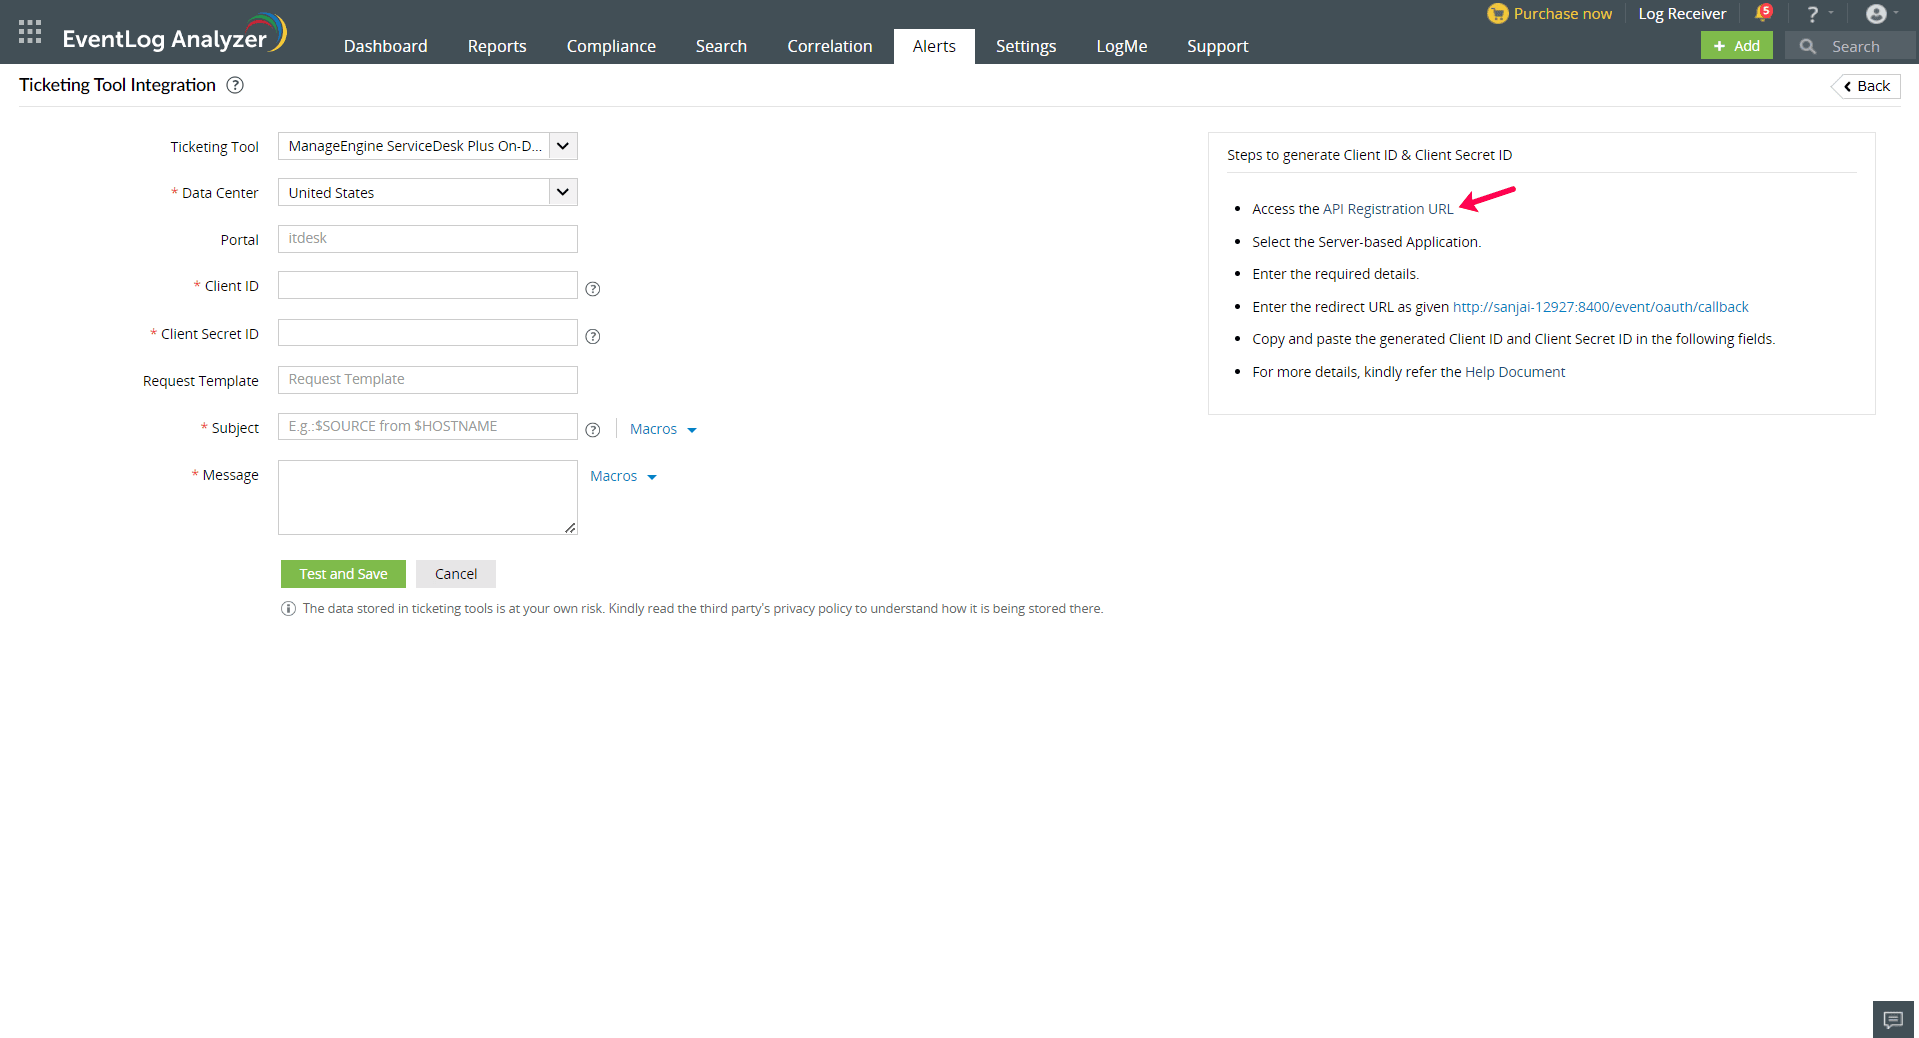
- Enter the ManageEngine ServiceDesk Plus server name or IP address.
- Enter the port number.
- Choose the protocol for communication - HTTP/HTTPS.
- Select the API type.
For Rest API:
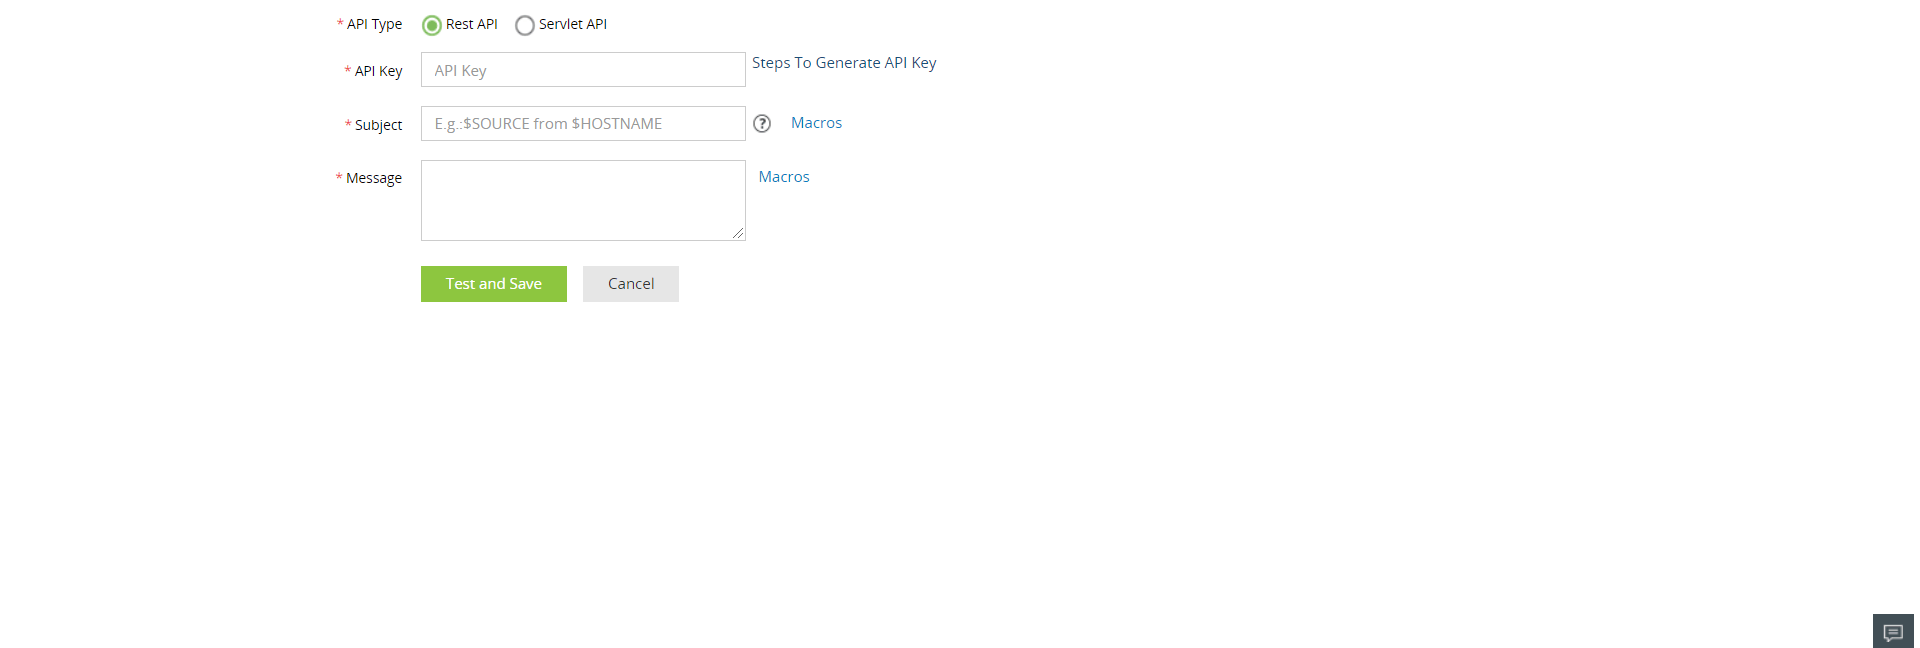
- Enter the API key in the appropriate column. If you do not have an API key click on Steps to Generate API Key for instructions on generating an API key in ServiceDesk Plus.
- Enter a subject for the alert. You can choose the subject from a predefined list available under Macros or type your own.
- Click the Test and Save button.
For Servlet API
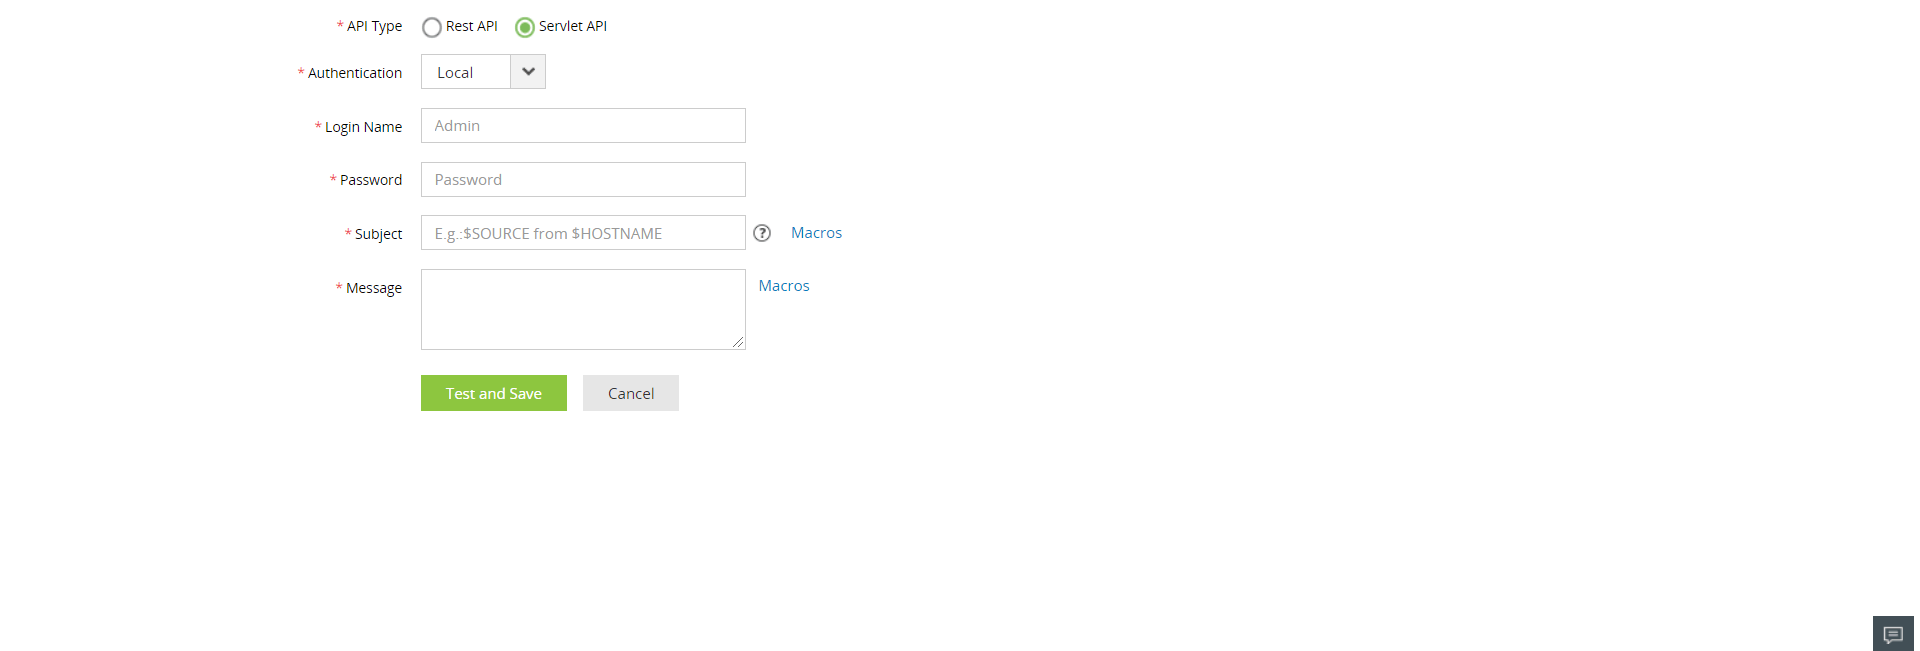
- Select the mode of authentication - Local or Active Directory.
- Enter the login name and password of the account.
- Enter a subject for the alert. You can choose the subject from a predefined list available under Macros or type your own.
- Click the Test and Save button to establish communication and complete configuration.
For Jira Service Desk:
To configure EventLog Analyzer with Jira Service Desk, you would first need to get a few details from your Jira ticketing tool.
- After logging into your Jira Service Desk account, click the settings icon on the top right corner and select Projects.
- In the project list, note down the Key corresponding to the project in which you want your tickets to be raised.
- Navigate to the Issues tab and reenter your username and password when prompted.
- Note down the type of issues that the particular project can hold. The issues raised from EventLog Analyzer should have the same type for a ticket to be successfully raised in Jira Service Desk.
- Close Jira Service Desk and open EventLog Analyzer to complete the configuration process.
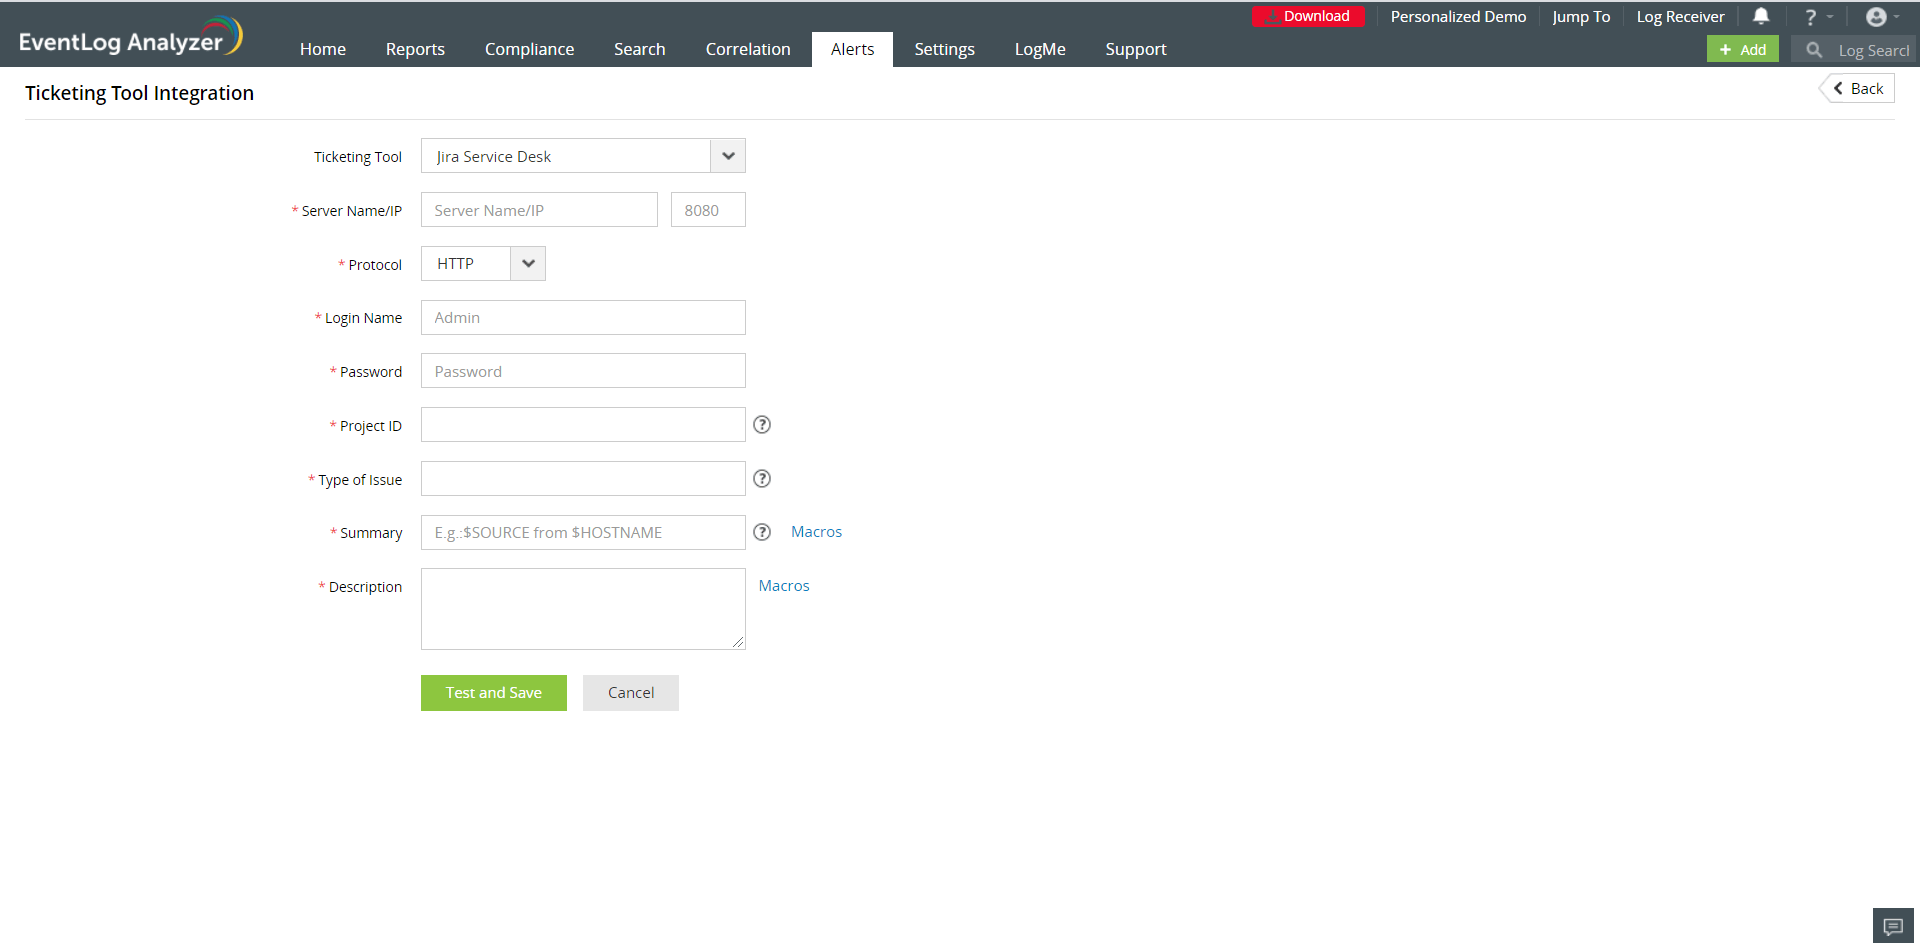
In EventLog Analyzer, navigate to the Alerts tab and click on ticketing tool integration under Alert Configuration. From the Incident Tool drop-down list, select Jira Service Desk.
- Enter the Jira Service Desk server name or IP address.
- Enter the port number.
- Choose the protocol for communication - HTTP/HTTPS.
- Enter the login name and password of the account having admin privileges.
- Enter the project ID. This is the Key of the particular project noted from the ticketing tool.
- Enter the type of issue. This needs to be same as the issue type that the project has been configured to hold.
- Enter a summary for the alert. You can select it from a predefined list available under Macros or type your own summary.
- Click the Test and Save button to establish communication and complete configuration.
For Zendesk
To configure EventLog Analyzer with Zendesk, you would first need to get a few details from your Zendesk ticketing tool.
- After logging into your Zendesk account, click the settings icon on the leftmost pane.
- In the left tab of the page, click API under Channels.
- In the right pane, move to OAuth Clients and click the + icon to create a new OAuth Client.
- Enter the client name, description, and name of the company. Select a logo.
- The value that appears corresponding to Unique Identifier needs to be saved in a separate document. This would be needed while configuring Zendesk in EventLog Analyzer.
- Once you click Save, a secret code will appear above the Save button. Click Copy and save it in a separate document. This would also be needed while configuring Zendesk in EventLog Analyzer.
- Click Close and open EventLog Analyzer to complete the configuration process.
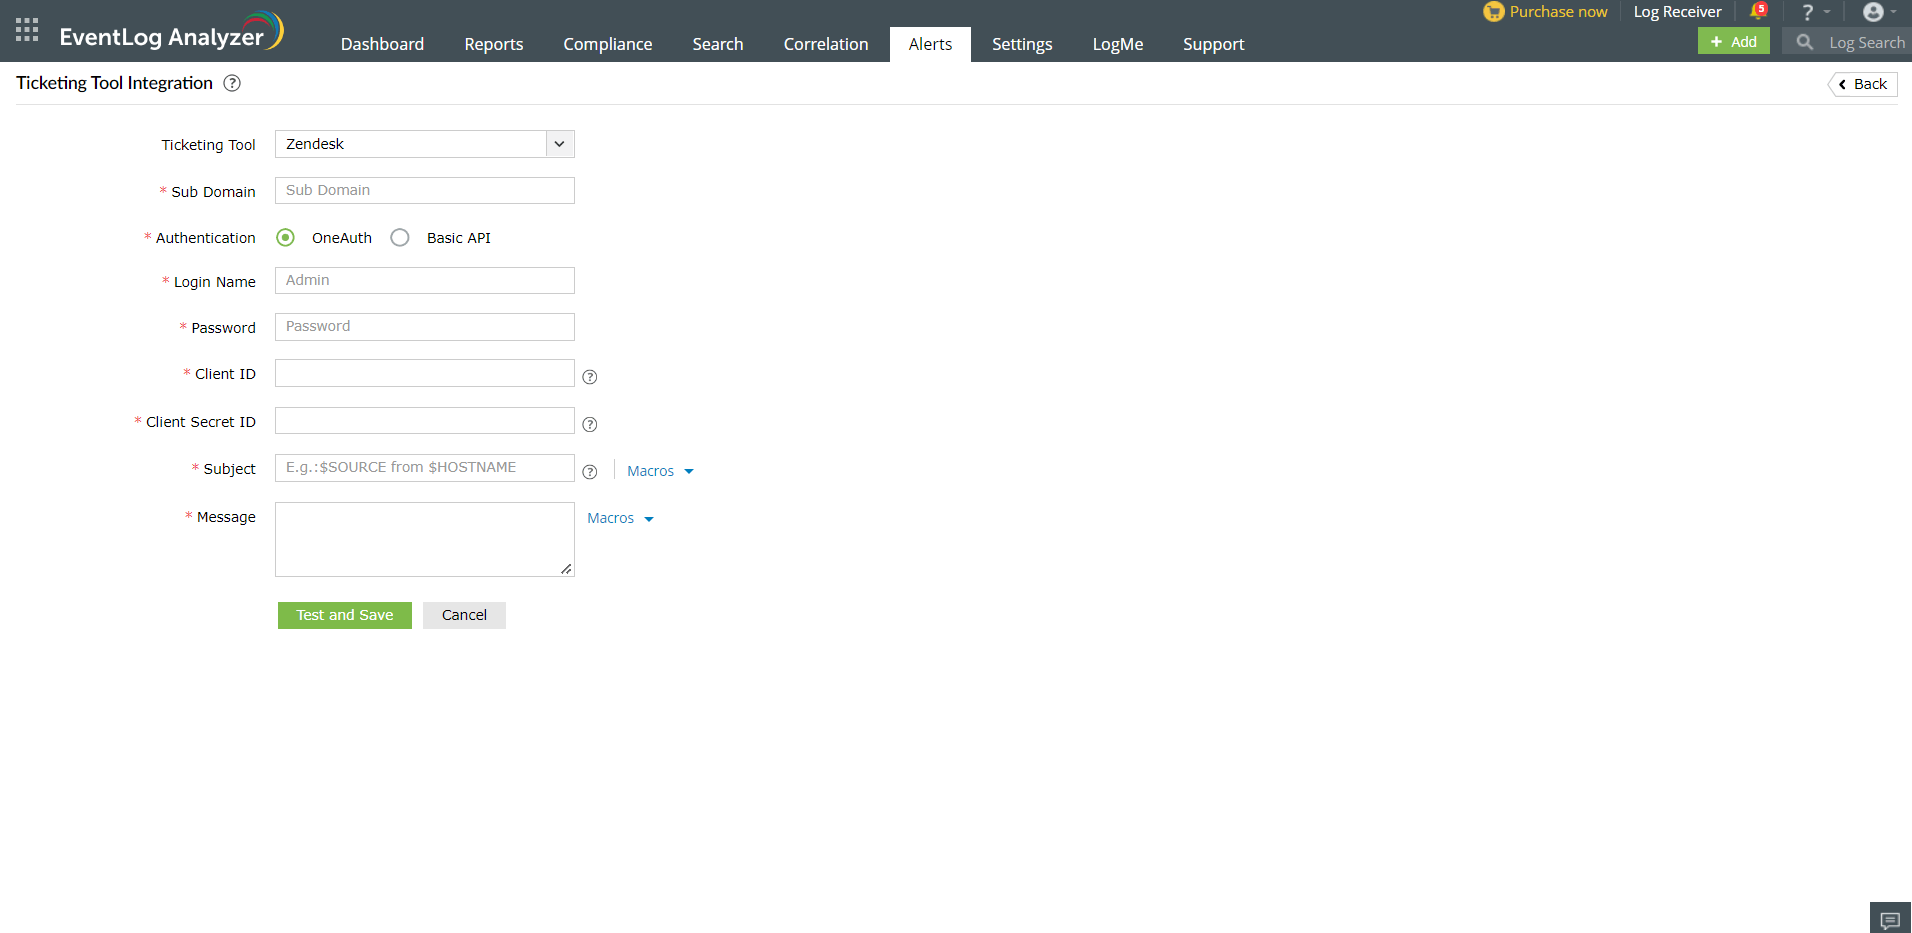
In EventLog Analyzer, navigate to the Alerts tab and click on ticketing tool integration under Alert Configuration. From the Incident Tool drop-down list, select Zendesk.
- Enter the Zendesk subdomain name.
- Enter the login name and password of a valid account in the ticketing tool.
- Enter the client ID. This is value of Unique Identifier noted from the ticketing tool.
- Enter the client secret ID. This is the value of the secret code obtained from the ticketing tool.
- Enter a subject and a message for the alert. You can select them from a predefined list available under Macros or type your own.
- Click the Test and Save button to establish communication and complete configuration.
For Kayako:
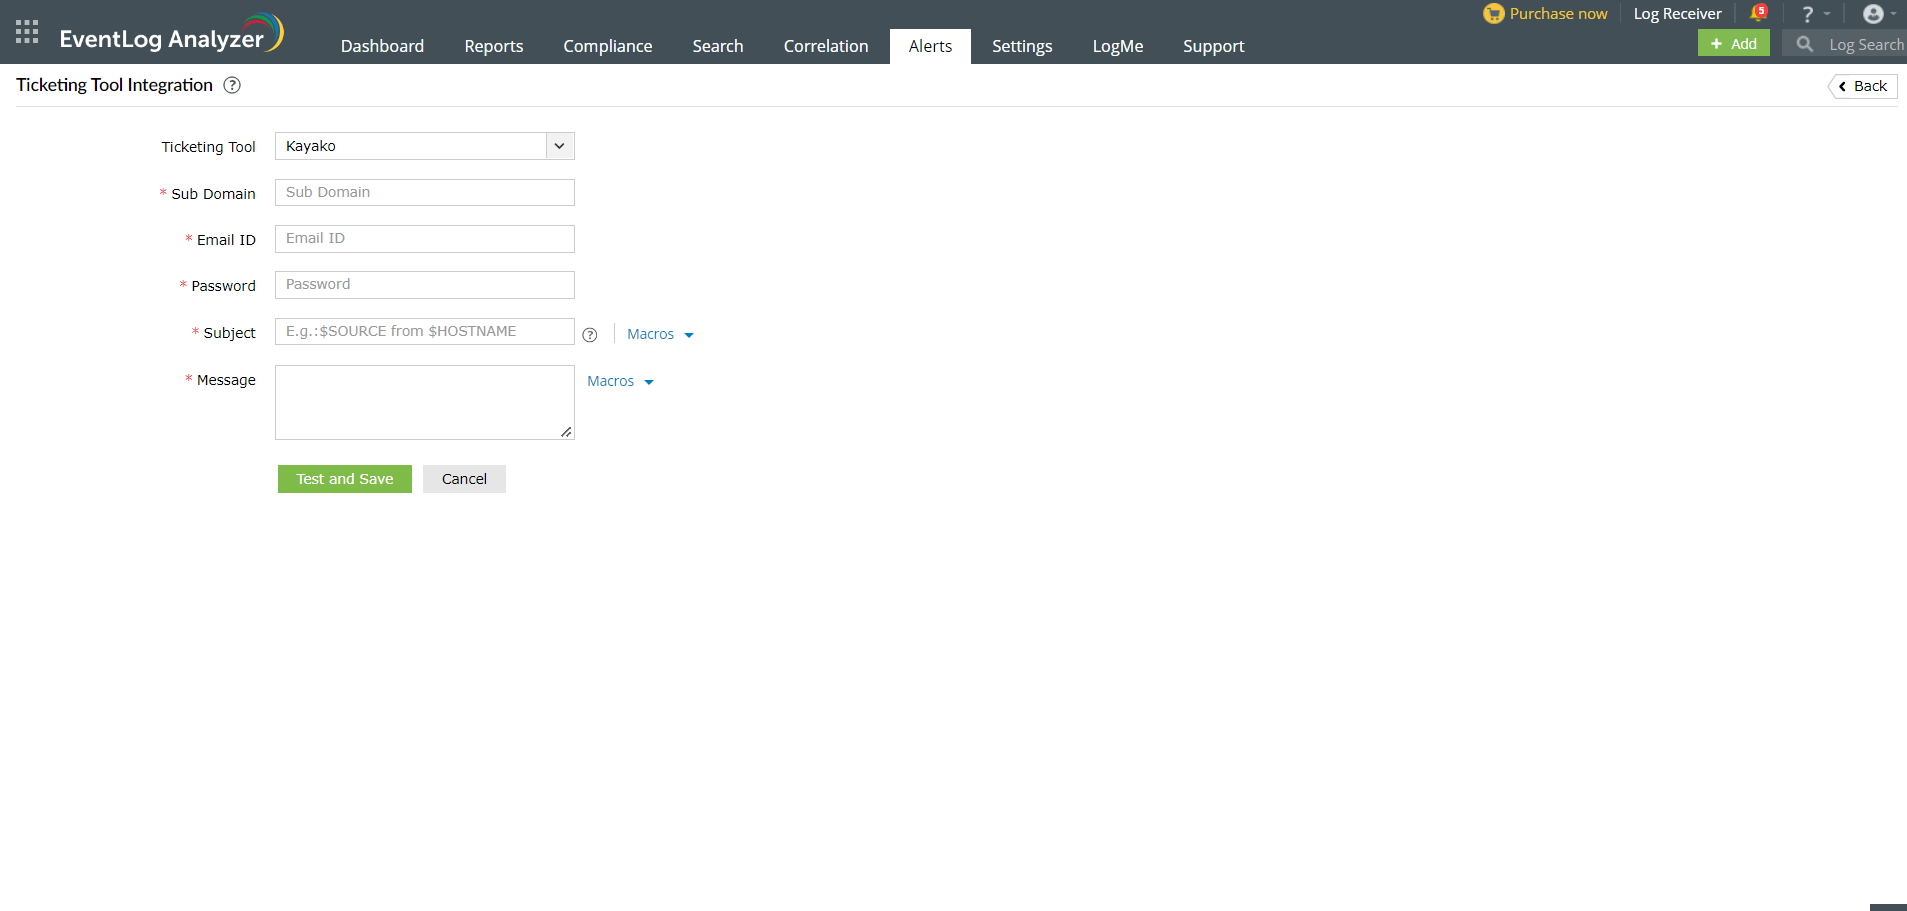
- Enter the Kayako subdomain name.
- Enter the login name and password of a valid user in the ticketing tool.
- Enter a short description and a description for the alert. You can select the descriptions from a predefined list available under Macros or type your own descriptions.
- Click the Test and Save button to establish communication and complete configuration.
For BMC Remedy Service Desk:
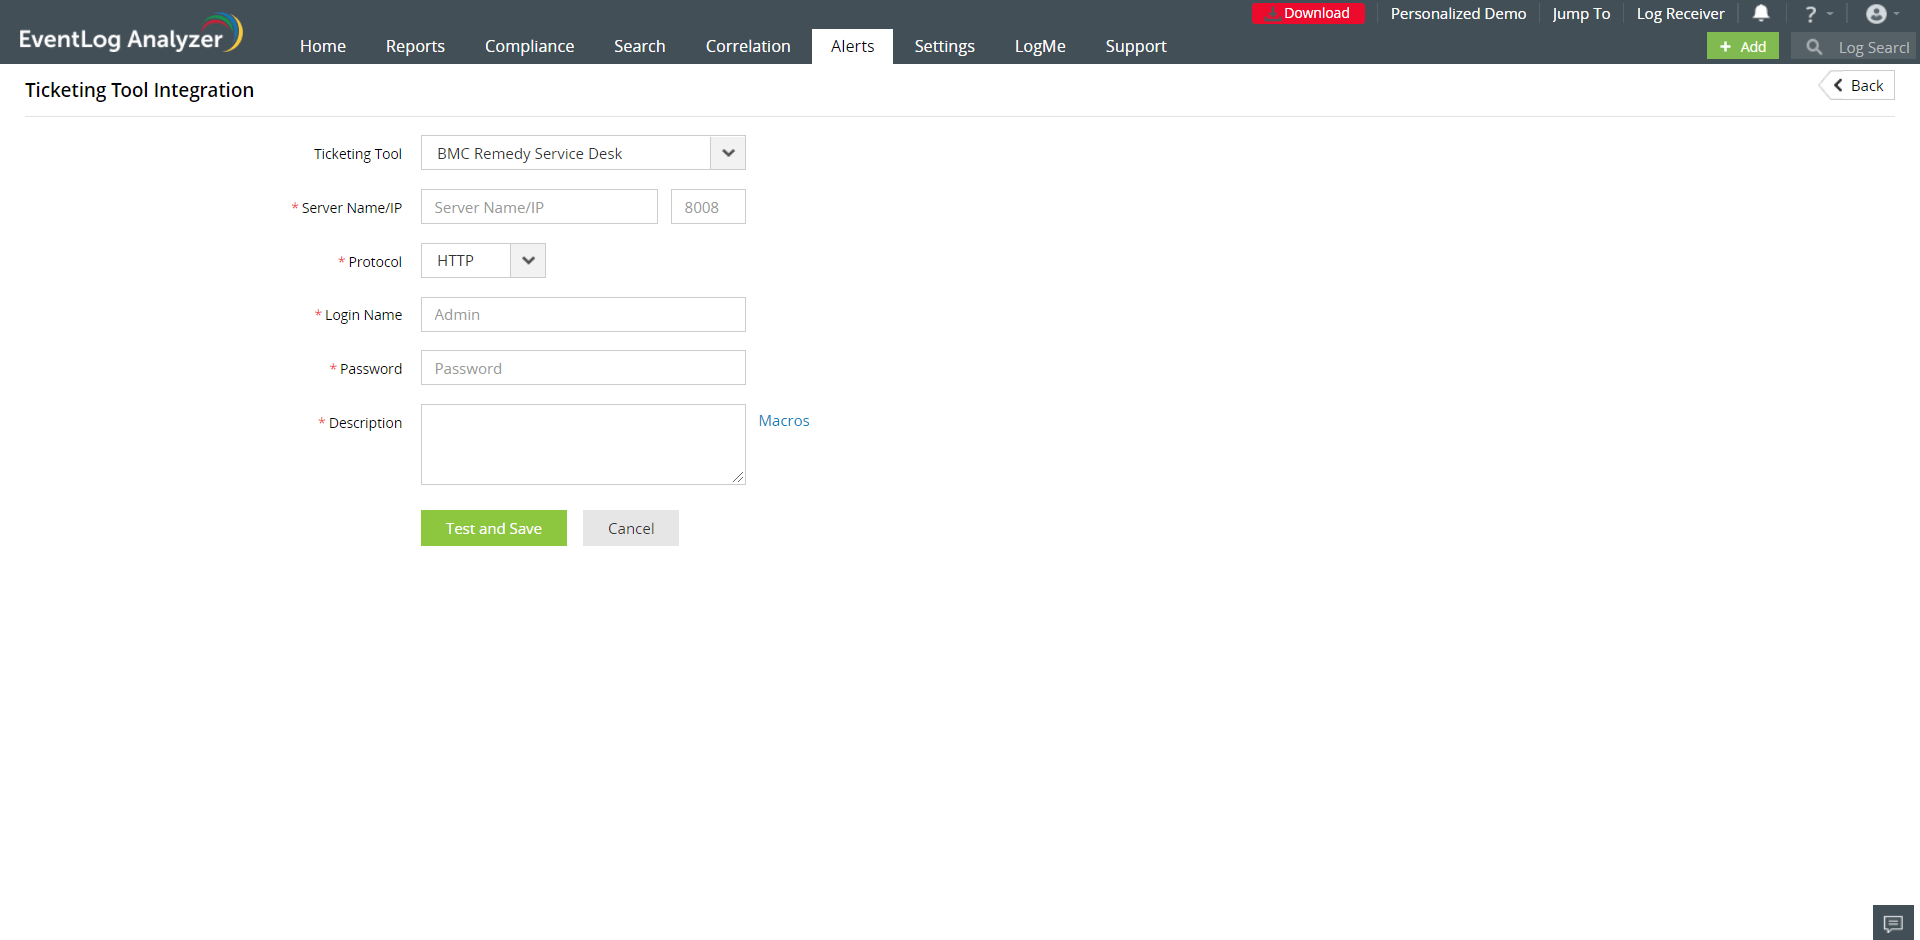
- Enter the BMC Remedy Service Desk server name or IP address.
- Enter the port number.
- Choose the protocol for communication - HTTP/HTTPS.
- Enter the login name and password of the account having admin privileges.
- Enter a description for the alert. You can choose the description from a predefined list available under Macros or type your own description.
- Click the Test and Save button to establish communication and complete the configuration.
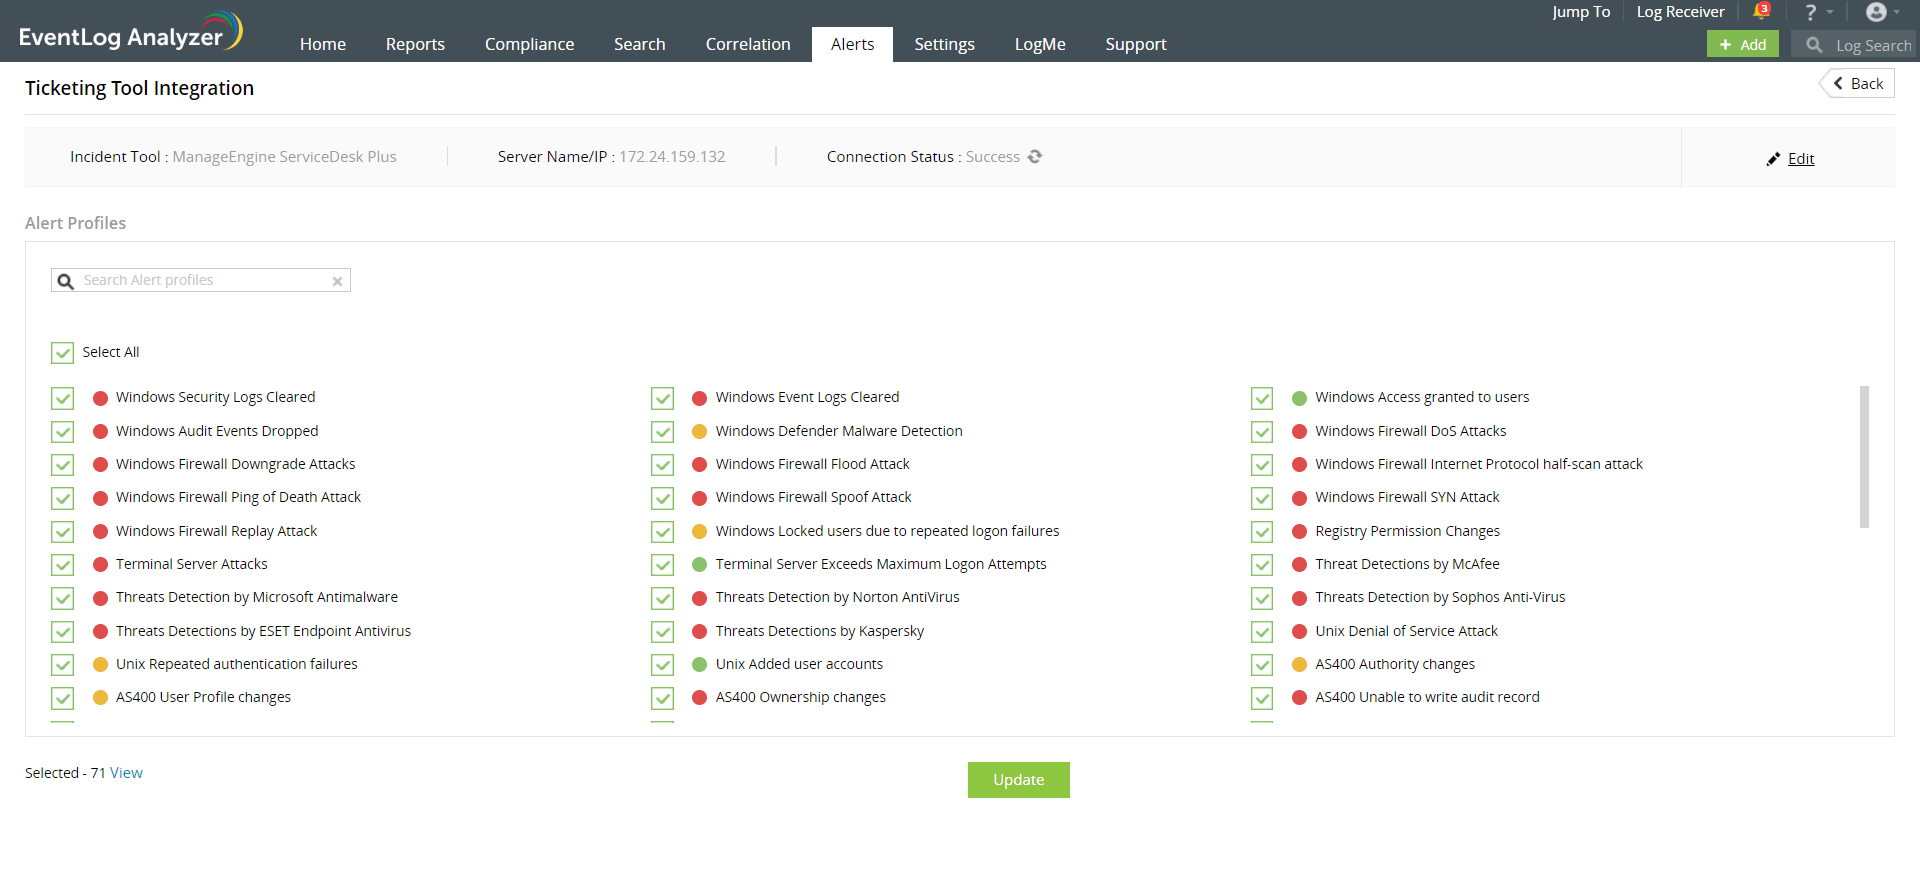
After configuring EventLog Analyzer with the ticketing software, you can select the alert profiles for which tickets need to be raised.
In the ticketing tool integration page, you will have a list of existing alert profiles. Select the ones for which you want a ticket to be raised. You can search for specific alert profiles using the search box. You can also select all the alert profiles by ticking the Select All check box. If Select All is checked, all the alert profiles added in the future will be automatically selected and tickets will be raised for them as well. Once you've completed selecting the alert profiles, click Update.