How to troubleshoot event ID 1001: An application or system crash in Windows
Last updated on:Quick answer:
What is Event ID 1001?
Event ID 1001 is logged by the Windows Error Reporting (WER) infrastructure when a crash or fault occurs on a Windows system. The entry is written to the Application event log after an application terminates abnormally, the system encounters a BugCheck, or the kernel detects a driver fault that it recovers from.
Fastest triage: Open Event Viewer > Windows Logs > Application, filter for event ID 1001, and review the fault bucket type and faulting module on the General tab. Repeated Event ID 1001 entries involving the same module can indicate a recurring application bug, driver failure, or hardware issue.
Event ID 1001 can be associated with three common fault types: An application crash, a Blue Screen of Death (BugCheck) event, or a LiveKernelEvent entry. A common LiveKernelEvent value is 141, which is typically associated with a GPU or display driver timeout.
In this page
What Windows Error Reporting Event ID 1001 means
Event ID 1001 is a passive notification logged by the Windows Error Reporting (WER) infrastructure in the Application event log. The event itself does not cause a problem, and it does not fix one either. It simply records that an error occurred and, in most cases, that a crash dump file was generated for it.
The same event ID wraps three fault types, and knowing which one you have determines the repair path:
- Application crash: A user-mode program terminated abnormally. Fixes will reside in the application and its dependencies.
- BugCheck: WER's record of a Blue Screen of Death (BSOD). Fixes will reside in drivers, hardware, or system file integrity.
- LiveKernelEvent: The kernel caught a hardware or driver fault and recovered without crashing. Fixes will almost always reside in the driver of the device that stalled, most often the GPU.
One more distinction saves time: a LiveKernelEvent is not a BSOD. It means the system detected the fault and kept running, so you are chasing an unstable component, not a full crash. For environments with multiple Windows systems, Windows log management can help centralize these event logs, making it easier to monitor recurring errors and investigate issues across systems.
Get deeper visibility into Windows crashes across your environment
Centralize Windows Error Reporting activity from every endpoint and alert on BSOD events in real time.
Common causes of Event ID 1001
The fault type and faulting module is the entry point to the underlying cause. In production environments, most Event ID 1001 entries trace back to one of the four causes below.
1. Graphics and kernel-mode driver faults
An unstable, outdated, or conflicting driver is the most frequent cause. A LiveKernelEvent 141 with a display driver in the fault bucket—nvlddmkm.sys (NVIDIA), atikmpag.sys (AMD), or igdkmd64.sys (Intel)—indicates a GPU watchdog timeout, while a BugCheck that names a driver in the crash dump points to a faulty or incompatible kernel-mode driver. Crashes that begin immediately after a driver installation usually trace back to that update.
2. Application faults
APPCRASH and BEX64 entries record a user-mode program terminating abnormally. An access violation (exception 0xc0000005) commonly follows a corrupt installation, an incompatible add-in, or a damaged dependency. In these cases the fault is contained to the application rather than the operating system.
3. Memory and hardware failure
Heap corruption (exception 0xc0000374), recurring BugCheck events that name a different module each time, and intermittent crashes under load often indicate failing RAM or storage rather than a single software defect. Overheating hardware, particularly the GPU, can produce the same pattern.
4. System file corruption
Damaged operating system files can destabilize otherwise healthy applications and drivers, producing crashes that surface as Event ID 1001 with no consistent faulting module. This cause is worth ruling out early, because the repair is quick and low-risk.
How to find and read Event ID 1001 in Event Viewer
Before applying any fix, read the entry so you are repairing the right thing. This works the same on Windows 10 and Windows 11.
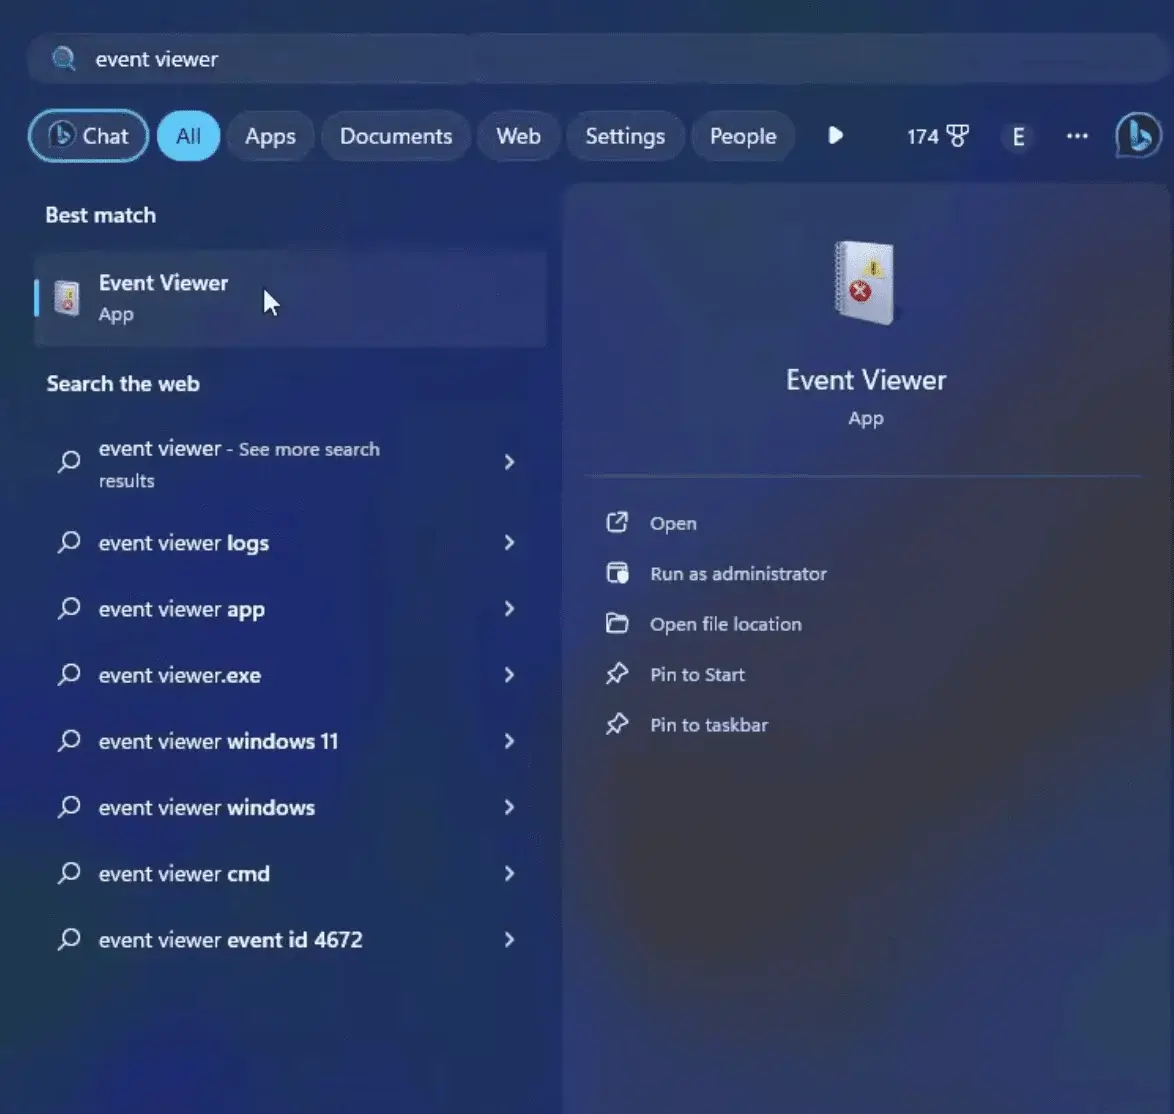
- Press Win + R, type eventvwr, and press Enter to open Event Viewer.
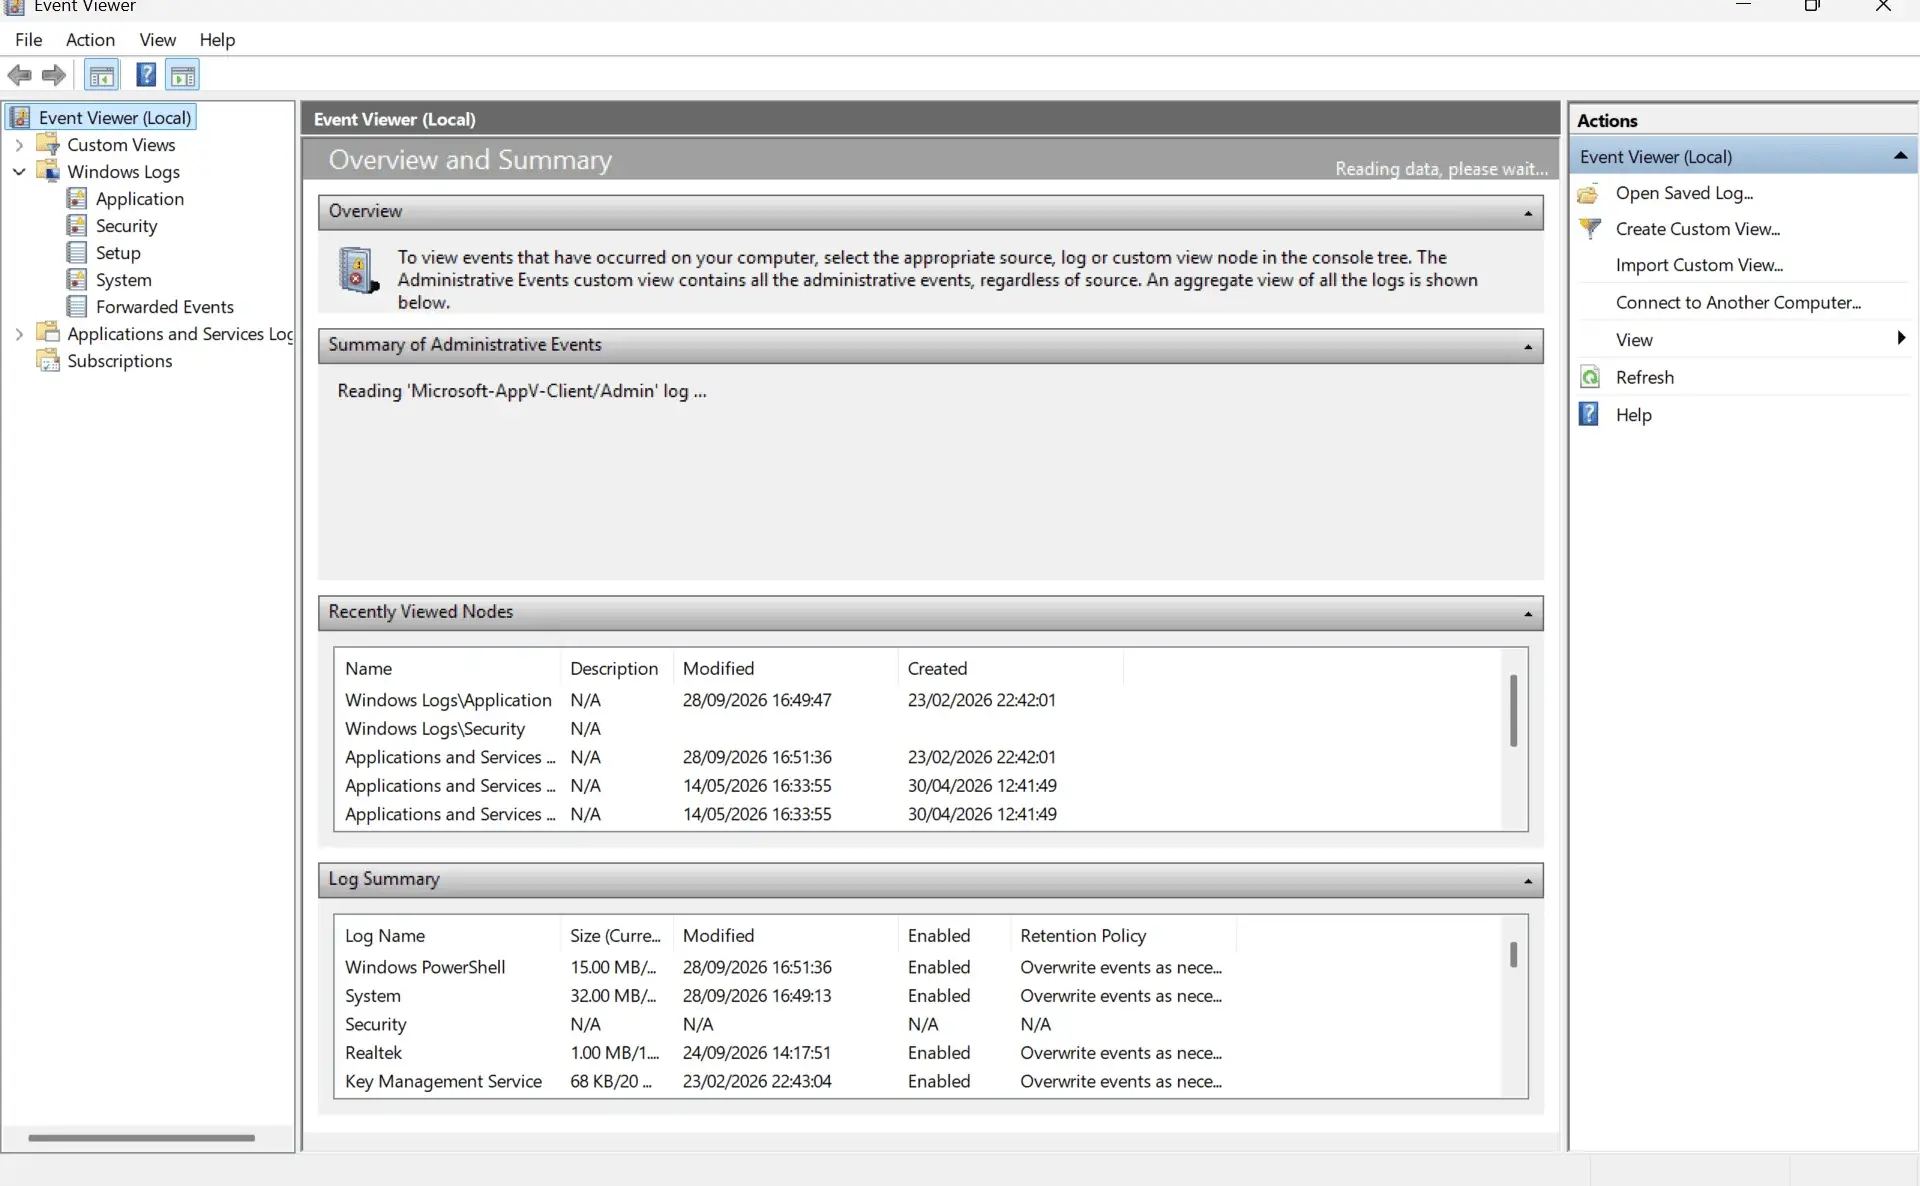
- Expand Windows Logs and select Application (the channel where WER writes its entries).
- In the Actions pane, choose Filter Current Log, enter 1001, and click OK.
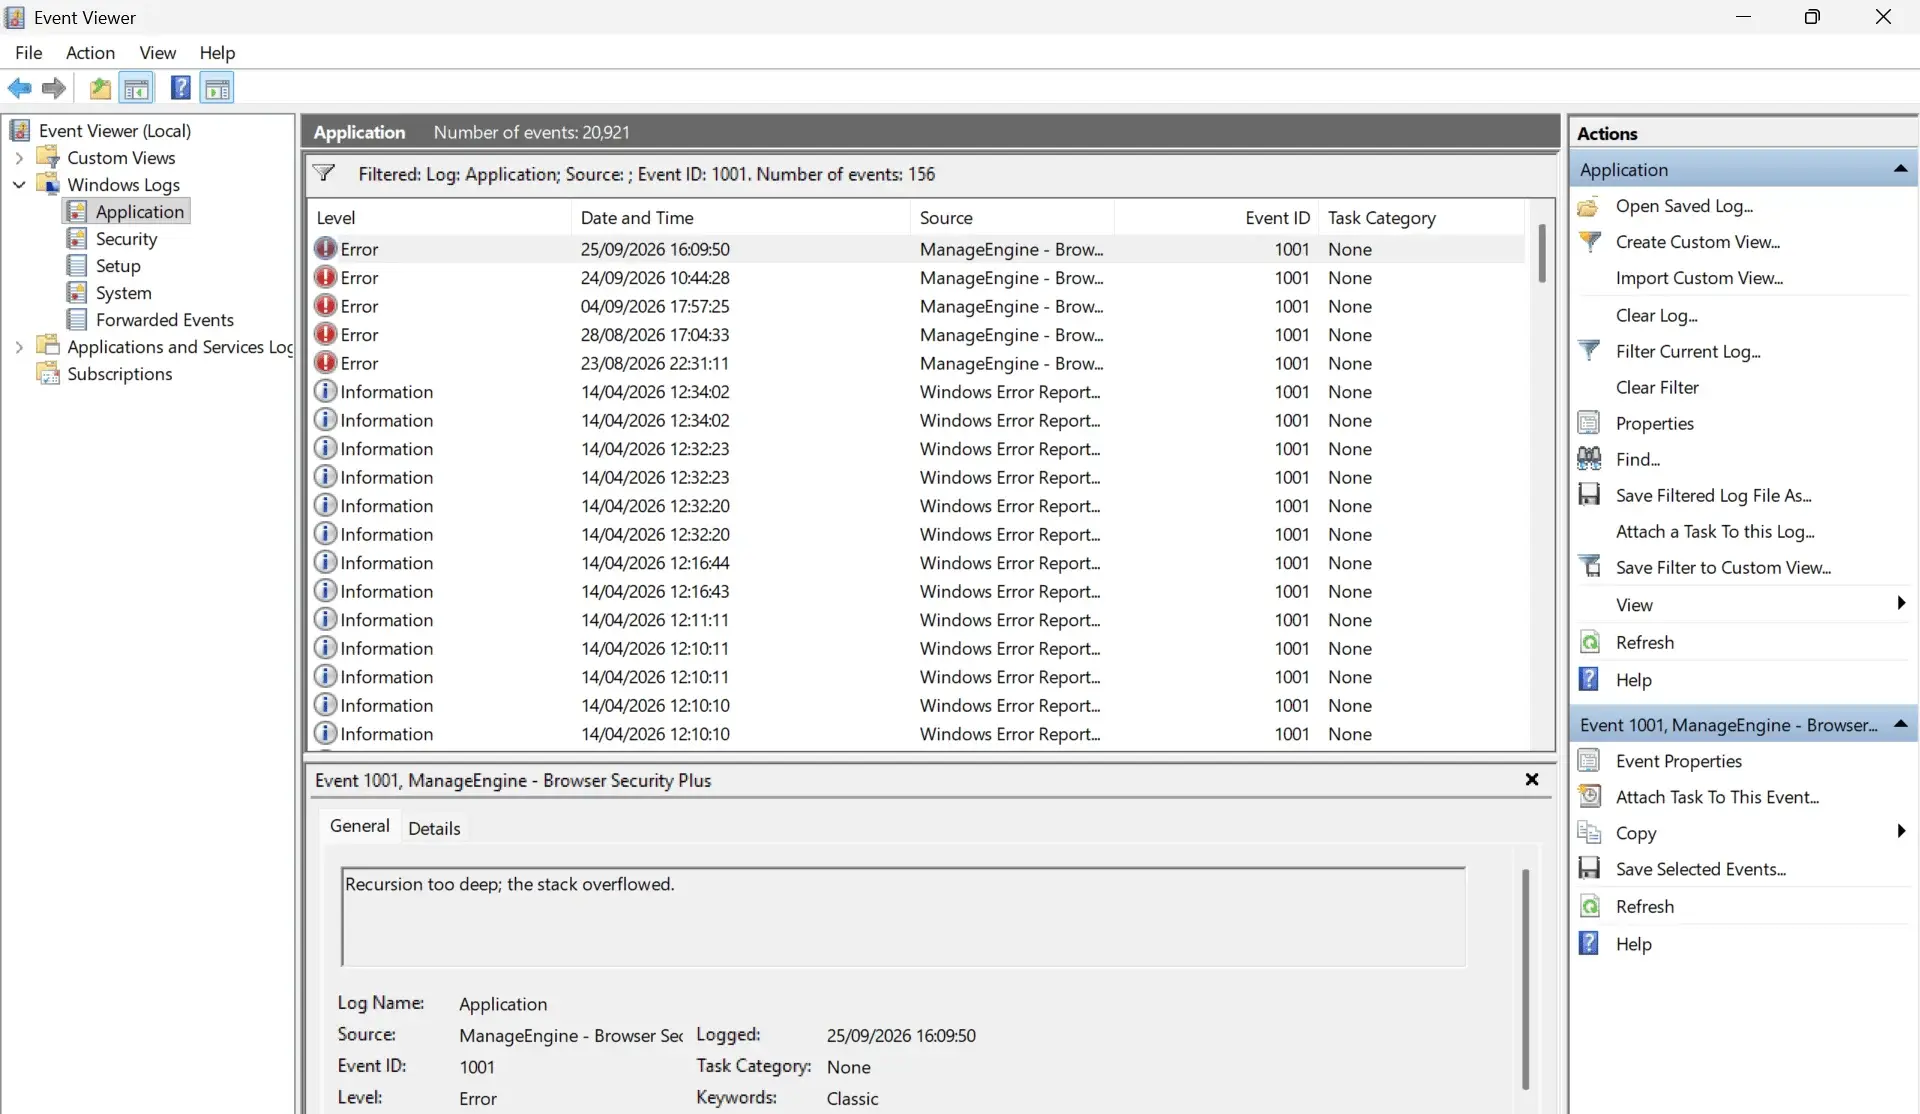
- Open an entry and read the General tab for the event name (LiveKernelEvent, BugCheck, APPCRASH), the faulting application or driver, and any stop or exception code.
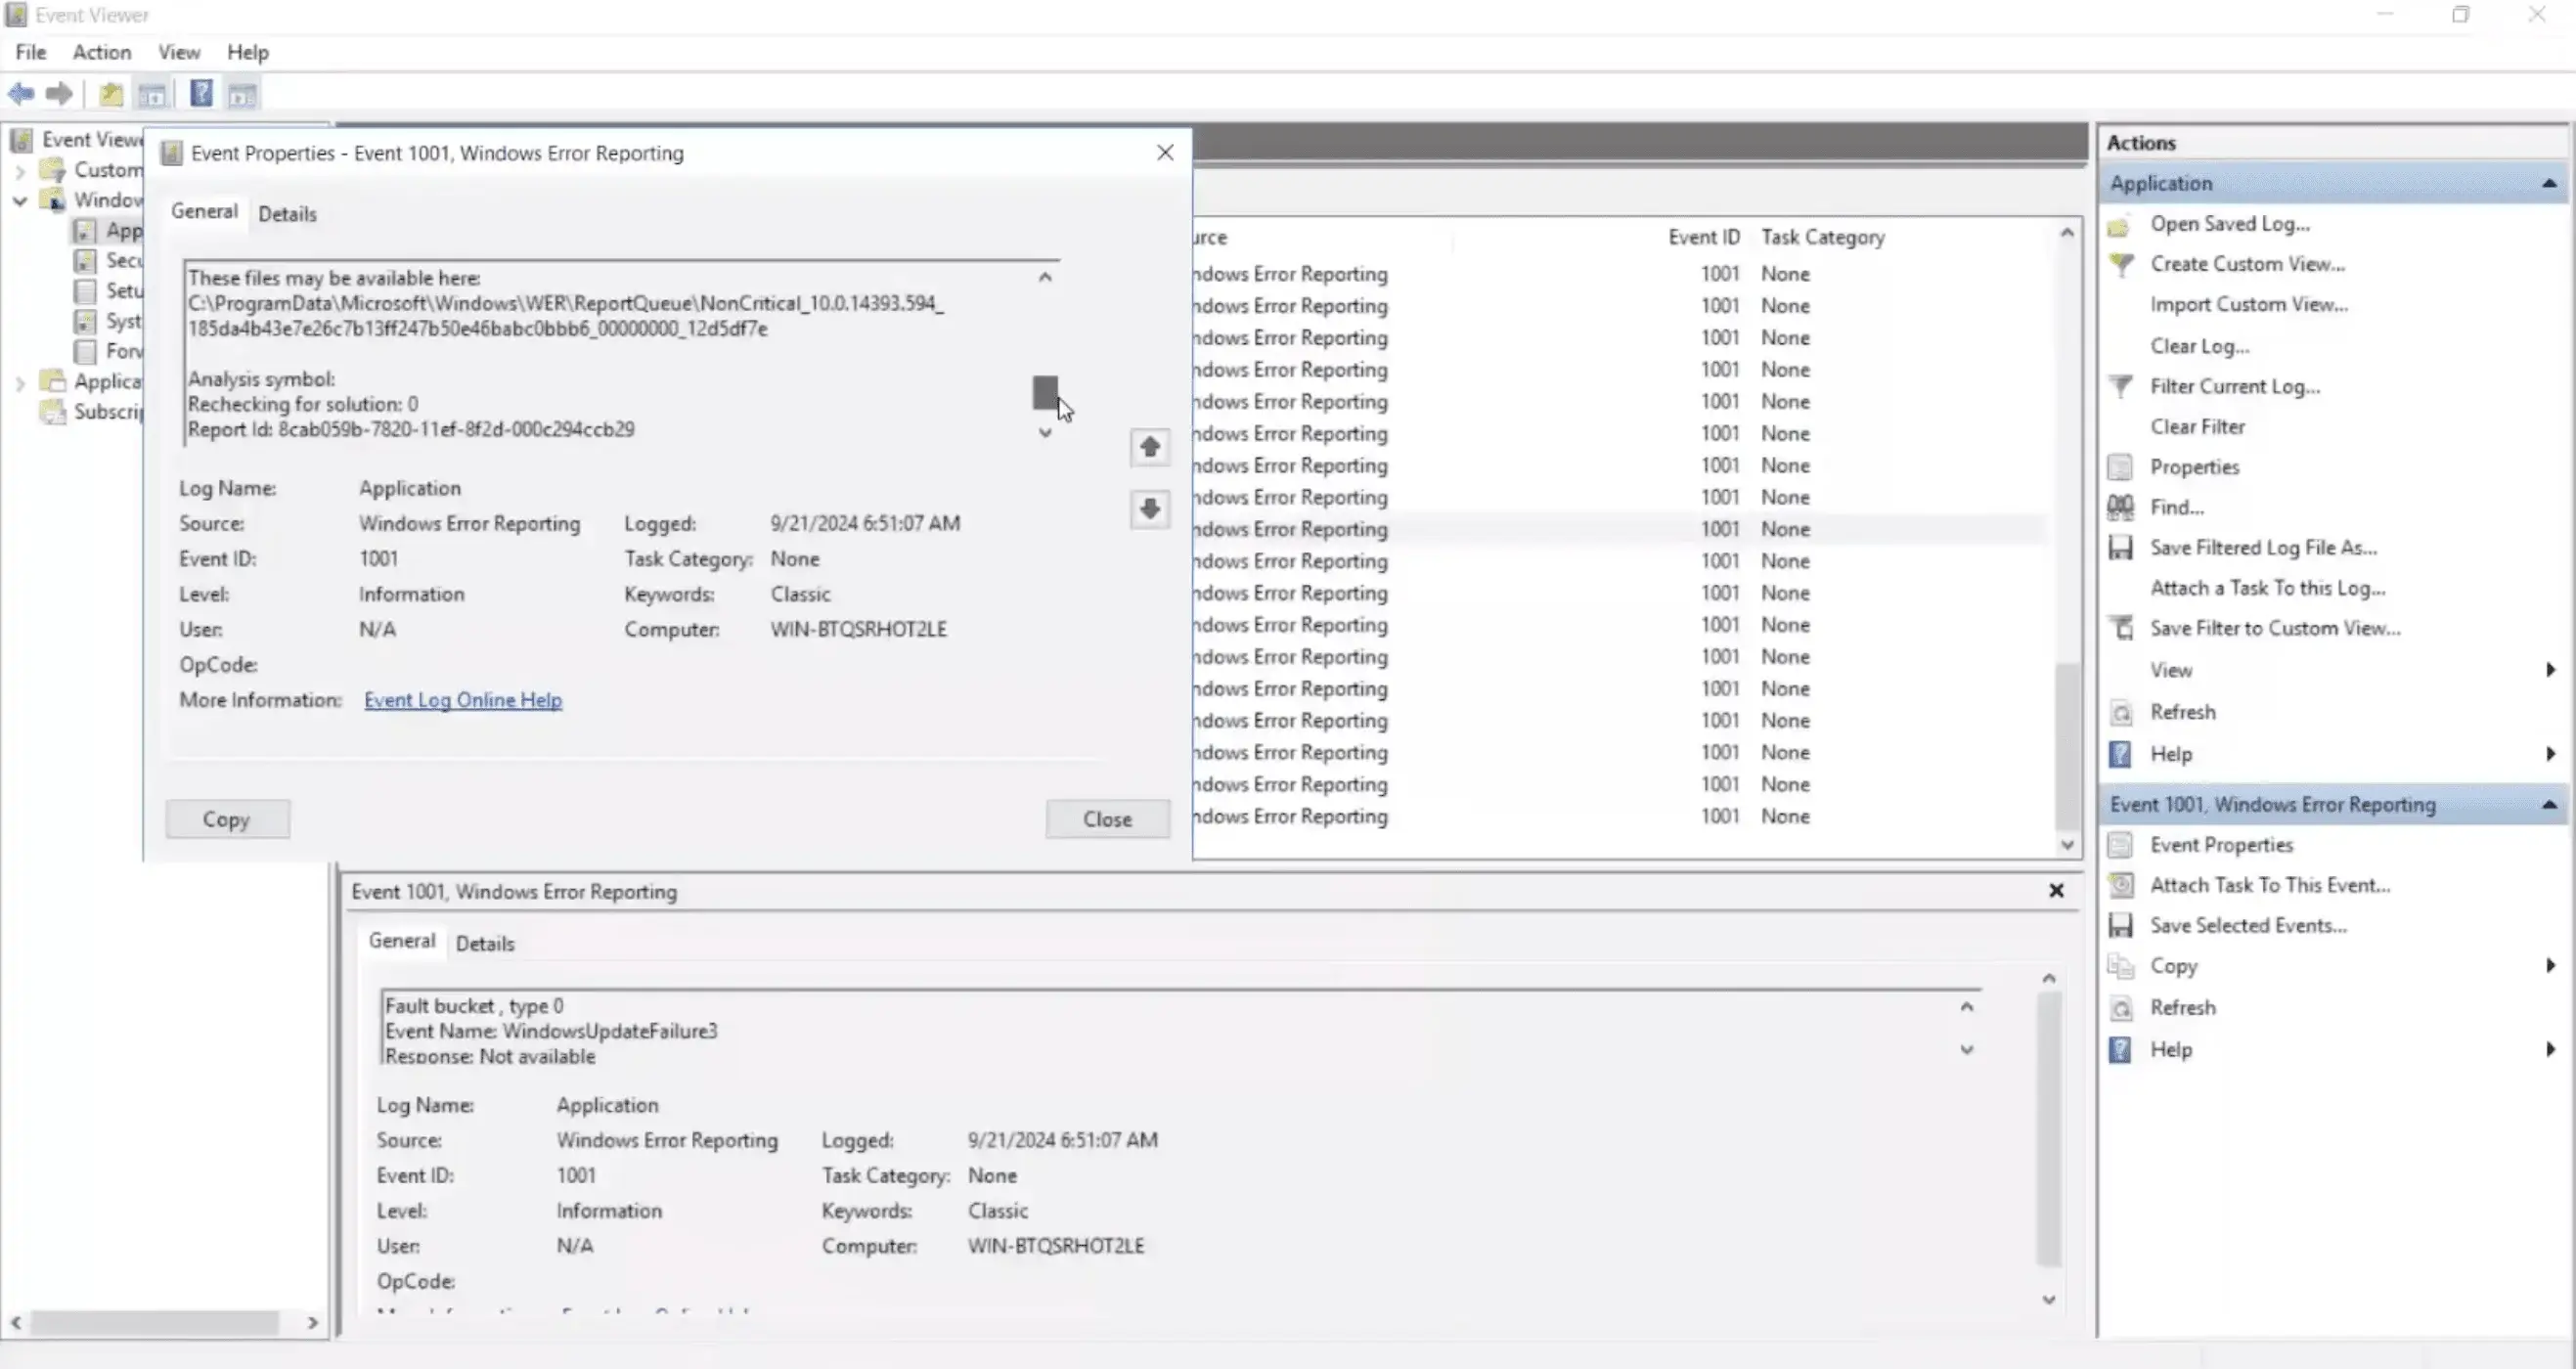
- Note the timestamp in the Logged field, then look for Event ID 1000 just before it. Event ID 1000 names the faulting module and exception code, so pairing the two confirms exactly what failed.
Two exception codes are worth recognizing on sight: 0xc0000005 is an access violation (the program touched memory it did not own), and 0xc0000374 is heap corruption (memory management was already damaged before the crash surfaced). For LiveKernelEvent entries, a companion report is written to C:\WINDOWS\LiveKernelReports; a fresh file there confirms the kernel captured data for that event.
How to fix Event ID 1001
Once you have identified the fault type and faulting module in Event Viewer, work through the four fix tracks below in order. They move from the fastest, lowest-risk repairs to the deeper diagnostics you reach for when the cause is not yet obvious.
1. Repair OS corruption (system file integrity check)
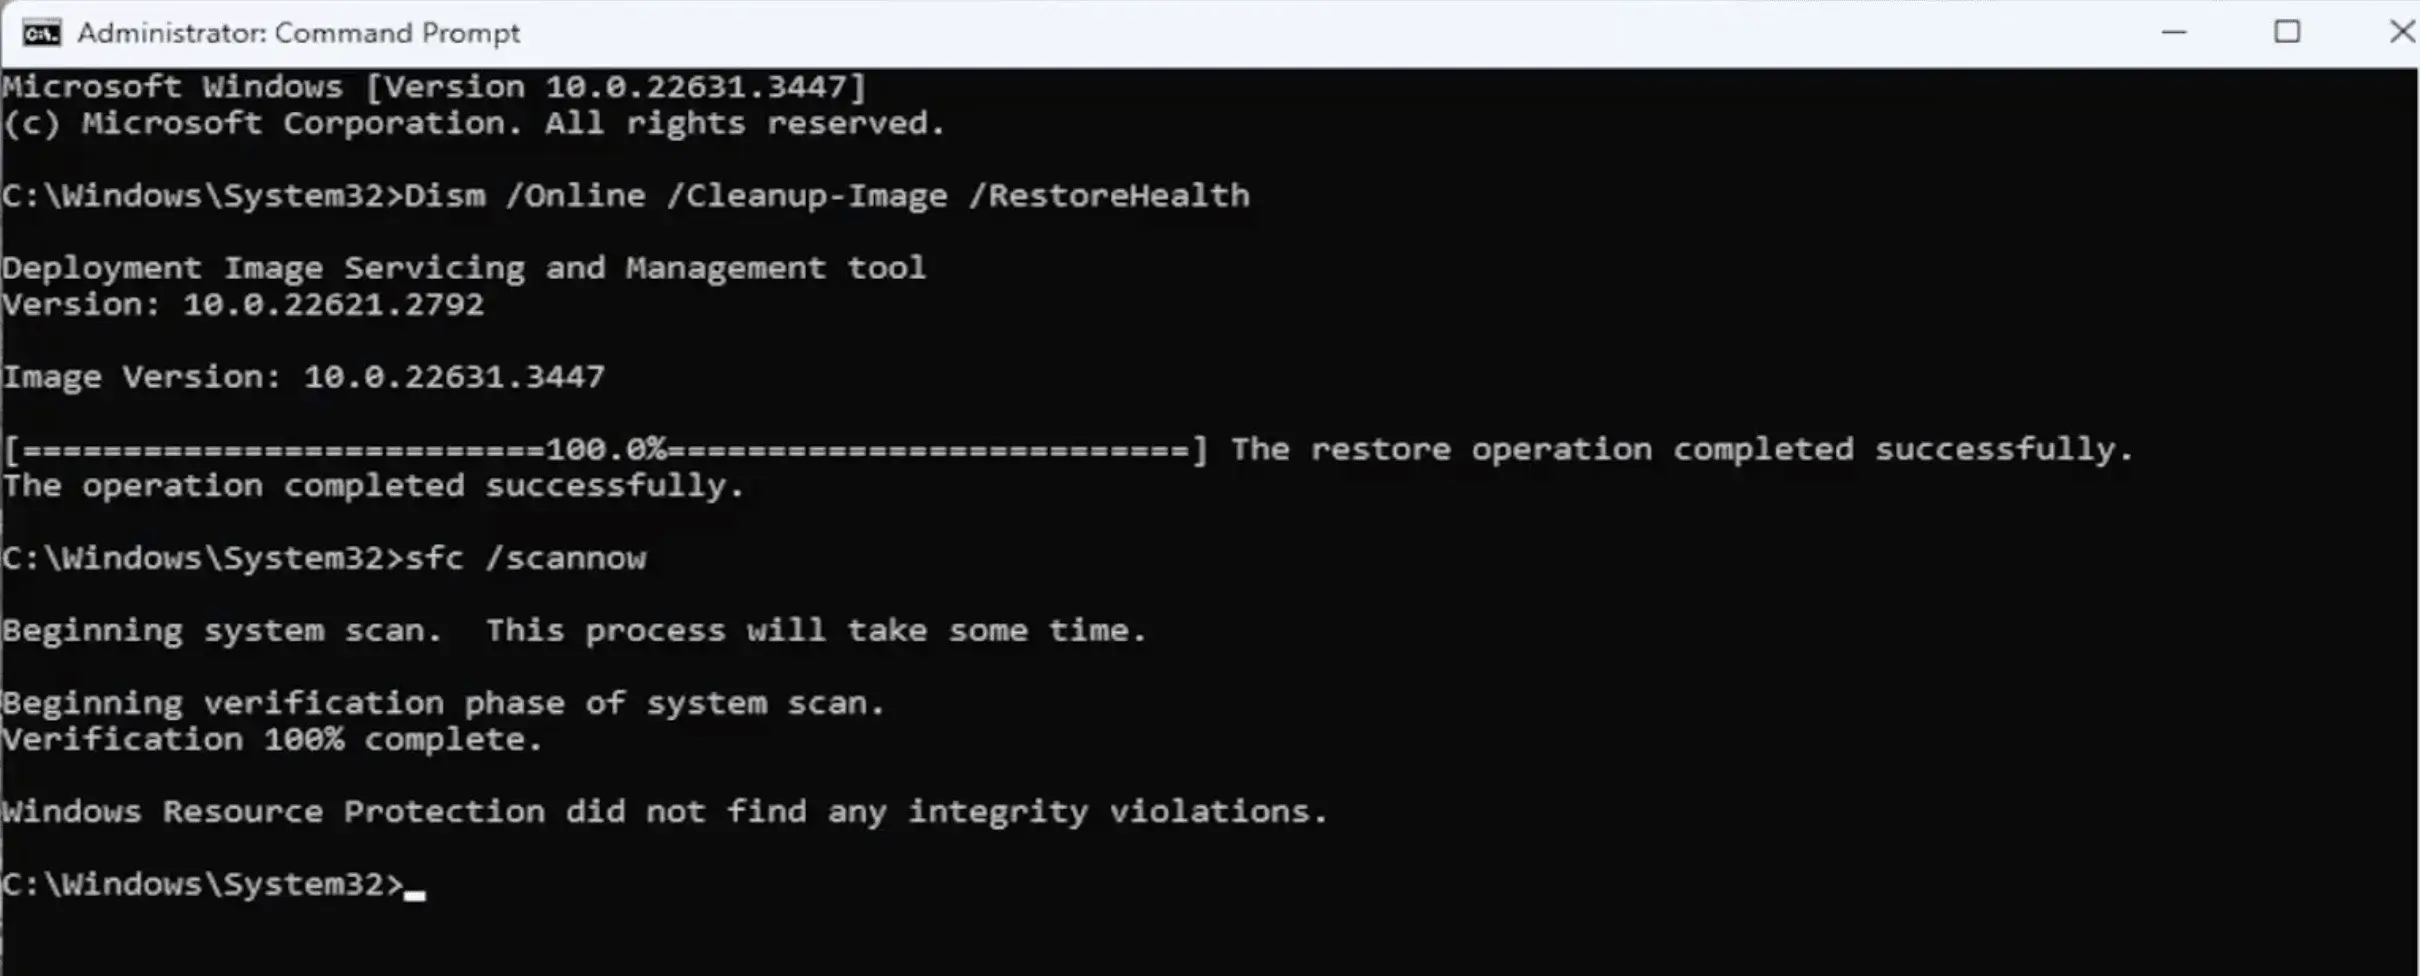
Corrupted system files can cause crashes that surface as Event ID 1001. Run a system file integrity check first, because it is quick and non-destructive. Open Command Prompt and run the Windows integrity checker:
sfc /scannow
DISM /Online /Cleanup-Image /RestoreHealth
sfc /scannow performs the Windows file integrity check against protected system files and repairs what it can; DISM /RestoreHealth repairs the underlying component store that SFC draws on. Running the check system integrity Windows 10 / 11 pair together resolves a large share of corruption-driven crashes. Reboot and re-check the Application log for new Event ID 1001 entries.
2. Rule out failing hardware (hardware diagnostics)
If the crashes continue, rule out physical failure before going deeper into software. As part of the hardware diagnostic Windows 10 / 11 workflow to rule out failing RAM, storage, or GPU hardware: Run the built-in Windows Memory Diagnostic to test RAM; manufacturer or third-party tools such as MemTest86 for exhaustive memory testing; and CrystalDiskInfo for storage health.
Running hardware diagnostics to identify failing components
Run Windows Memory Diagnostic by pressing Win + R, typing mdsched.exe, and choosing to restart and check now. For storage, run CrystalDiskInfo or your drive manufacturer's tool and confirm the SMART status reads healthy. For the GPU, check temperatures under load with HWiNFO or GPU-Z; sustained high temperatures point to thermal throttling or a cooling fault. A clean hardware scan lets you rule out physical failure as the cause of Event ID 1001 before you spend time on software fixes, so this hardware check Windows step is worth doing early rather than last.
3. Read the crash dump (crash dump file analysis)
When the fault type or module is still unclear, read the crash dump directly. Dumps for BugCheck events live in C:\WINDOWS\Minidump, and LiveKernelEvent reports live in C:\WINDOWS\LiveKernelReports.
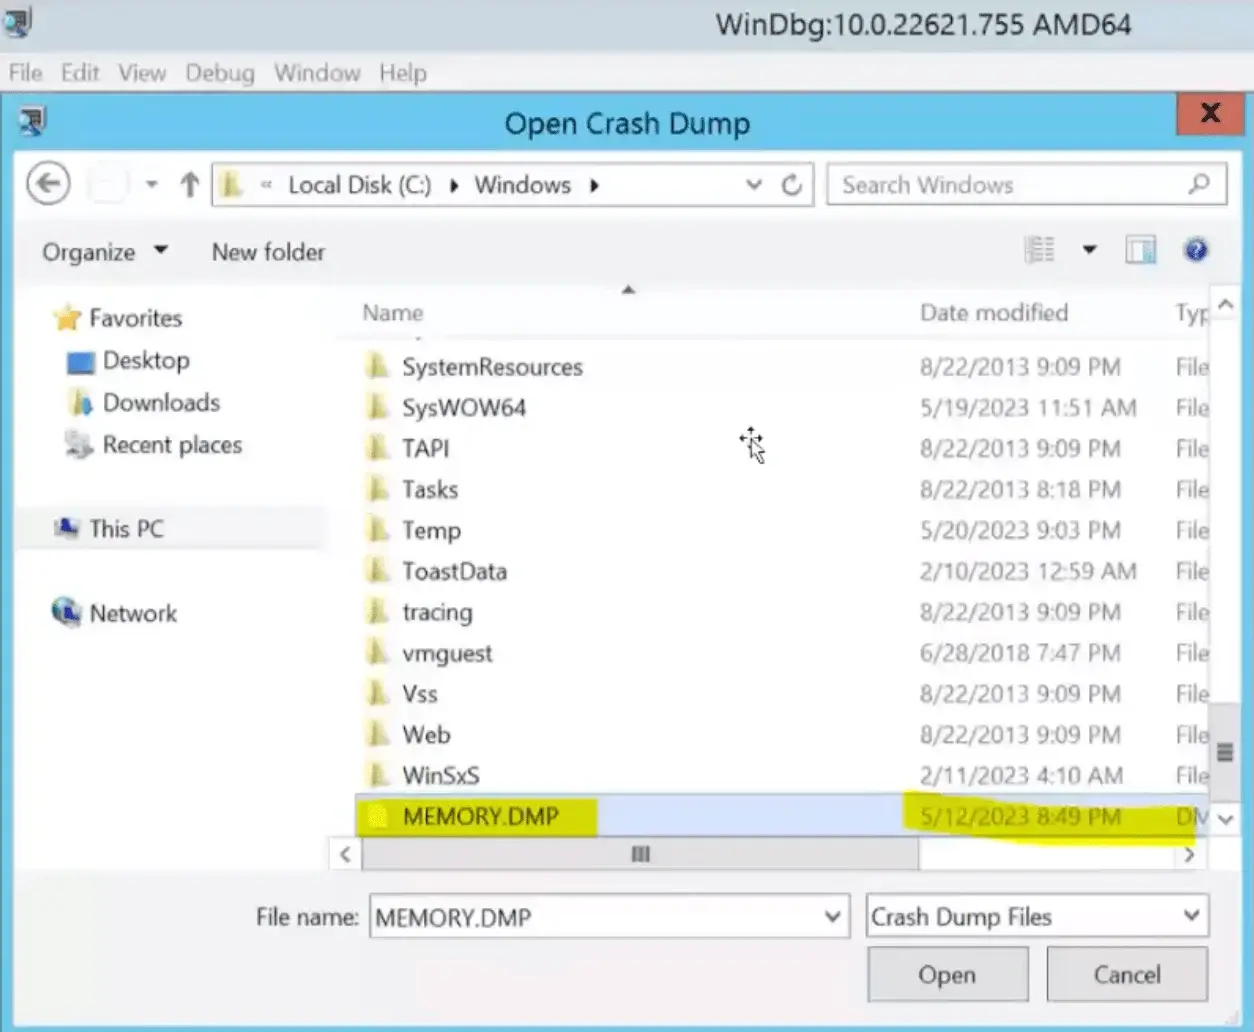
Analyzing crash dump files to diagnose the BugCheck error
Open the .dmp file with WinDbg (the Windows kernel debugging tool) or the online Microsoft crash dump analyzer. In WinDbg, load the dump and run !analyze -v; the output extracts the BugCheck error code, the faulting driver, and the memory address involved. This is your crash dump reader of choice for turning a raw dump into a named cause. When the faulting module is a non-Microsoft component, share the dump with that third-party software vendor—their engineers can read symbols you do not have access to. Learning to open a crash dump file this way is often the difference between guessing and confirming the BugCheck error.
4. Isolate software conflicts (clean boot)
If nothing above points to a clear cause, perform a clean boot to isolate third-party software conflicts. Run msconfig, disable all non-Microsoft services (use the Hide all Microsoft services checkbox first so you do not disable the OS), reboot, and see whether the crashes stop. Re-enable services in batches to narrow down the culprit.
Two advanced options help when applications do not produce dumps on their own. Configure WER local dump collection via registry keys under HKLM\SOFTWARE\Microsoft\Windows\Windows Error Reporting\LocalDumps to capture dumps from applications that do not generate them by default. And enable the page heap flag with GFlags (gflags /p /enable yourapp.exe /full) to trace memory corruption to the exact allocation that caused it.
For enterprise environments running many Windows endpoints, manually correlating Event ID 1001 entries across machines in Event Viewer is time-consuming and does not scale. ManageEngine EventLog Analyzer's predefined Windows Error Reporting reports and BSOD alert templates centralize this analysis, surfacing correlated Event ID 1000 and 1001 pairs automatically across every monitored host.
How ManageEngine EventLog Analyzer helps analyze and troubleshoot event ID 1001
Manually correlating event ID 1001 entries across multiple Windows endpoints in Event Viewer does not scale. Administrators who manage dozens or hundreds of machines cannot open Event Viewer on each device to identify recurring faults across the fleet.
ManageEngine EventLog Analyzer is a centralized log management platform for Windows environments, built for IT compliance auditing and forensic troubleshooting of event log data. The solution collects application event log data from every Windows endpoint into one console, so Windows Error Reporting activity across the entire infrastructure can be investigated from a single console.
Key capabilities for analyzing event ID 1001 windows error reporting entries include:
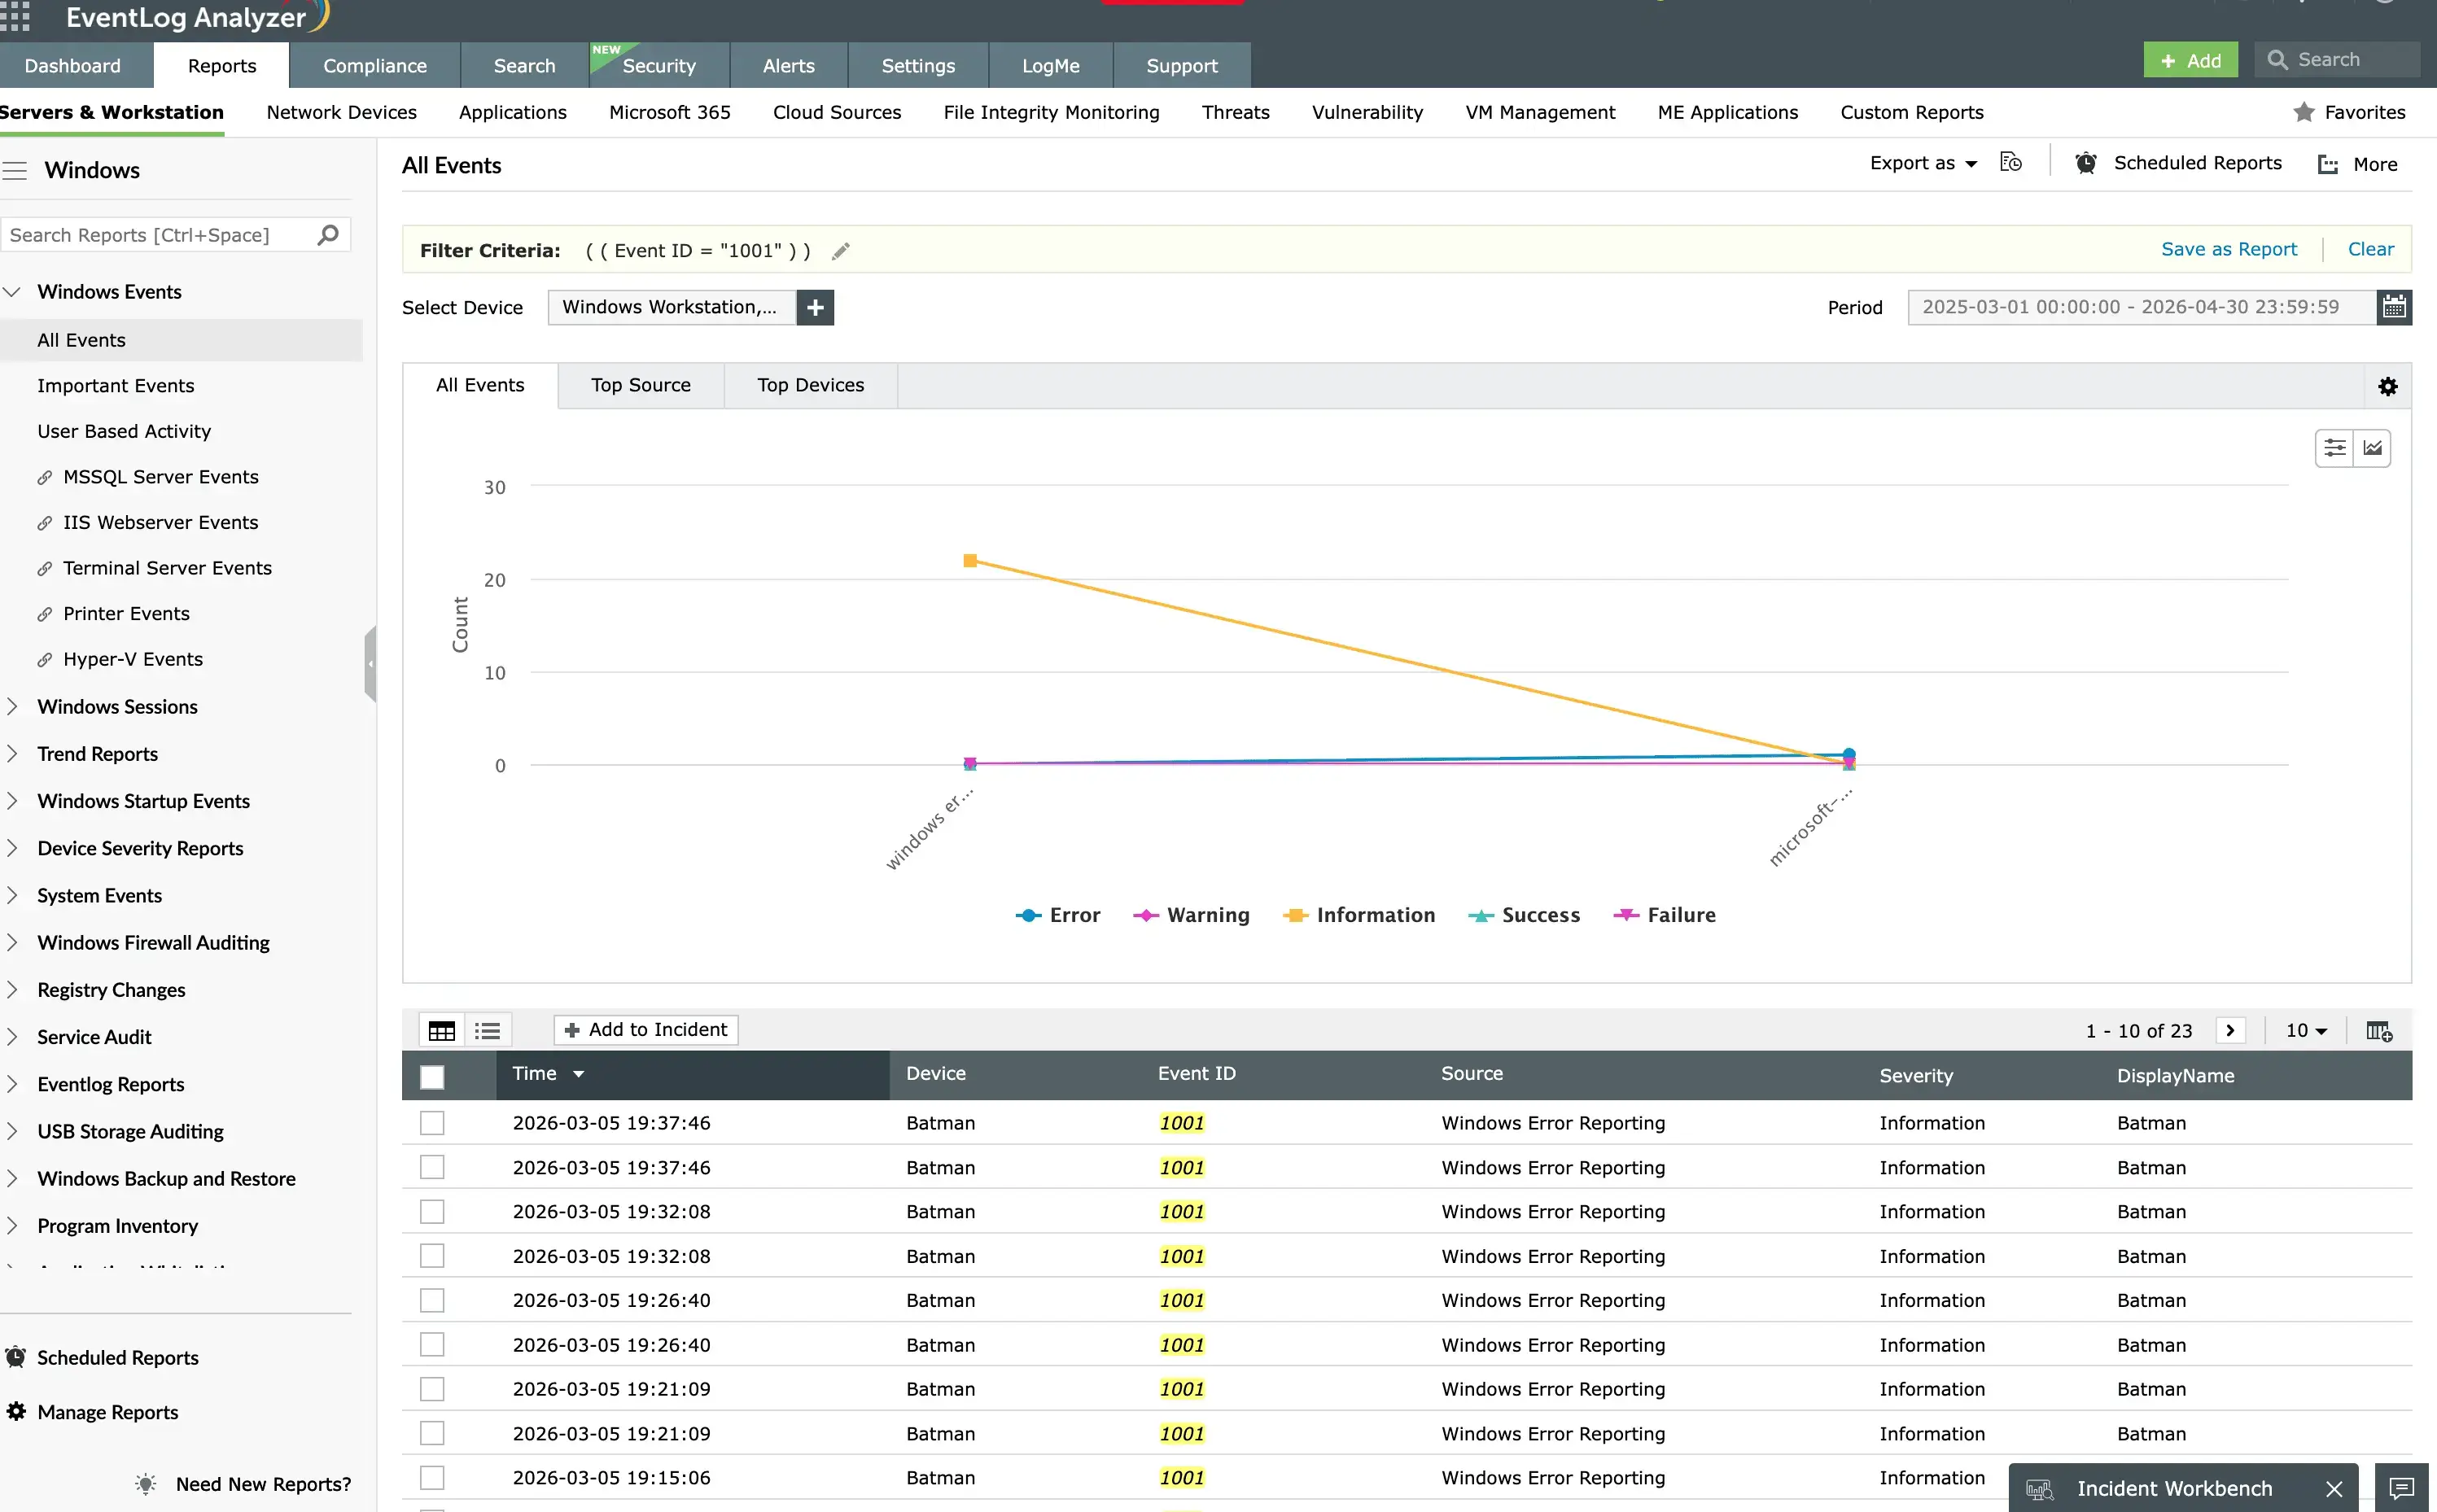
- Predefined WER reports that surface fault bucket type, problem signature parameters, and report status trends across the fleet. A driver failure on twenty machines appears as a single trend rather than twenty separate application event log entries. The reports break the crash data down by device, application, and time period, so recurring faults are visible without manual filtering.
- BSOD alert templates that trigger in real time on event ID 1001 BugCheck entries. Administrators receive notifications before end users report the issue. Alert templates can be scoped to specific machine groups, faulting modules, or fault bucket types to keep the alerts actionable.
- Correlated event log analysis that pairs the faulting module from an event ID 1000 entry with the matching event ID 1001 entry automatically. This replaces manual timestamp matching in Event Viewer.
- EvtFileDiscoveryHandler configuration for ingesting archived event log files from endpoints. Historical LiveKernelEvent and application crash data remains searchable after local logs are rotated out.
Each capability maps directly to the fields present in an event ID 1001 windows error reporting entry. Administrators receive the same field-level information available in the local Application event log, aggregated across all Windows machines in the environment, along with real-time alerting on BSOD events.
Frequently asked questions about Event ID 1001
Repeated Event ID 1001 entries mean Windows Error Reporting (WER) is silently capturing a recurring fault: the same application, driver, or hardware problem happening over and over. Each entry is one more instance of the underlying failure, so a climbing count should be taken as a prompt to identify and fix the faulting component (for example a GPU driver behind repeated LiveKernelEvent 141 entries), not the reporting itself.
A 1001 BugCheck entry is WER's record of a Blue Screen of Death (BSOD): the problem signature parameters carry the BugCheck (stop) code identifying the failure. To fix it, read the code and faulting module from the crash dump in %SystemRoot%\Minidump using WinDbg's !analyze -v command, then apply the matching remediation, usually a driver update or rollback, a system file integrity check with sfc /scannow and DISM, or hardware diagnostics on RAM and storage.
There is no single command, because the fix depends on the fault type. Read the fault bucket, faulting module, and exception code on the General tab; run a system file integrity check; run hardware diagnostics on memory, storage, and GPU temperature; analyze the crash dump to confirm the cause; and use a clean boot to isolate third-party software. The dump's BugCheck code plus the faulting module tell you whether you are fixing a driver, hardware, or an application.
Yes, you can disable the Windows Error Reporting service. You can do it via Services.msc (set Windows Error Reporting Service to Disabled), Group Policy (enable Disable Windows Error Reporting), or the registry (HKLM\SOFTWARE\Microsoft\Windows\Windows Error Reporting\Disabled = 1). But disabling it removes the crash telemetry and dumps you need to diagnose problems. A better option is to keep WER running with local dump collection enabled, which retains diagnostic data without sending reports to Microsoft.
Event ID 1000 (Application error logs) the crash itself and names the faulting module and exception code. Event ID 1001 (Windows Error Reporting) logs how WER packaged and handled that same crash a moment later. They usually appear as a timestamped pair; matching them confirms you are looking at one failure and points to the module that caused it.