
How to use SQL Server Trace and SQL Profiler for auditing
In this page
- What is SQL Trace?
- Key features and uses of SQL Trace
- Enable SQL Trace using SQL Server Profiler
- How to save SQL Trace data to a file in SQL Server
- How to enable SQL Trace for auditing
- Viewing SQL Trace files
- What is SQL Server Profiler?
- Why should you not rely on SQL Trace and SQL Server Profiler for auditing?
- The best alternative to audit your SQL Server
What is SQL Trace?
SQL Trace is a feature in SQL Server that can track and audit events occurring in your SQL instance. The events are recorded in a trace file, which is stored in the \MSSQL\LOG directory by default.
With SQL Trace, you can configure a variety of options to monitor events and control log detail levels with precision. This can be managed through SQL Server Management Studio or SQL Server Profiler, which provides a graphical interface for detailed control over the tracing process.
Key features and uses of SQL Trace:
- Performance tuning: SQL Trace enables you to fine-tune your database performance by analyzing the execution time and resource usage of SQL queries.
- Swift troubleshooting: Analyze error logs generated by SQL Trace to swiftly troubleshoot and resolve database issues and minimize SQL Server downtime.
- Understand performance impact: SQL Trace provides insights into how SQL statements affect your application and system performance, and it enables you to identify potential bottlenecks.
- Streamlined compliance: Use SQL Trace to maintain compliance with auditing requirements. Its detailed logging of database activities provides a clear, chronological record, simplifying compliance efforts.
To enable SQL Trace using SQL Server Profiler, follow these steps:
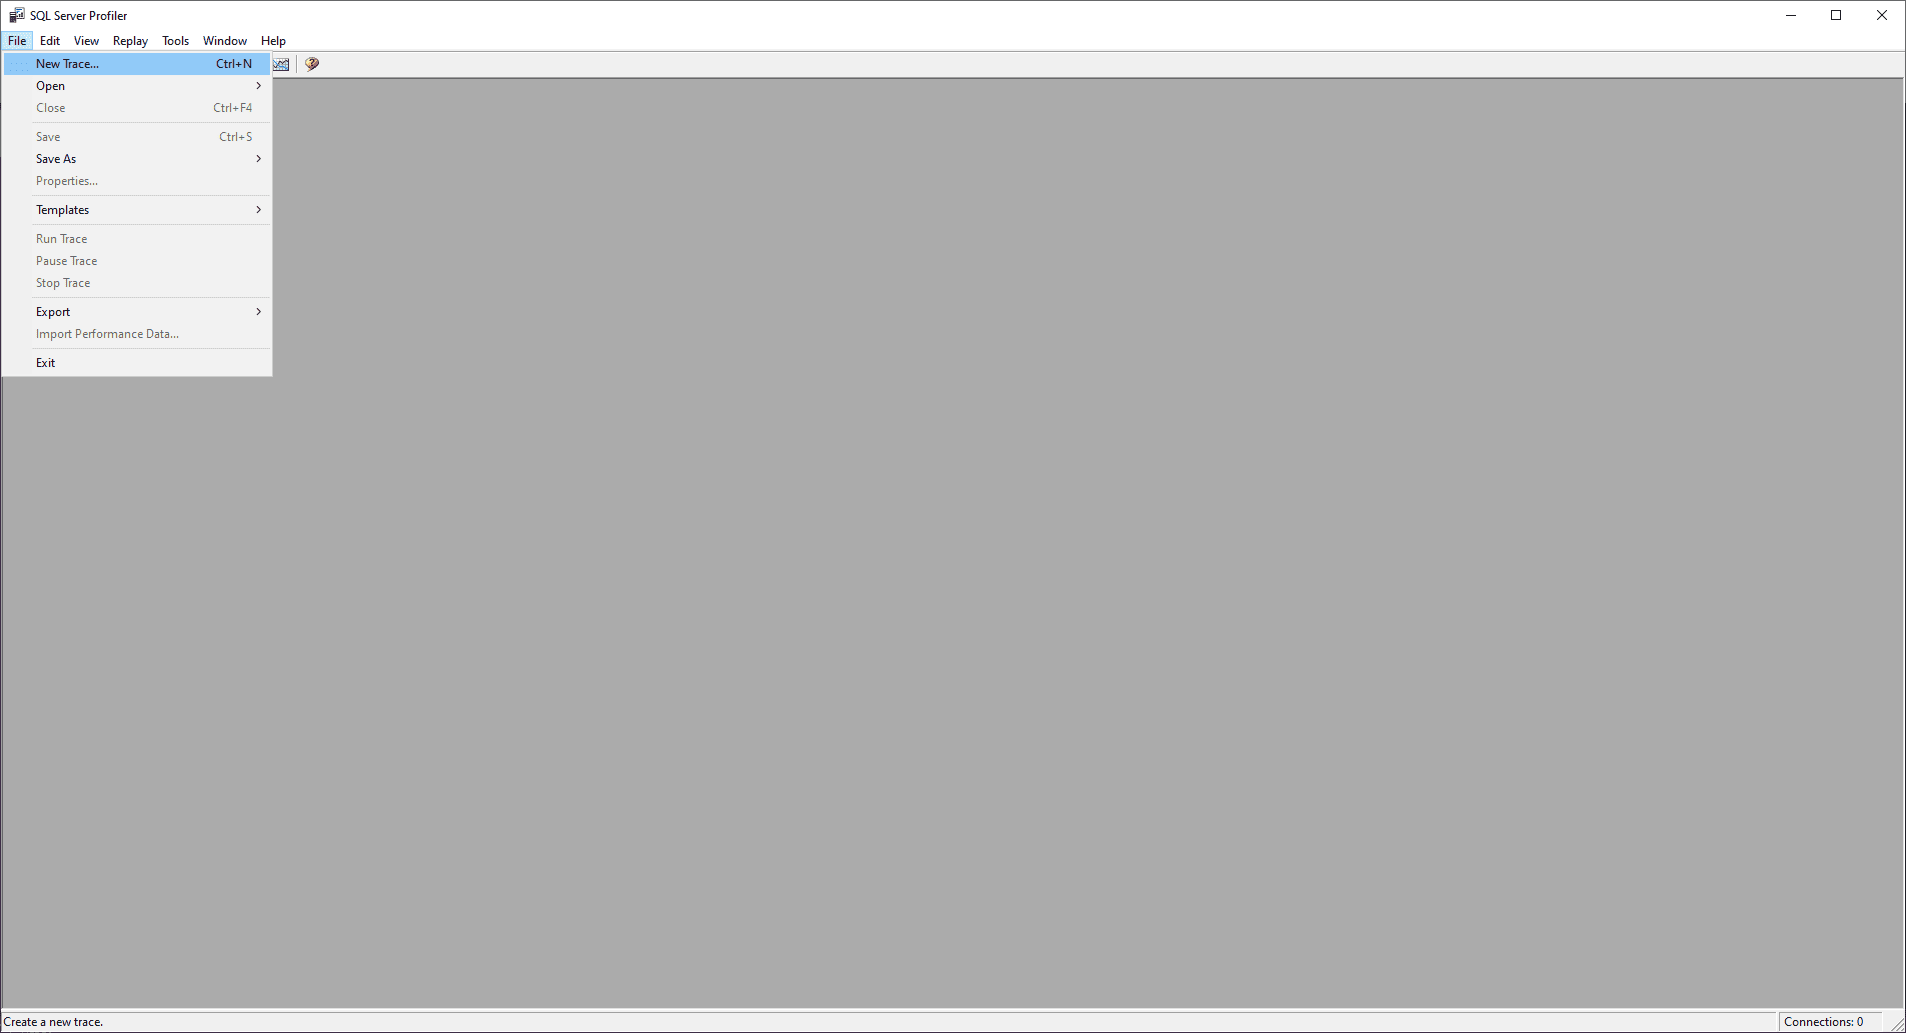
Step 1: Launch SQL Server Management Studio and select Tools > SQL Server Profiler. Click File, then select New Trace.
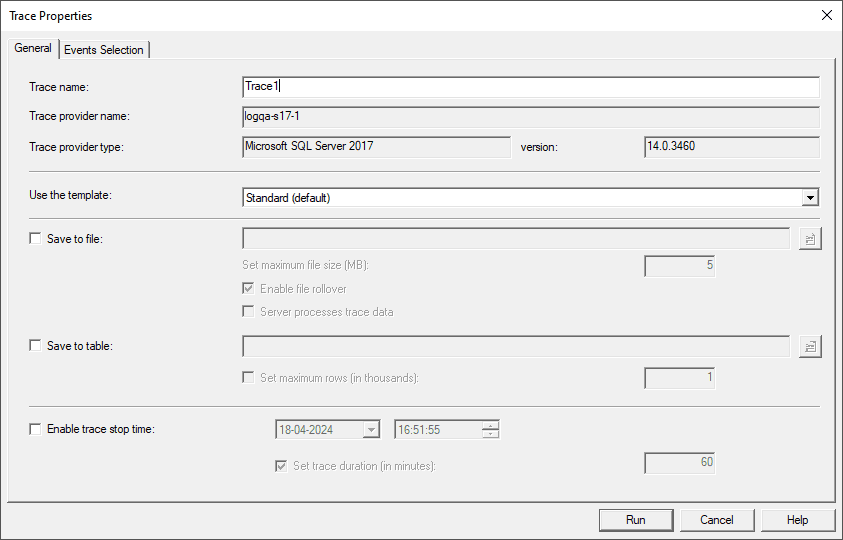
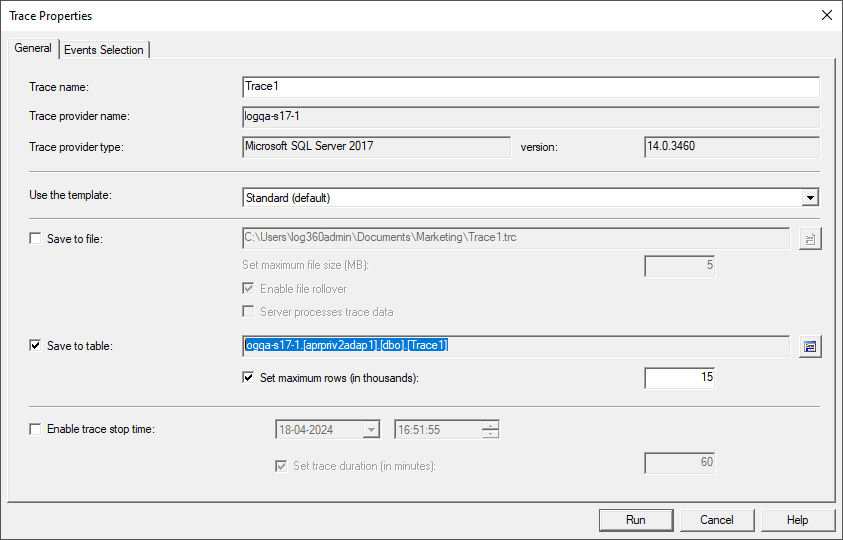
Step 2: In the Trace Properties window, provide a descriptive name for your trace in the Trace name field.This action will prompt you to connect to your SQL Server instance. Click Run.
Step 3: Choose where to save this trace data.
-
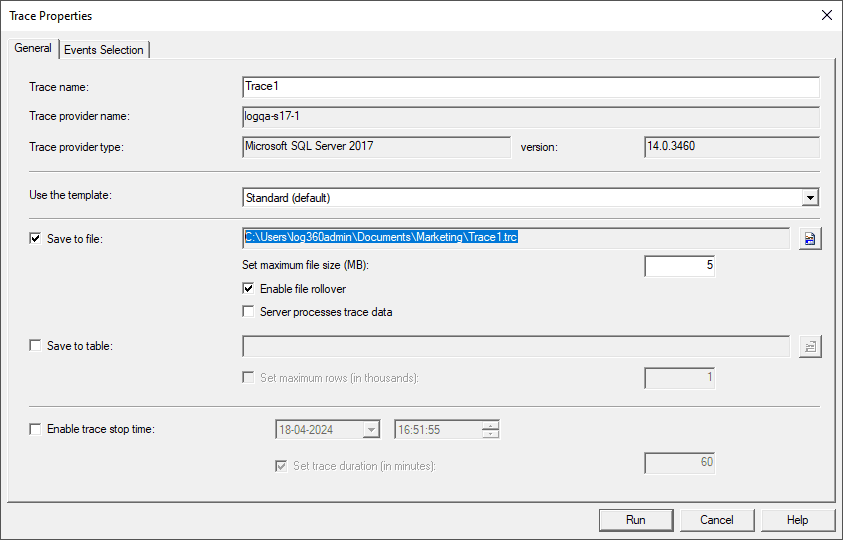
Save to file: To save the trace to a file, check the box next to Save to file, specify a file path, and set the maximum file size for the trace file. The default value is 5MB.
-
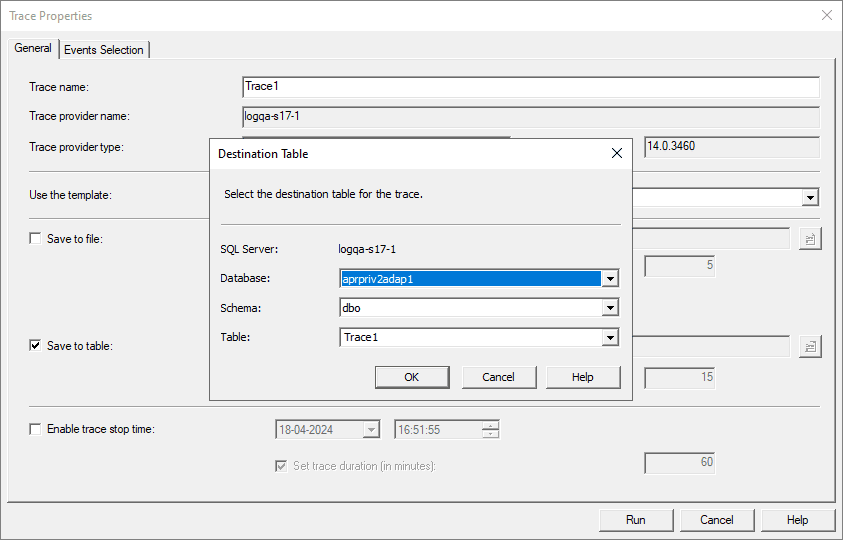
Save to table: To save the trace to a table, check the box next to Save to table and provide a table name where the trace data will be stored along with the maximum number of rows to limit the size.
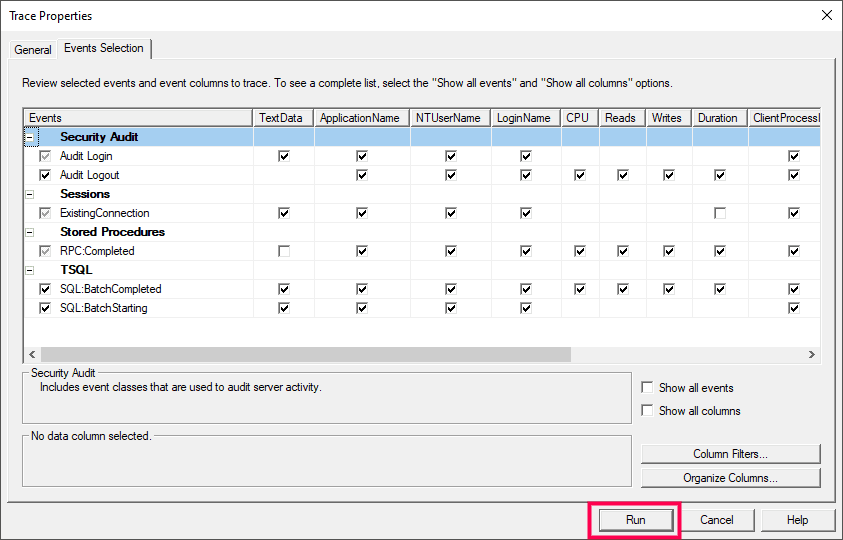
Step 4: Switch to the Events Selection tab. You can either select specific events to capture by checking the desired checkboxes or choose to show all events to capture all database activity. Optionally, you can define data columns to be included in the trace for a detailed analysis. Click Run to begin capturing database activity.
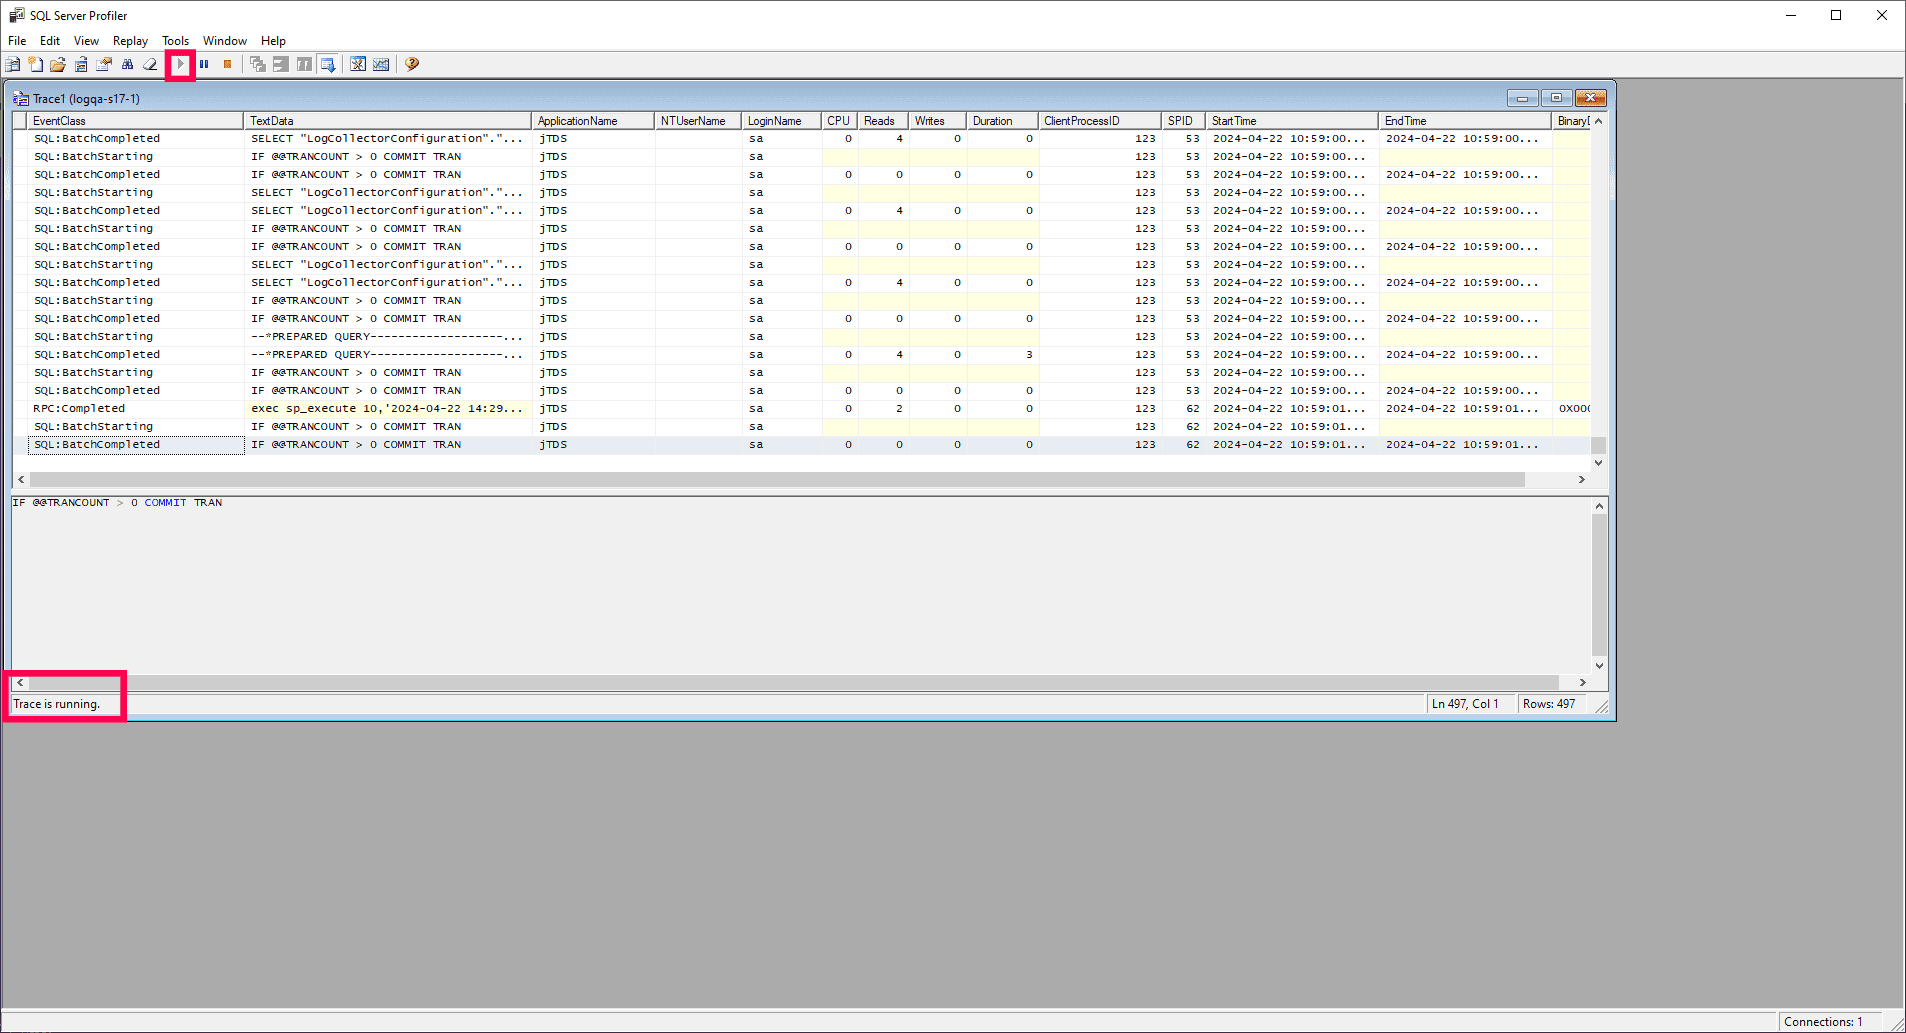
Step 5: Start tracing. Once you have configured the trace settings, initiate the trace by clicking Start or Run. The trace will then actively monitor and record events on the SQL server according to the specified settings.
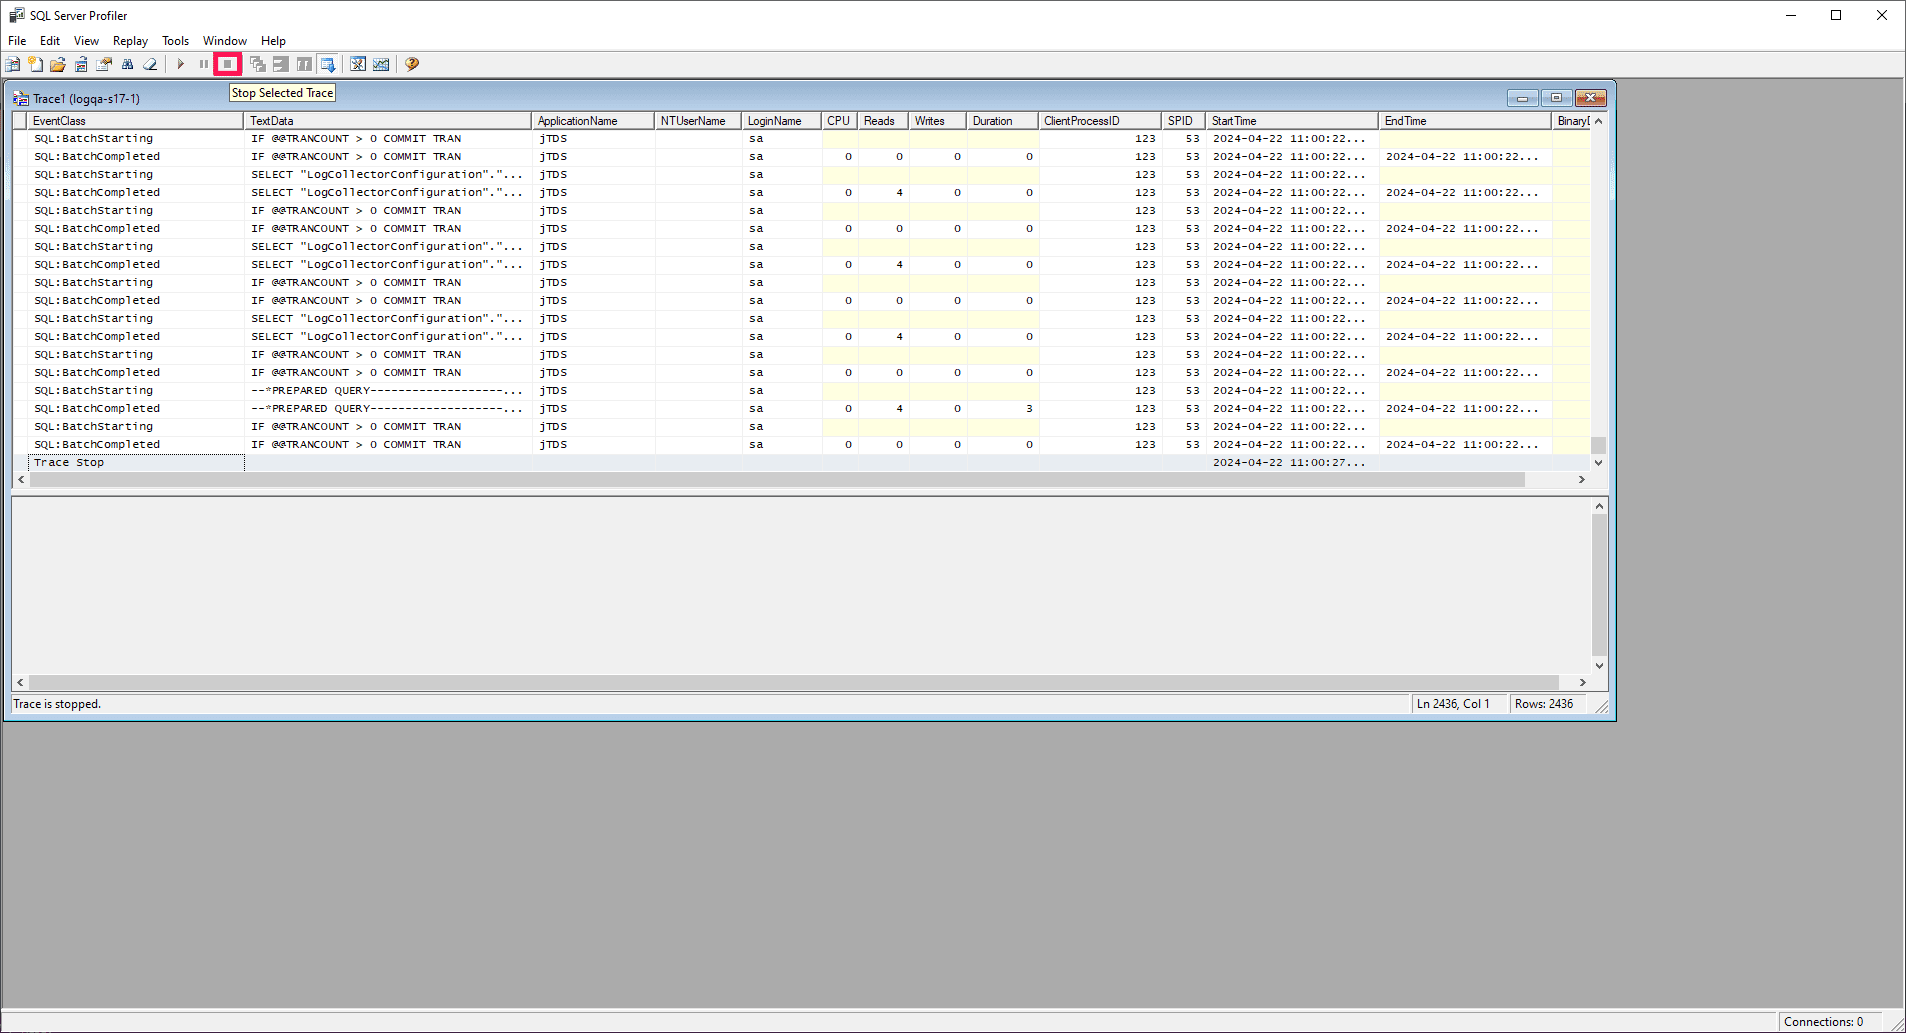
Step 6: Stop tracing. When you have finished collecting data, click the Stop Selected Trace button to halt the trace.
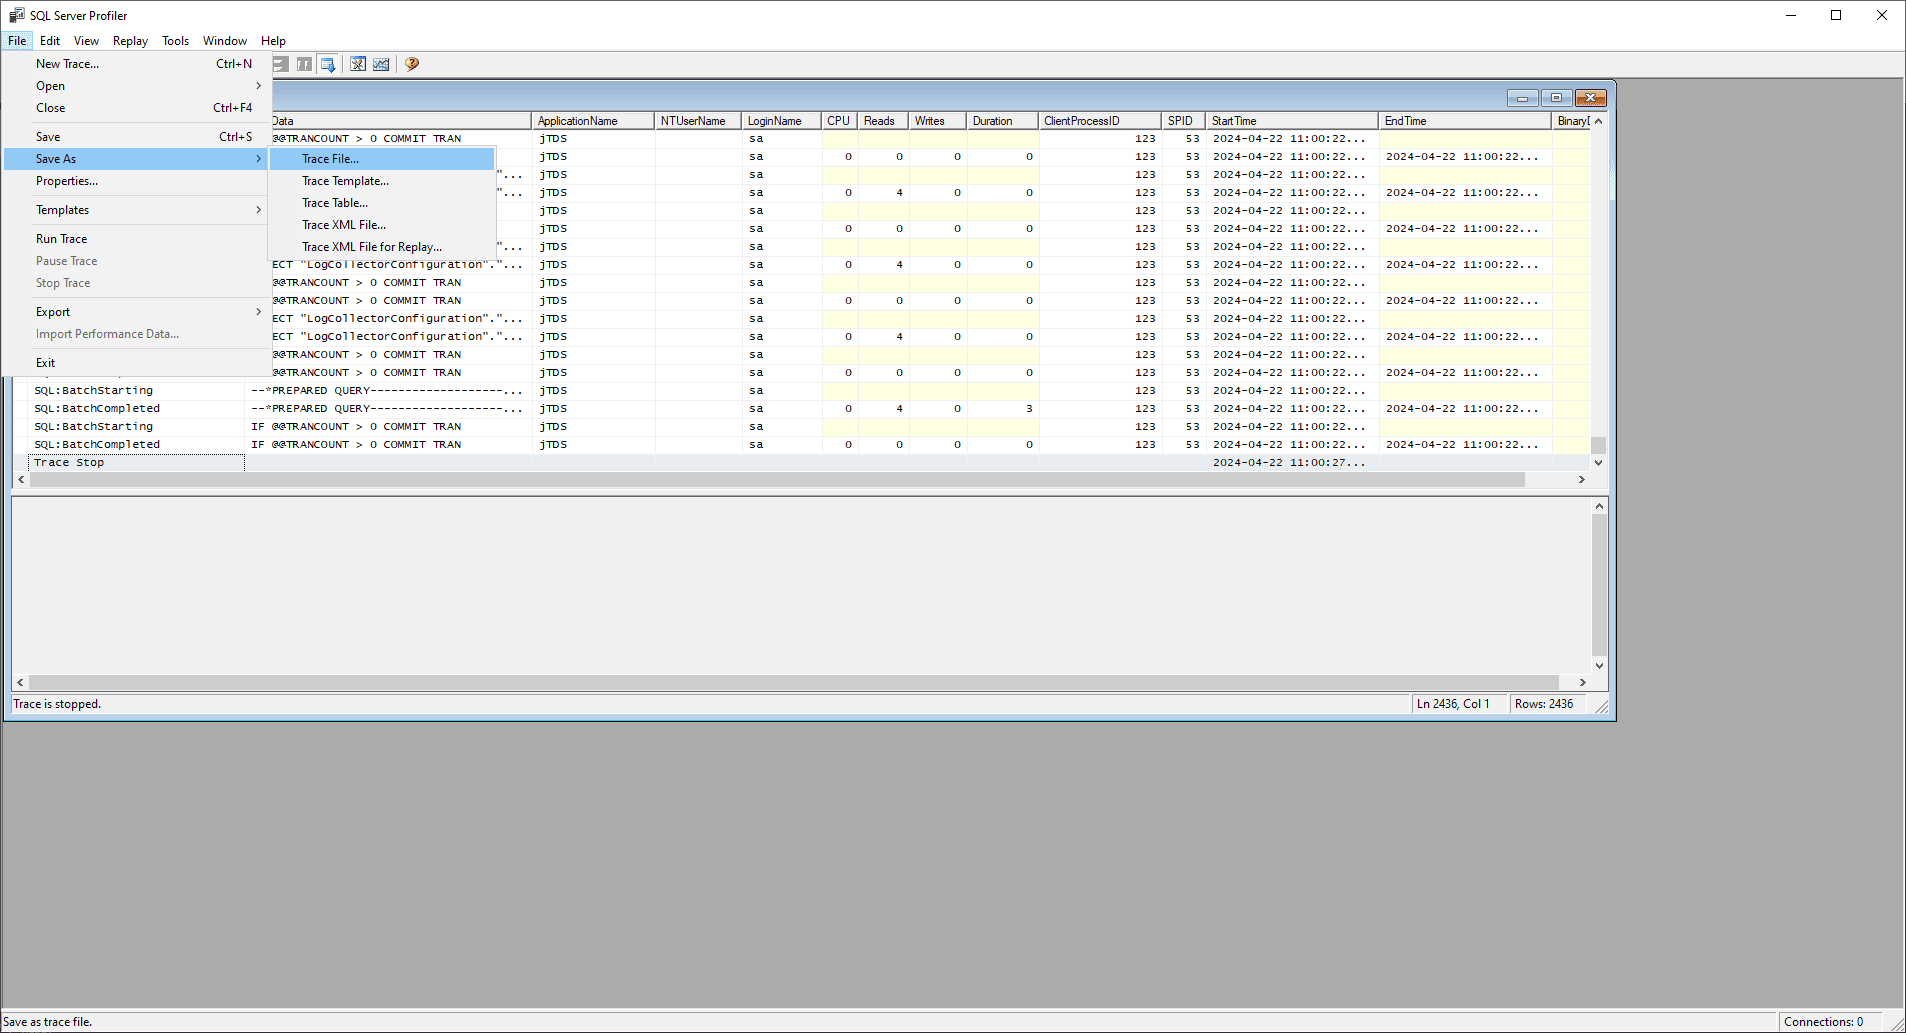
How do I save SQL Trace data to a file within SQL Server?
To save SQL Trace data to a file in SQL Server, click File, select Save As, and then choose Trace File to ensure the trace data is correctly captured and stored in your desired location. After saving, you can analyze the trace data using SQL Server Profiler or other analysis tools to gain valuable insights into SQL Server activity. This process allows you to efficiently monitor, diagnose, and optimize your database performance.
How to enable SQL Trace for auditing
While creating a trace, you can specify the events you want to record by making changes to the Trace Properties dialog box. Under the General tab of the dialog box, you can specify information such as the trace name, the storage location of the trace file, and the trace stop time.
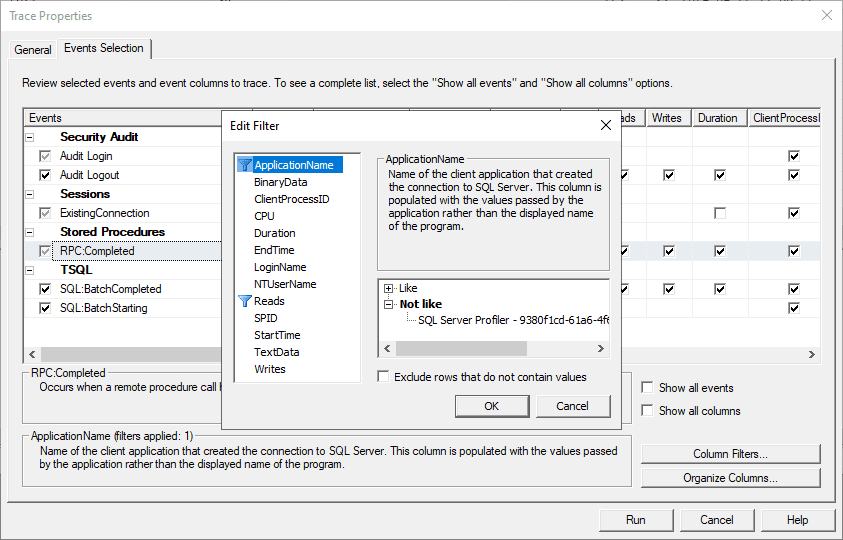
- In the Events Selection tab, you can select or unselect the events you want to capture in your trace.
- Under the same tab, create filters by clicking Column Filters.
- The Edit Filter dialog box will appear.
- You can enter the filter specifications using the provided comparison operators.
- Save the changes.
Now, the traces will be collected by incorporating the filters in the specified storage location.
Viewing trace files
Trace files can be read using the fn_trace_gettable function, which displays recorded events in a table format. The records can be aggregated and searched using SQL queries. Trace files are voluminous, and manually writing queries to extract fields of interest for generating an audit trail can be a tedious process.You can also use SQL Server Profiler to view trace files.
What is SQL Server Profiler?
SQL Server Profiler provides a graphical user interface to access your trace files by storing, retrieving, and auditing stored records. SQL Profiler's main functions are to monitor SQL Server activities, provide insights on the overall health, and identify elements that affect the performance of your SQL instance.
SQL Profiler provides visibility into your trace files by allowing you to save trace records, compare them with successive records to troubleshoot any operational issue (i.e., a slowly executing query), and fine-tune them to enhance performance.
What are some auditing challenges faced in SQL Trace and SQL Server Profiler?
SQL traces can generate a large amount of data, especially if the tracing level is set to a detailed mode or if it’s left running for extended periods. SQL tracing can significantly slow down database performance due to the extra CPU resources and memory required for logging, and it can also lead to increased disk I/O. Deciding when to start and stop tracing, configuring what should be traced, and analyzing the gathered data can be a tedious process. Security risks are also a concern, as trace files can contain sensitive information.
Moreover, you can store records only up to a specified data limit (i.e., 20MB) in a single trace file. Trace files can't be retained for long time frames as they are rolled over. There is also a constraint on the maximum number of trace files that can be retained (i.e., five files). Once the maximum is reached, the oldest trace file will be wiped from the memory. This isn't favorable for auditing since you are expected to retain records over prolonged time periods. SQL Server Profiler can be used only when traces are configured for different activities individually. Analyzing the trace files using SQL Server Profiler manually is a time-consuming process.
Effectively managing the scope and duration of SQL Trace is crucial to prevent excessive overhead that may impact server performance. It's essential to strike a balance between capturing sufficient data for analysis and minimizing resource usage.
Microsoft has deprecated SQL Trace and SQL Server Profiler along with the Microsoft.SqlServer.Management.Trace namespace and the SQL Server Trace and Replay objects. The Trace and Server Profiler features will possibly be removed in upcoming versions of SQL Server.
The best alternative to audit your SQL server
The data collected through SQL tracing can be complex and voluminous, making it challenging to analyze and interpret correctly. Misinterpretation of trace logs can lead to incorrect conclusions and misguided efforts in performance tuning or debugging. The storage overhead from large volumes of trace data can be substantial, adding complexity to data management.
SQL servers generate voluminous logs, and they should be monitored closely to ensure security and compliance. Instead of relying on SQL Trace and SQL Server Profiler for auditing, you can use a log management solution that can effectively collect, parse, and analyze logs from your SQL server.
EventLog Analyzer is a comprehensive log management solution that efficiently collects and analyzes SQL Server logs. It generates intuitive and detailed reports covering DDL and DML activities, server account management, and security attacks. Some of the audit reports provided by EventLog Analyzer include information on column modifications, deletions, security changes, permissions, last login times, login information, unauthorized copies of sensitive data, account lockouts, storage media exposure, SQL injections, and denial-of-service attacks. Additionally, you can configure alerts to detect unusual activities and receive real-time notifications via email and SMS to mitigate threats and prevent attacks. Explore other reports offered by EventLog Analyzer to enhance your log management capabilities.
