Modern application architectures have made traditional root cause analysis significantly more difficult, as a single user action can trigger a complex chain of events across dozens of fragmented microservices. Distributed tracing addresses this by mapping the entire request path, allowing teams to move beyond isolated logs and metrics to see the exact causality of a failure. By using OpManager Nexus, organizations can automate this process through threshold-based trace capturing, which provides precise latency attribution and deep exception context only when performance deviates from the norm. This integrated approach transforms troubleshooting from a manual guessing game into a data-driven process that identifies the specific service or database responsible for a bottleneck in real time.
When a system slows down or a transaction fails, businesses don't just want to know that it happened; they need to know exactly why it happened. However, as applications move to highly distributed microservices, the traditional approach to root cause analysis(RCA) has fundamentally broken down.
In a modern stack, a single user click might trigger a chain reaction across dozens of services, multiple databases, and various third-party APIs. Without a way to connect these dots, RCA becomes an exercise in guesswork. This is why distributed tracing has emerged not just as a feature, but as the backbone of effective root cause analysis in APM.
The complexity of root cause analysis in microservices
In a monolithic environment, root cause analysis was relatively straightforward. You checked the application logs, looked at the server metrics, and usually found the issue—a memory leak, a slow SQL query, or a logic error. In a microservices architecture, the root cause is often hidden across service boundaries.
The three main RCA hurdles
- Service interdependency: A failure in the checkout service might actually be caused by a timeout in the inventory service, which in turn was caused by a slow disk on a database node. The symptom and the cause live in completely different parts of the system.
- Context fragmentation: A spike in checkout response time may show in your metrics dashboard, but without tracing you cannot tell whether the delay is in the payment gateway, the inventory lookup, or the token validation step. You have data, but no thread connecting it.
- Log silos: Searching through logs for dozens of different services to find a single correlated transaction is very time consuming—especially when those services are written in different languages and log in different formats.
How distributed tracing powers modern RCA
While metrics show you that something is wrong and logs tell you what happened on a single service, tracing maps causality across the entire request path.
In an RCA workflow, distributed tracing provides three critical layers of evidence.
The execution path visualizes the exact sequence of events. You can see, for example, that a request spent 10ms in the API gateway, 500ms in the payment Service, and that 490ms of that time was waiting on a specific downstream database call—not the application code itself.
Latency attribution lets you prove where the time was spent. Instead of assuming whether the network or the application is slow, tracing provides a millisecond-by-millisecond breakdown attributed to each service and operation.
Exception context captures the stack trace at the precise span (the individual unit of work within a trace) where an error occurred—even if that service is five layers deep in the architecture. You don't need to reproduce the failure; the trace already captured it.
Note: In OpManager Nexus, a trace is only filtered when a transaction exceeds the configured threshold limit. Setting an appropriate threshold is therefore a prerequisite for reliable RCA data—see Best practices below.
Performing RCA with OpManager Nexus: a step-by-step guide
With OpManager Nexus, the transition from an alert to a root cause is a streamlined, data-driven process.
Step 1: Identify the trigger
RCA typically begins with an automated alert or a dip in the Apdex score. Apdex (Application Performance Index) is a standardized measure of user satisfaction based on response time thresholds—a score of 1.0 is perfect, while anything below 0.7 typically warrants investigation. OpManager Nexus' AI/ML-powered anomaly detection alerts you to performance regressions automatically, providing the starting point for your investigation.
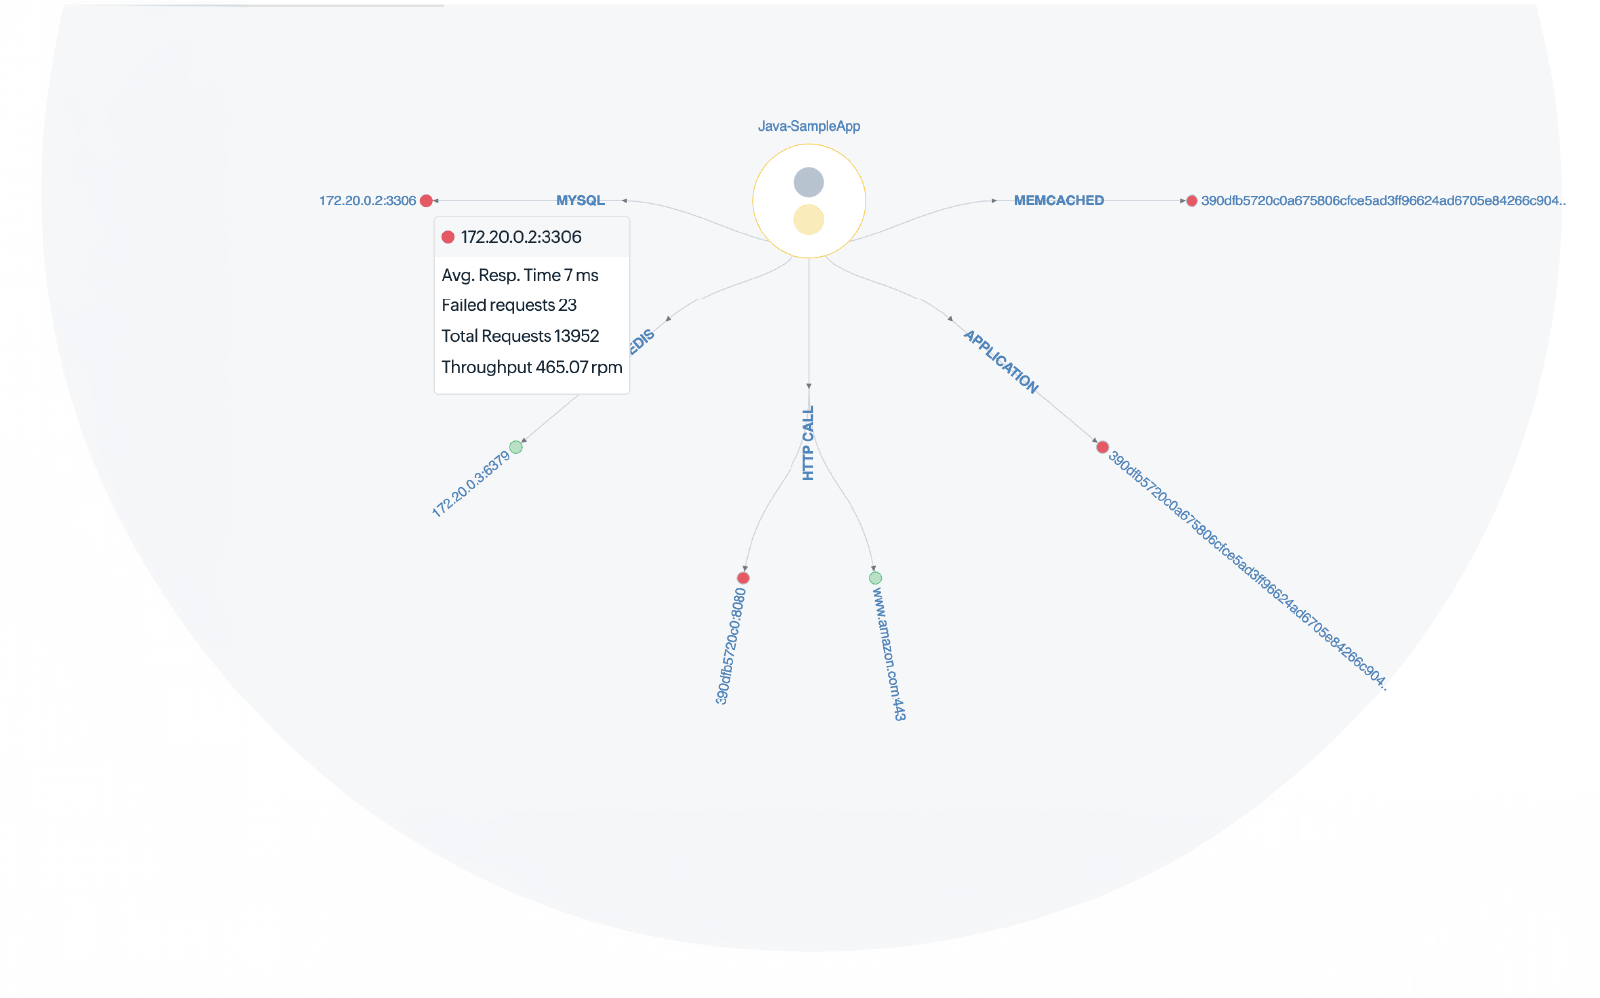
Step 2: Narrow down the scope with dependency maps
Before looking at individual code lines, navigate to the dependency map to identify which part of the system is degraded. The map visualizes all interconnected services, databases, and external resources, along with their real-time health. This tells you immediately whether a bottleneck is localized to one service or cascading through the system—helping you focus your investigation before drilling into traces.
Step 3: Drill into the Traces tab
Once you've identified the failing application, navigate to its Traces tab and click the Distributed tab to see all traces flowing across application boundaries. Select the relevant time window and look for traces with high response times or exception markers. You can filter traces by transaction type, slow traces, or exceptions to narrow your focus quickly.
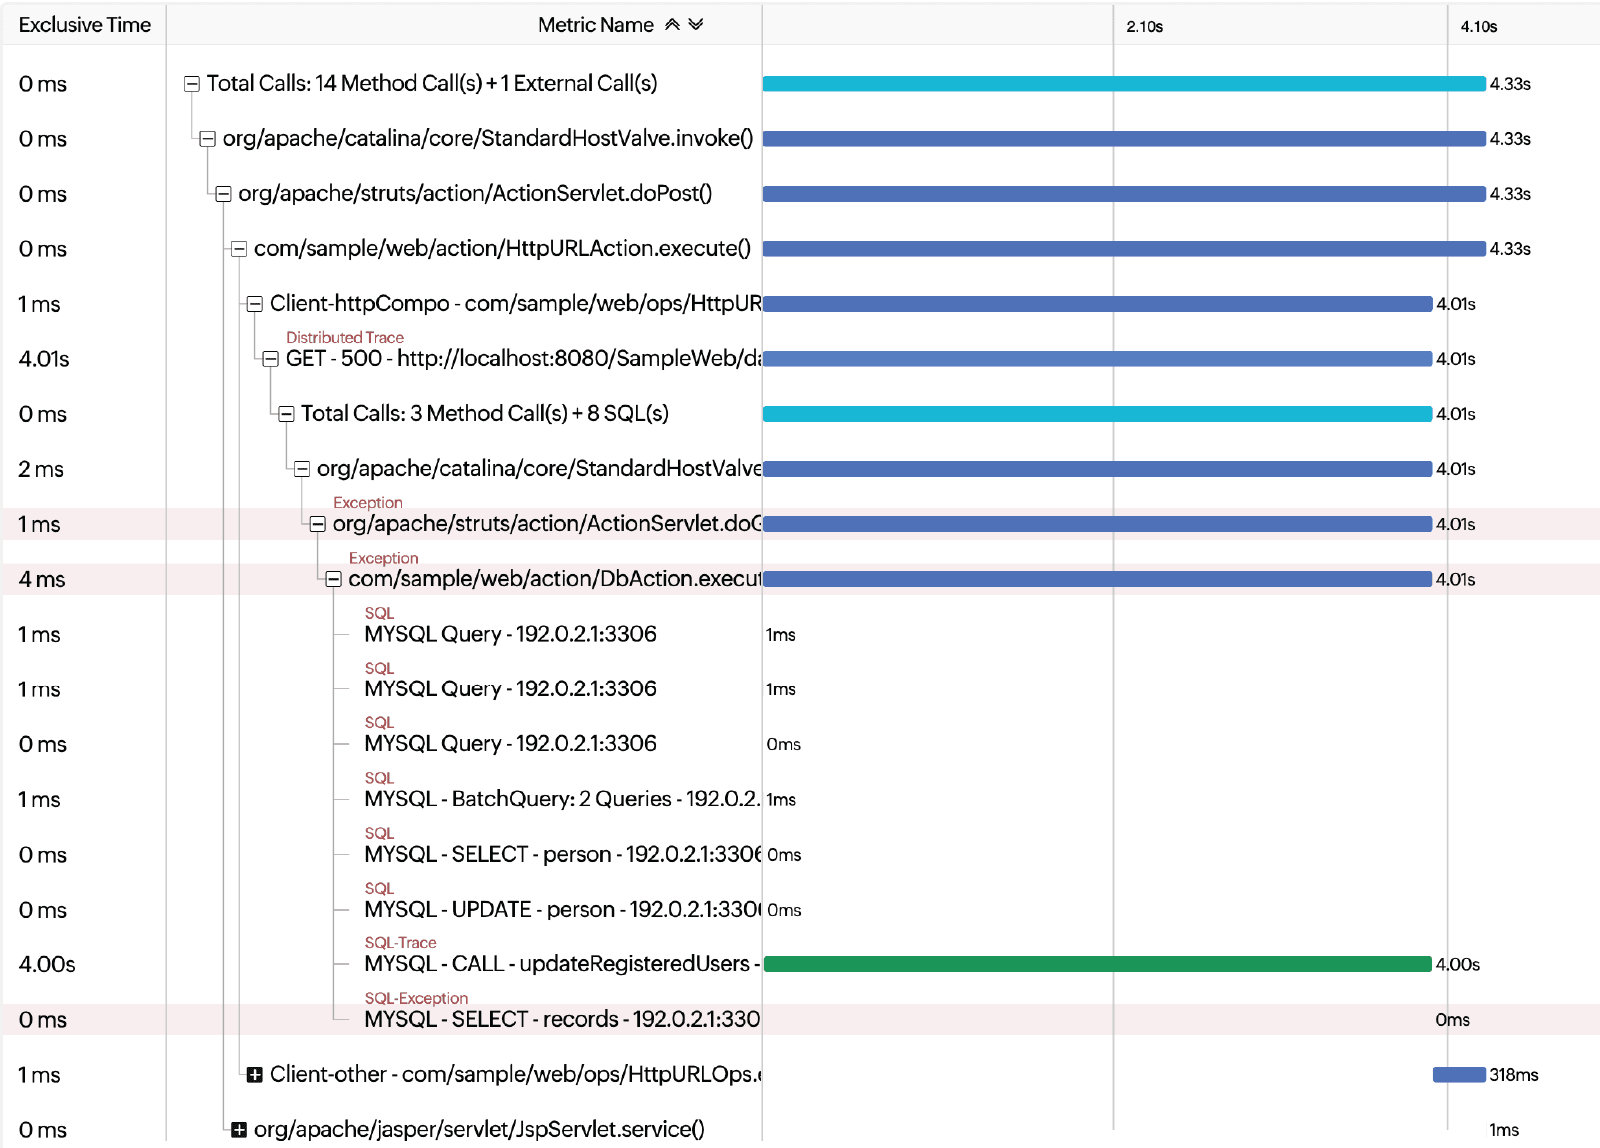
Step 4: Analyze the Trace Details tab
The Trace Details tab is your primary RCA tool. It shows a breakdown of every operation involved in the selected trace, including method calls and stack traces. Look for:
- Unusually long spans: These pinpoint the exact service or database query causing the delay. The top bar displays total response time and the partial response time contributed by each component, making it easy to see where time is being lost.
- Exception markers: These highlight exactly where an error was thrown and include the full stack trace.
- Asynchronous gaps: These reveal delays in message queues or background tasks that aren't visible in synchronous call chains.
Step 5: Correlate with AppLogs for the "why"
OpManager Nexus bridges tracing and logging through AppLogs, the platform's centralized log management service. AppLogs supports over 100 log types and ingests logs from across your infrastructure—servers, applications, cloud environments, and log frameworks—into a single searchable dashboard. From a specific trace, you can navigate to AppLogs and use its query-language search to filter logs by timestamp or transaction context. This reveals the final clue—such as an "Out of Memory" error, an "Access Denied" response from a third-party API, or a missing environment variable that only manifests in one out of several pods.
Reducing MTTR and eliminating blame culture
Mastering RCA through distributed tracing does more than fix bugs; it transforms how engineering teams operate.
- Reduced mean time to resolution (MTTR): Consider a common scenario—a checkout service is slow, but the root cause is a single database query in a downstream inventory service that started exceeding its connection pool after a schema change. Without tracing, this would involve hours of cross-team investigation. With the Traces pointing directly to the slow span and the logs confirming the connection pool error, the on-call engineer can identify and resolve the issue in minutes—often without escalating to a war room at all.
- Data-driven collaboration: Instead of the frontend team blaming the backend (and vice versa), teams share a single trace that proves exactly where the latency originates. The data is objective and team-neutral, which eliminates the friction that slows incident response.
- Precision scaling: Trace-driven RCA often reveals that you don't need more compute for the whole application—you need to optimize one specific query or scale one specific microservice. For instance, rather than increasing a cluster's CPU by 40% to mask a slow endpoint, tracing might show that a single unindexed query is consuming 70% of database resources. Fixing the index restores performance and eliminates the need for extra resources.
Best practices for trace-driven RCA
Standardize with OpenTelemetry.
OpManager Nexus supports OpenTelemetry, the open-source observability framework that provides vendor-neutral instrumentation for any language or framework in your stack. Using OpenTelemetry ensures your traces propagate correctly across service boundaries via standard context propagation headers, and it prevents vendor lock-in if your stack evolves.
Set dynamic threshold with Zia AI.
Since traces are filtered based on your configured limits, your threshold settings directly dictate the depth of RCA data available. Setting these manually can be tricky: too high, and you miss subtle "slow-but-not-failing" requests; too low, and you're buried in noise.
To solve this, OpManager Nexus leverages Zia-based dynamic thresholds. The system uses machine learning to analyze historical performance and automatically set anomaly detection boundaries. Instead of relying on static numbers, Zia adjusts to your application's unique patterns, ensuring you capture critical diagnostic information the moment performance deviates from the norm. A solid manual baseline is to align your starting threshold with your Apdex score—the point where user satisfaction begins to dip.
Instrument database and cache spans.
Often, the root cause isn't application code but a slow SQL query or a cache miss. OpManager Nexus automatically captures database calls and surfaces them as individual spans in the traces, along with the actual query text for slow database calls. Verify that your agents are configured to capture these spans so they appear in your trace breakdown.
Capture business metadata in traces.
Add custom tags like order_id, customer_tier, or region to your spans using the custom instrumentation capabilities or OpenTelemetry attributes. This lets you filter traces by business context—for example, to determine whether a performance issue is isolated to enterprise-tier customers or a specific geographic region—rather than looking at all traffic indiscriminately.
Investigate tail latency, not just averages.
Use the traces to filter for your slowest transactions (P99 latency) rather than relying on average response time metrics. P99 latency spikes often reveal subtle root causes—lock contention, garbage collection pauses, or retry storms—that averages hide entirely.
Mastering Microservices Observability With OpManager Nexus
Root cause analysis in distributed systems is no longer about looking at a single server's logs. It's about understanding a complex web of interactions across services, databases, and external dependencies—and doing so fast enough to matter. By making distributed tracing the center of your APM strategy with OpManager Nexus, you turn a chaotic troubleshooting into a precise, data-driven process.
Frequently asked questions
What is root cause analysis (RCA) in application performance monitoring?
Root cause analysis in APM is the process of identifying the underlying technical cause of a performance issue or outage—not just the symptom. In modern APM, effective RCA requires correlating data across traces, metrics, and logs to pinpoint the specific service, query, or code path responsible for a problem. The goal is to find the actual cause so it can be fixed permanently, not just to restore service temporarily.
How does distributed tracing help identify the root cause of performance issues?
Distributed tracing tracks the complete path of a request as it flows through every service in a distributed system, recording how long each operation takes and where errors occur. This gives you a causality map—not just a list of symptoms—so you can follow the chain from the user-facing slowdown back to the specific database query, external API call, or code method that caused it.
What is the difference between distributed tracing and traditional log analysis?
Traditional log analysis requires you to manually search and correlate logs from multiple services using timestamps and transaction IDs—a slow, error-prone process across many services. Distributed tracing automatically connects operations across service boundaries into a single, unified view, so you can see the full request path at a glance without manually cross-referencing dozens of log files.
How does OpManager Nexus perform root cause analysis in microservices?
You start with an anomaly alert or Apdex score drop, use the dependency map to locate the degraded service, inspect distributed traces to identify the slowest spans, and then correlate with AppLogs to find the specific log event that explains the failure.
What is an Apdex score and how does it relate to application performance monitoring?
Apdex (Application Performance Index) is an industry-standard metric that measures user satisfaction based on how many requests are responded to within a defined time threshold. Scores range from 0 to 1.0, where 1.0 means all users are satisfied. In OpManager Nexus, the Apdex score is tracked per application and per transaction, making it a reliable early-warning indicator that something has degraded—even before users start complaining.
How do I correlate traces and logs in OpManager Nexus?
OpManager Nexus integrates APM Insight with AppLogs, its centralized log management service. After identifying a suspect span in the Trace Details tab, navigate to AppLogs and use the query-language search to filter logs by the relevant time window and service. AppLogs supports over 100 log types and ingests logs from servers, applications, and cloud environments into a single dashboard, so you can find the specific log event that corresponds to the trace you're investigating.
What isOpenTelemetry and why should I use it for distributed tracing?
OpenTelemetry is an open-source observability framework that provides standardized APIs, SDKs, and tooling for generating and collecting traces, metrics, and logs from any application, regardless of language or framework. Using OpenTelemetry with OpManager Nexus ensures your tracing data is consistent across heterogeneous stacks—for example, a Java backend calling a Node.js microservice calling a Python ML model—and enables standard context propagation so traces cross service boundaries correctly.
How does distributed tracing in OpManager Nexus reduce mean time to resolution (MTTR)?
Distributed tracing reduces MTTR by eliminating the manual investigation phase. Instead of having teams search logs in parallel, engineers can open the Trace Details tab in OpManager Nexus, see the exact span where latency spiked or an error occurred, and jump directly to the relevant log context via AppLogs. What might previously have taken hours of cross-team debugging is reduced to a targeted, evidence-based investigation that typically takes minutes.
What are the best practices for setting up distributed tracing in a microservices environment?
Key best practices include: standardizing on OpenTelemetry for vendor-neutral, cross-language instrumentation; setting trace capture thresholds aligned to your Apdex tolerating threshold; ensuring database and cache calls are instrumented as individual spans; adding business metadata tags (such as order_id or region) to spans for context-aware filtering; and monitoring P99 latency rather than averages to catch tail-latency root causes that averages hide.