Why switch to ManageEngine?
Affordable pricing
Lower IT licensing costs by up to 70%.
Flexible deployment
Cloud and on-premise applications with annual and perpetual plans.
AI-powered monitoring
Proactive fault identification and resolution.
Full-stack observability
Gain end-to-end visibility across your IT stack
Unified management
Manage network configurations and compliance.
Combat tool sprawl
Reducing the cost and complexities of multiple IT tools.
Affordable and flexible:Compare ManageEngine's pricing plans with PRTG


ManageEngine vs PRTG,a head to head comparison
ManageEngine can enhance your IT team's visibility, response, and monitoring accuracy while eliminating the time and effort spent on repetitive tasks. Gain visibility into the network infrastructure as a whole and drill down into detailed metrics for each device and interface. You can also extend this across the IT stack to monitor and manage the entire IT stack, from the network end, to the applications and the cloud.
| Functionality | ManageEngine | PRTG |
|---|---|---|
| Discovery automation | Advanced | Basic |
| Performance monitoring | AI-powered | Manual |
| Workflow automation | Available | Not available |
| Performance forecasting | AI-powered | Not available |
| Configuration management | Available | Not available |
| Application monitoring | Available | Not available |
| Multi-cloud monitoring | Available | Not available |
| Websites & web-transactions | Available | Not available |
What sets ManageEngine apart from tools like PRTG?
- AI-powered monitoring
- Network automation
- Mapping and visualization
Eliminate uncertainty from your monitoring with AI
ManageEngine's monitoring solutions incorporate a powerful ML engine that ingests and refines monitored data to train itself constantly. You can leverage this data to predict network activity, reduce alarm noise, and eliminate false positives.
Adaptive thresholds
Set alarm thresholds automatically with AI-powered analytics. ManageEngine calculates and adjusts three levels of alarm thresholds based on collected historical data. Any abnormalities that might affect your IT systems can be instantly flagged.
Network performance forecasting
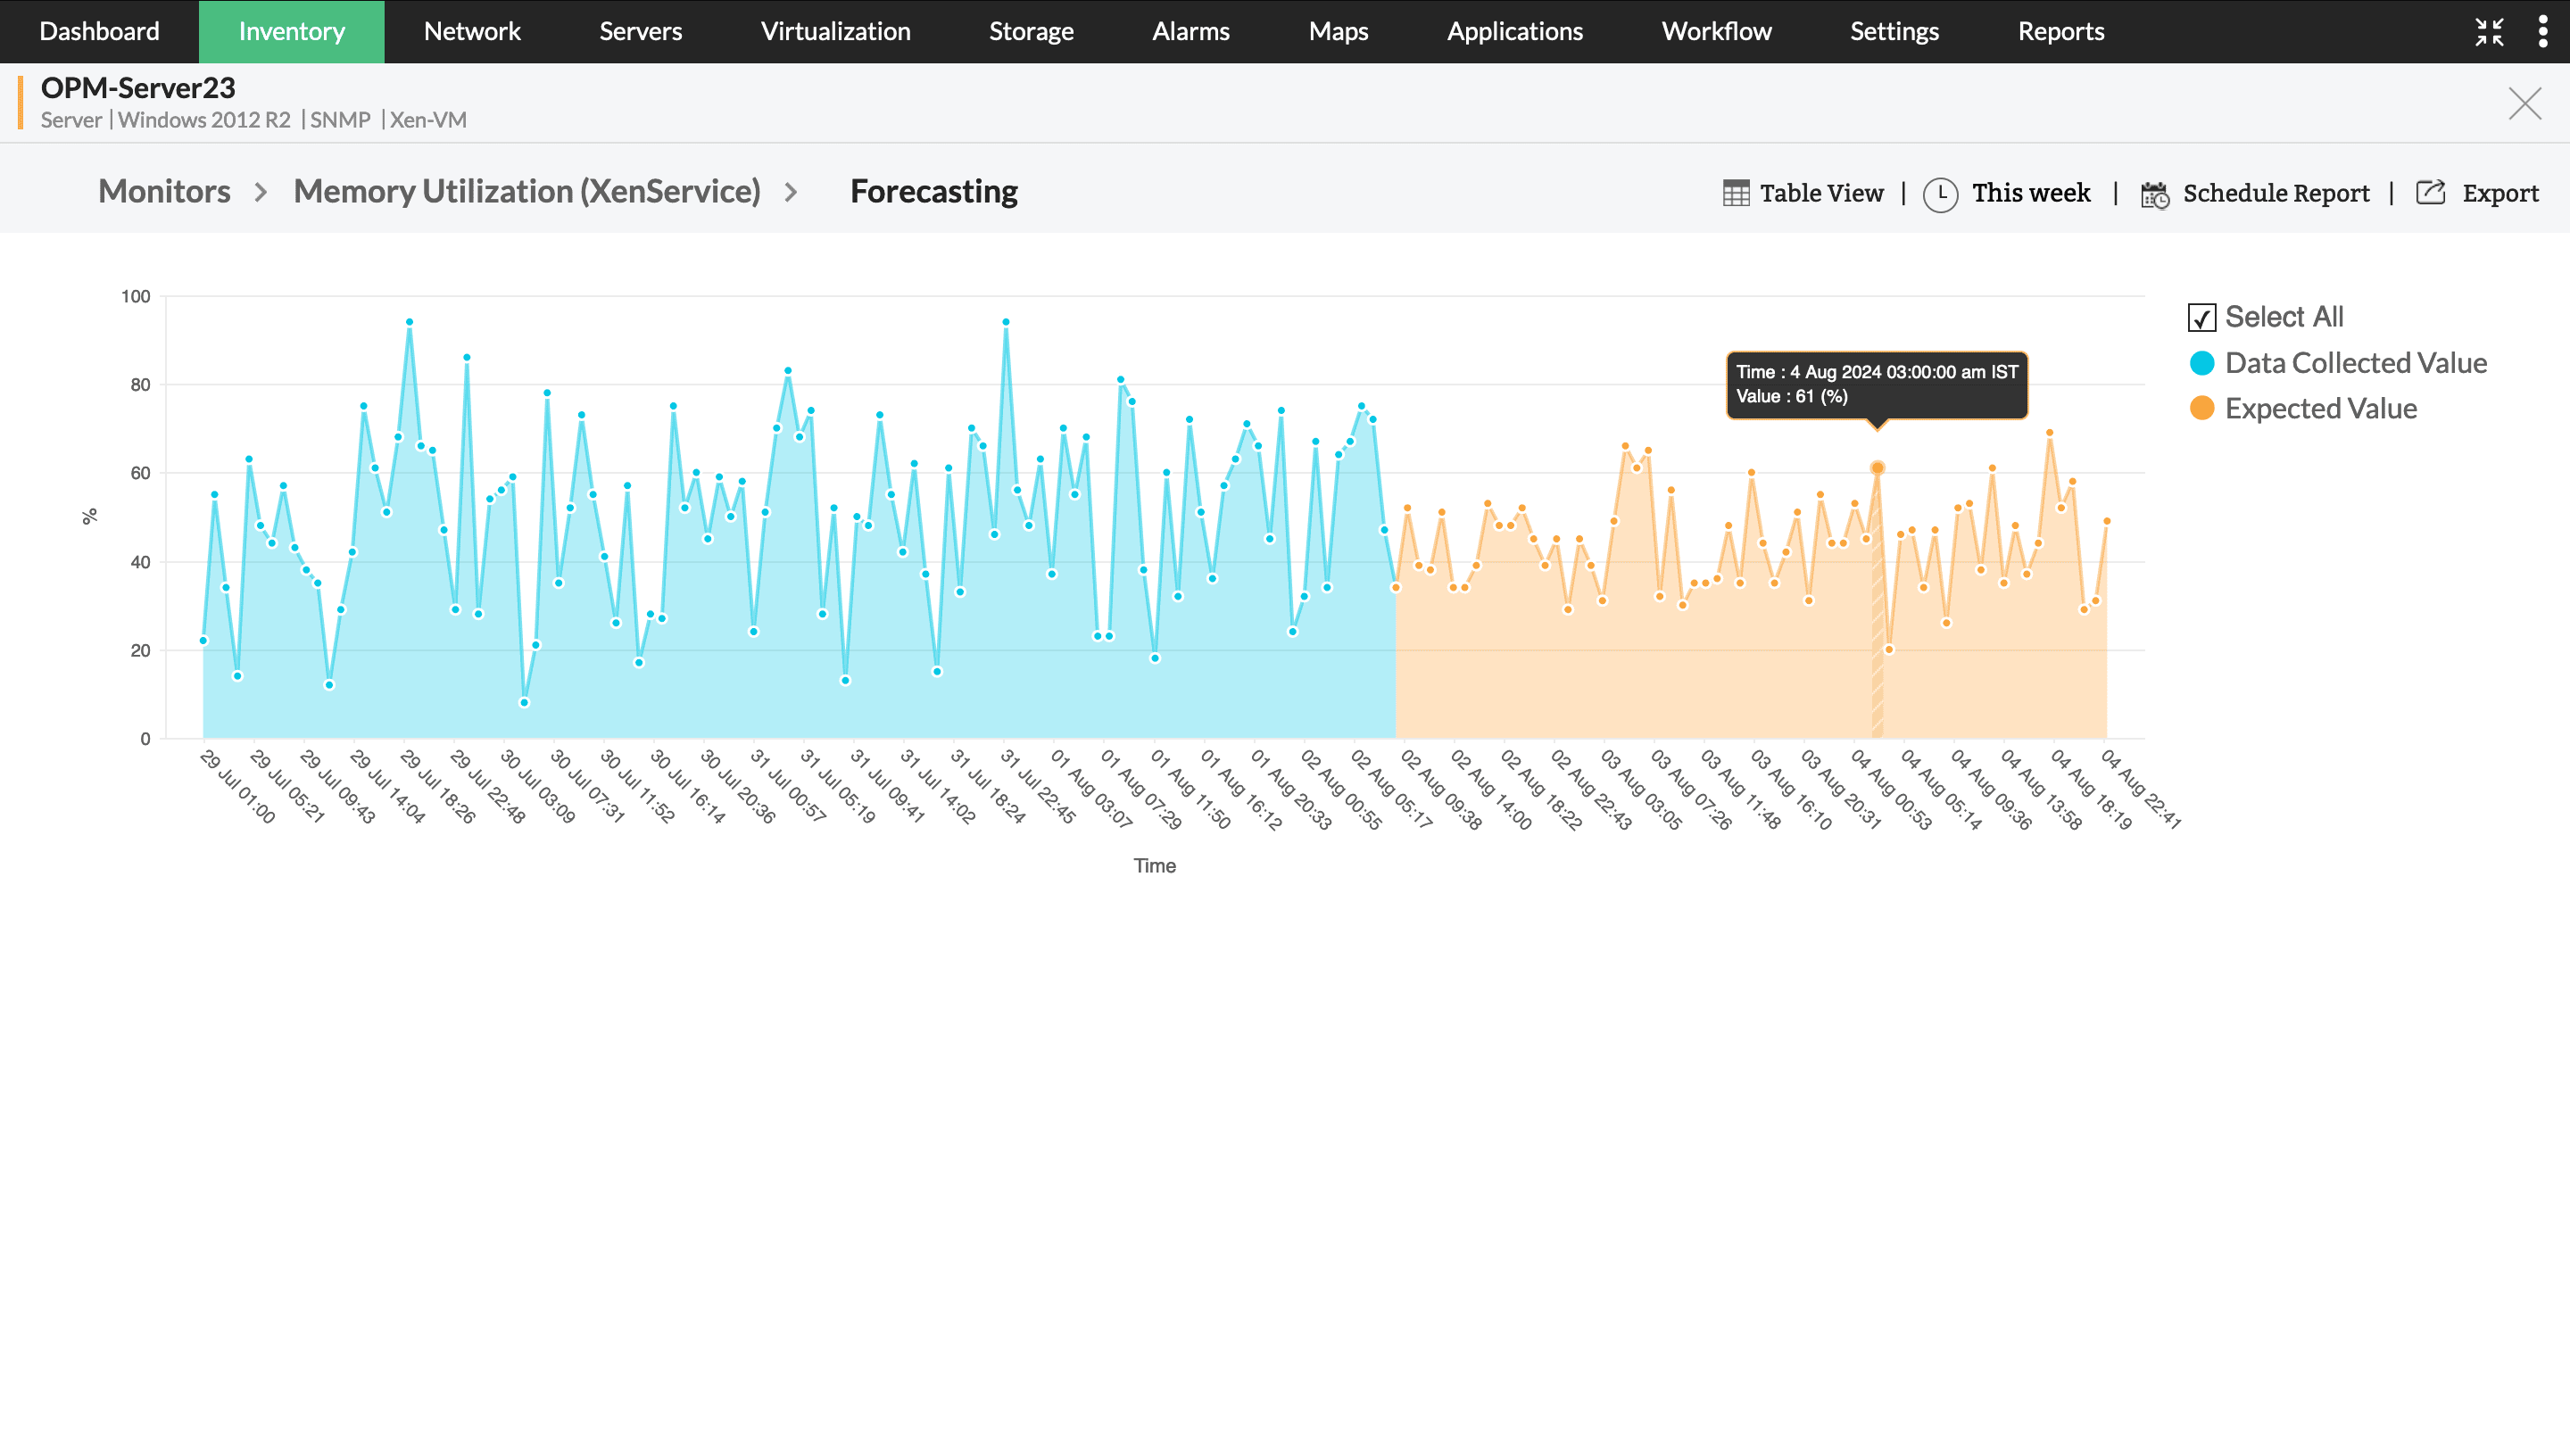
Forecast monitored performance metrics hours, days, and weeks ahead in time. ManageEngine ingests historic performance data like CPU utilization, incoming traffic, or memory usage, and plots expected values in a graphical format.
Forecast reports
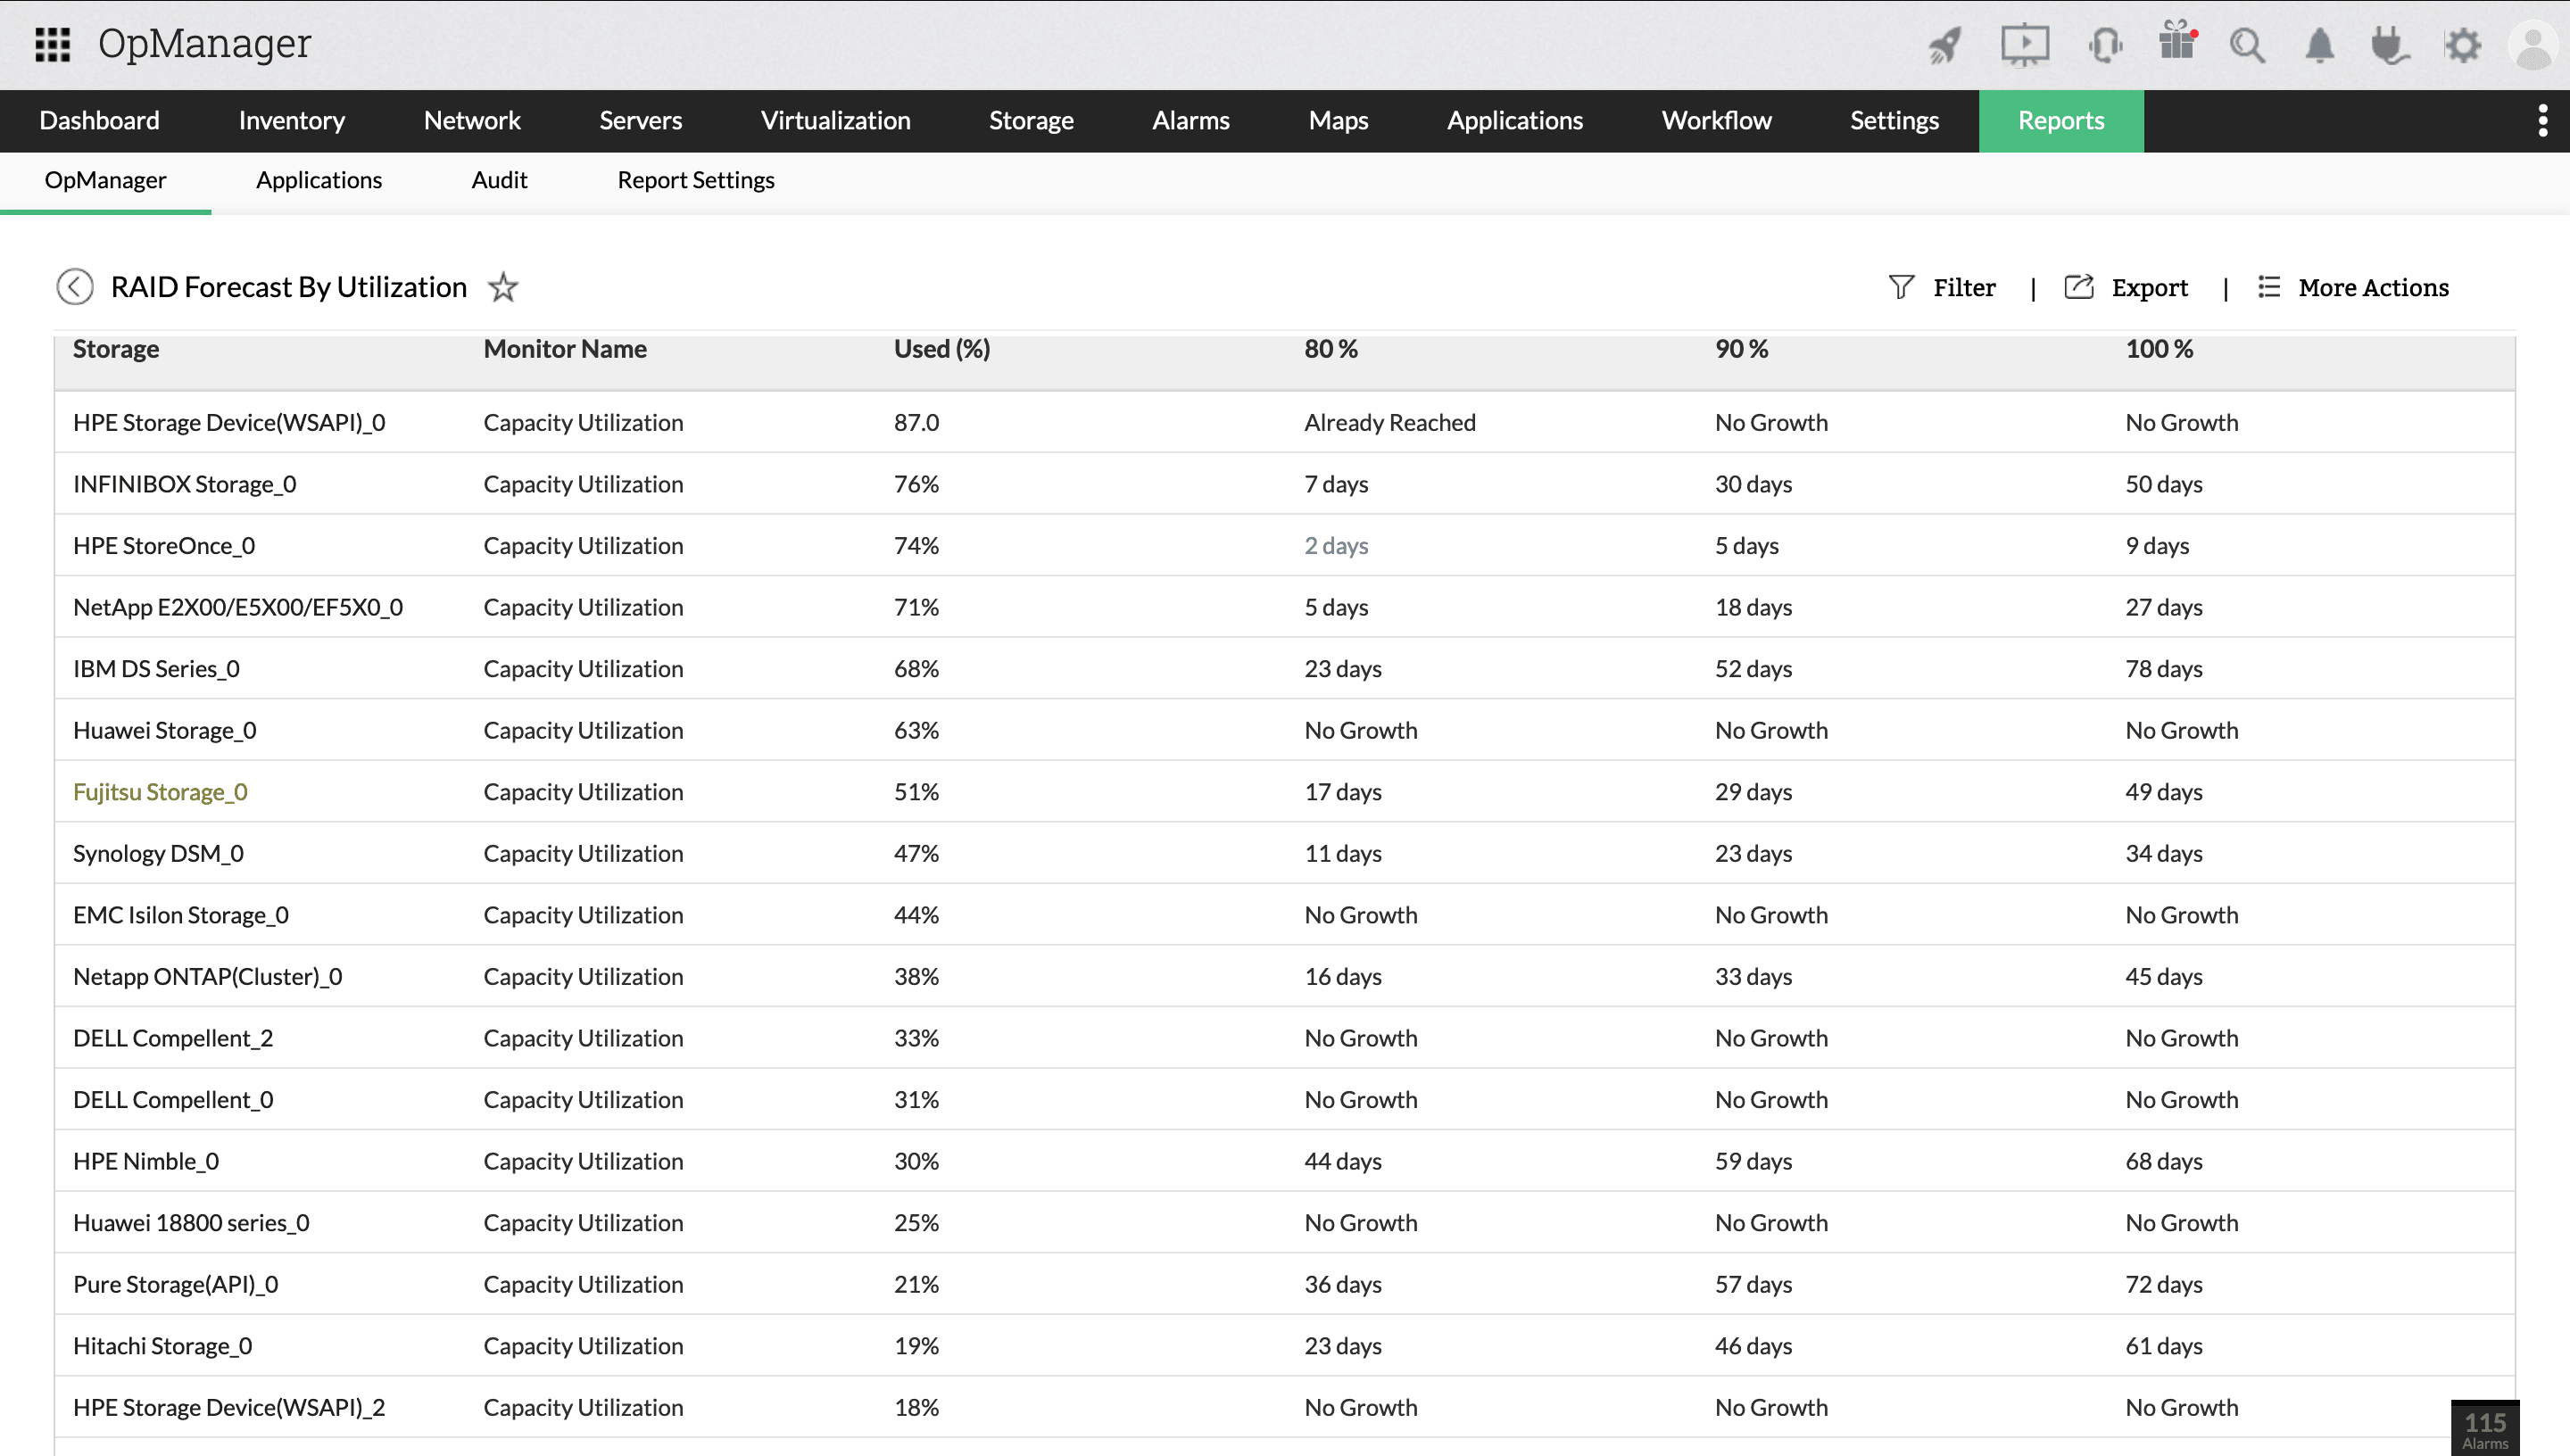
Perform capacity planning proactively by predicting when your IT resources run out. Forecast reports analyze current resource utilization trends and lists the number of days left till they get used up.
Speed up incident response with automated workflows
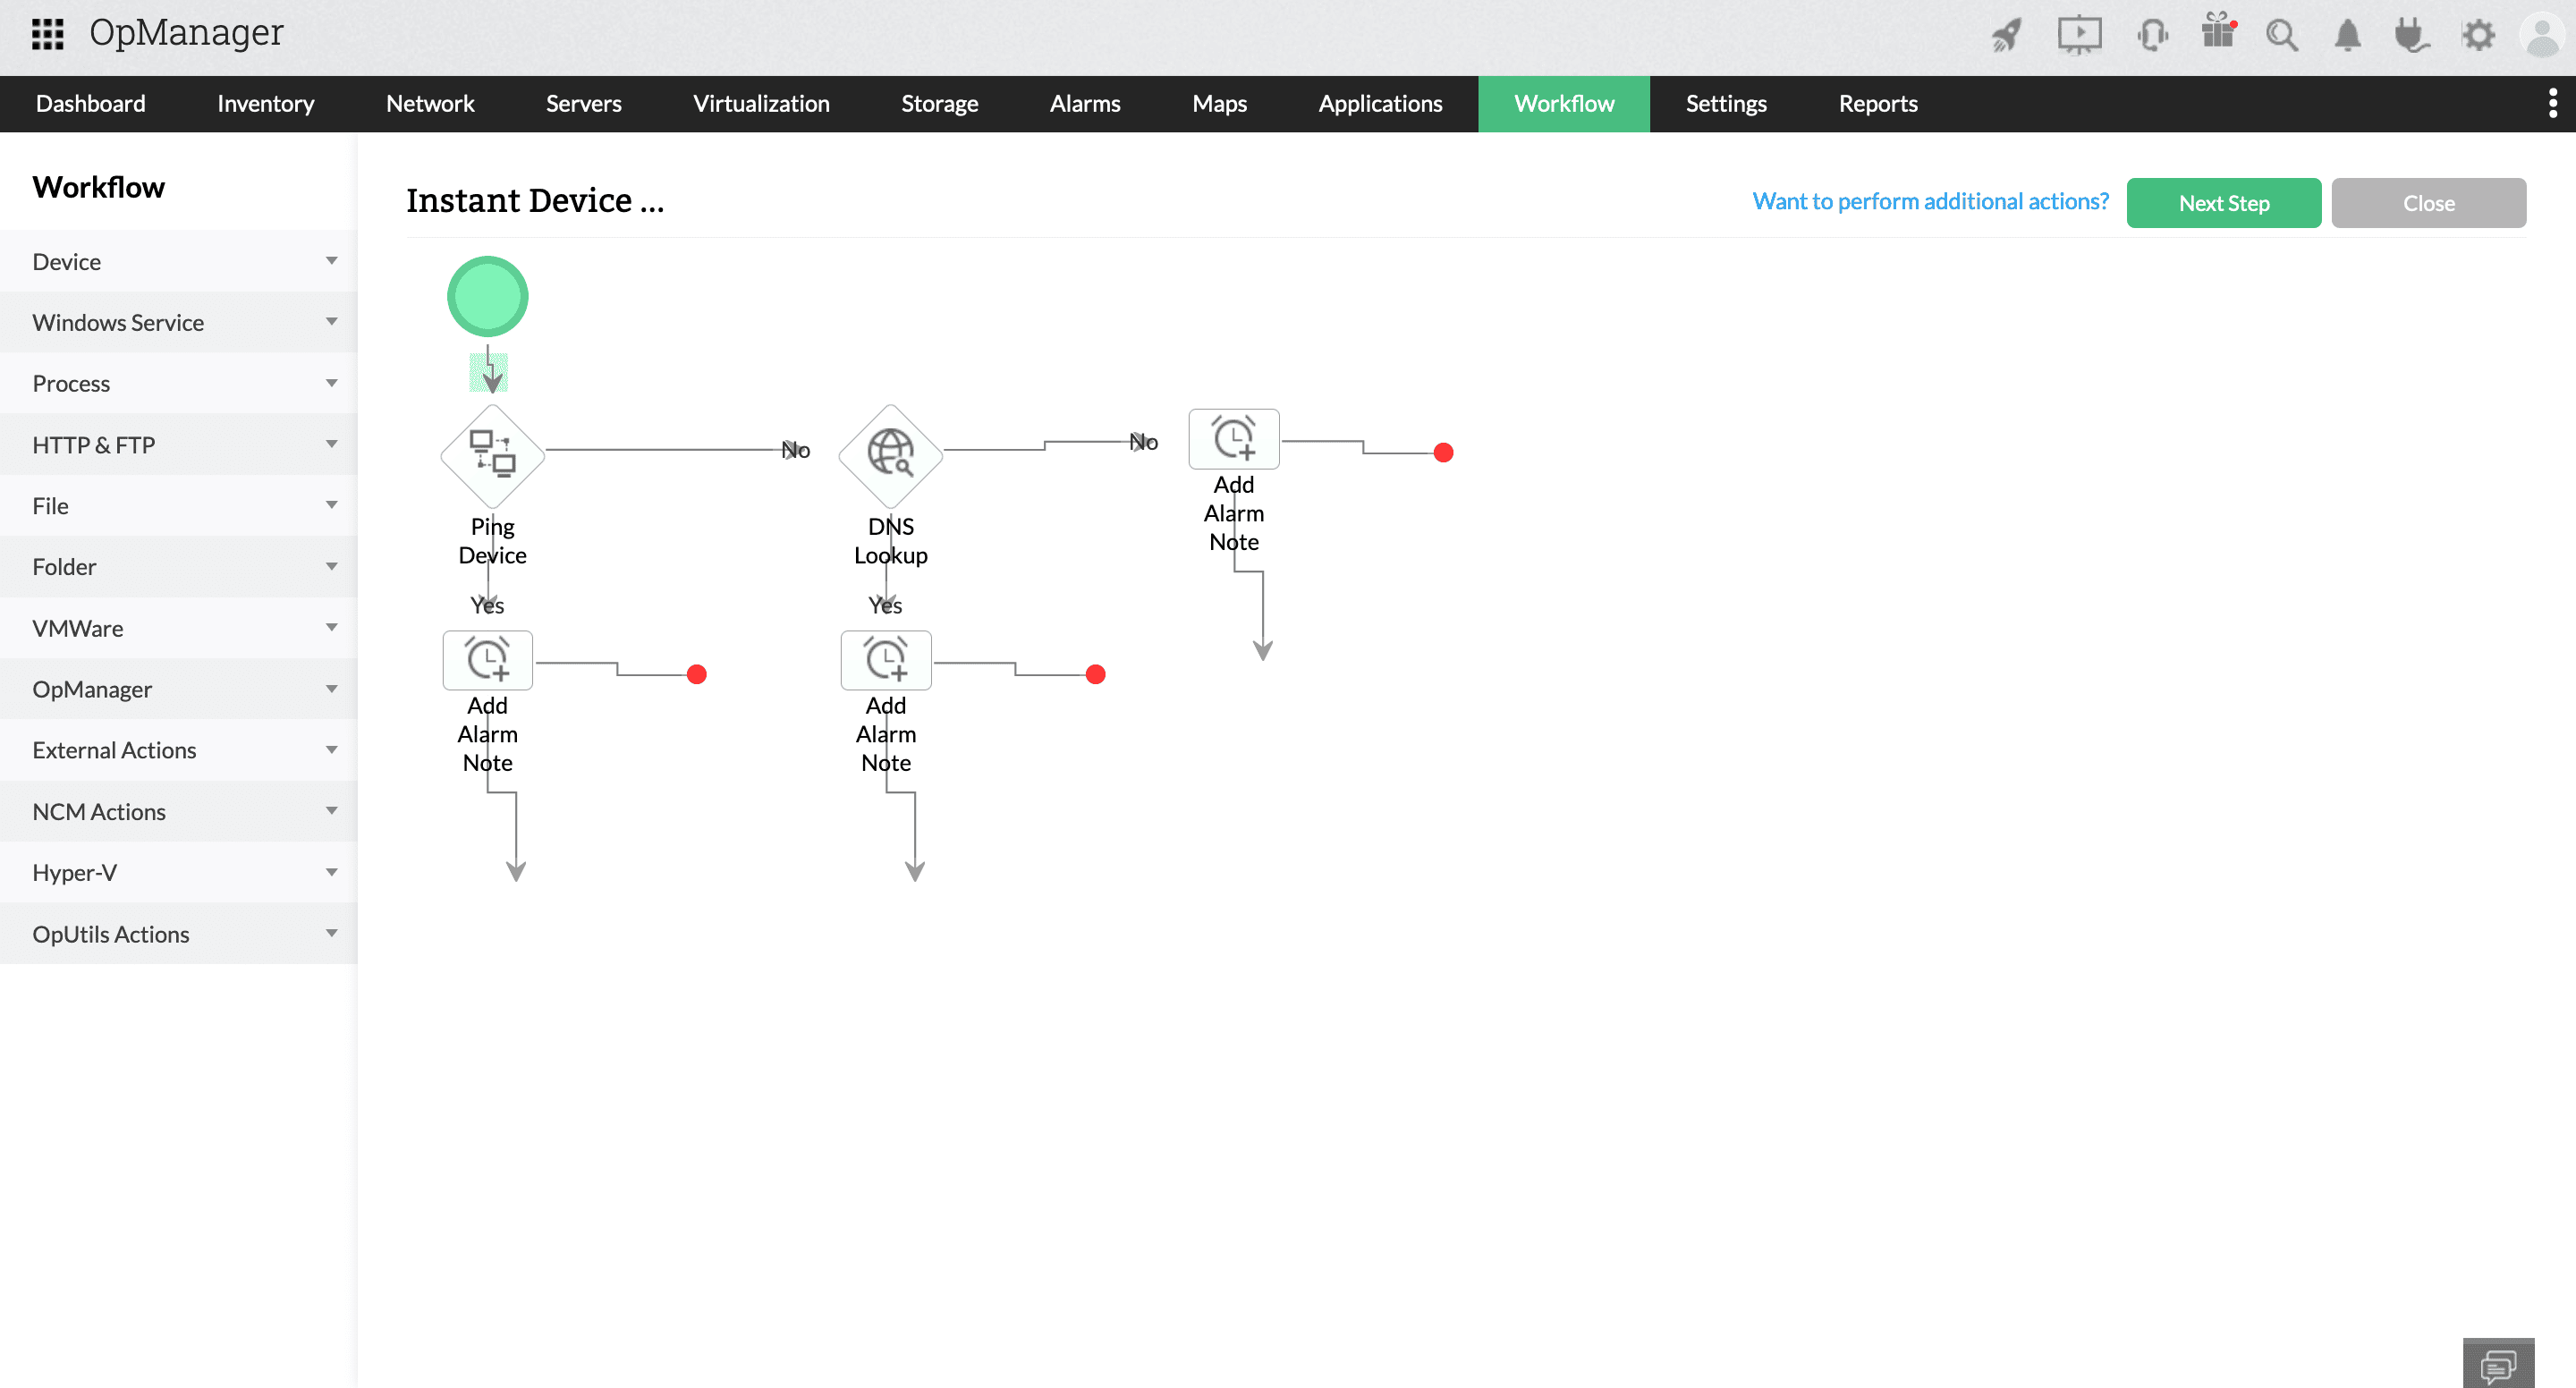
ManageEngine features automated workflows that can execute actions in your devices, change monitoring settings, and export data to other solutions. By leveraging this, you can start diagnostics and remediation steps instantly and gain a head-start in the race against SLAs.
IT workflow automation
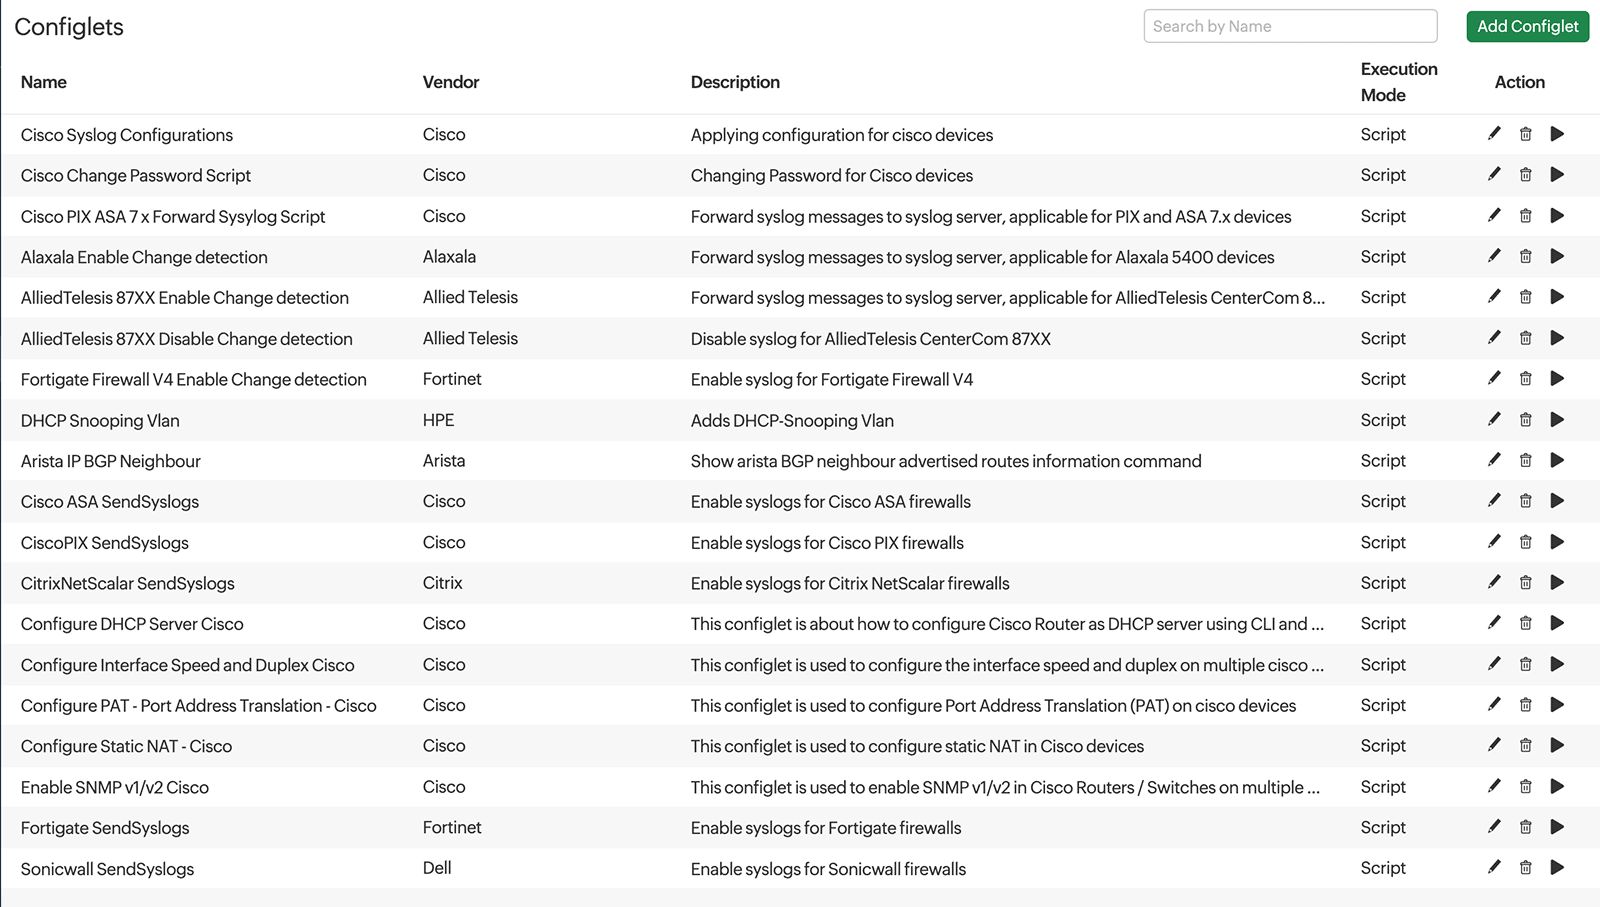
Workflow automation triggers conditional actions sequentially to execute complex tasks. With the on-premise version, workflows can be built without any scripting using a simple drag-and-drop workflow builder.
REST-API based automation
ManageEngine offers out-of-the-box integrations with ITSM and chat tools to automate cross-platform workflows. You can automatically raise tickets for network issues, sync your CMDB to track changes to the network, and send context-rich notifications in group chats for faster fault resolution.
Rule-based automation
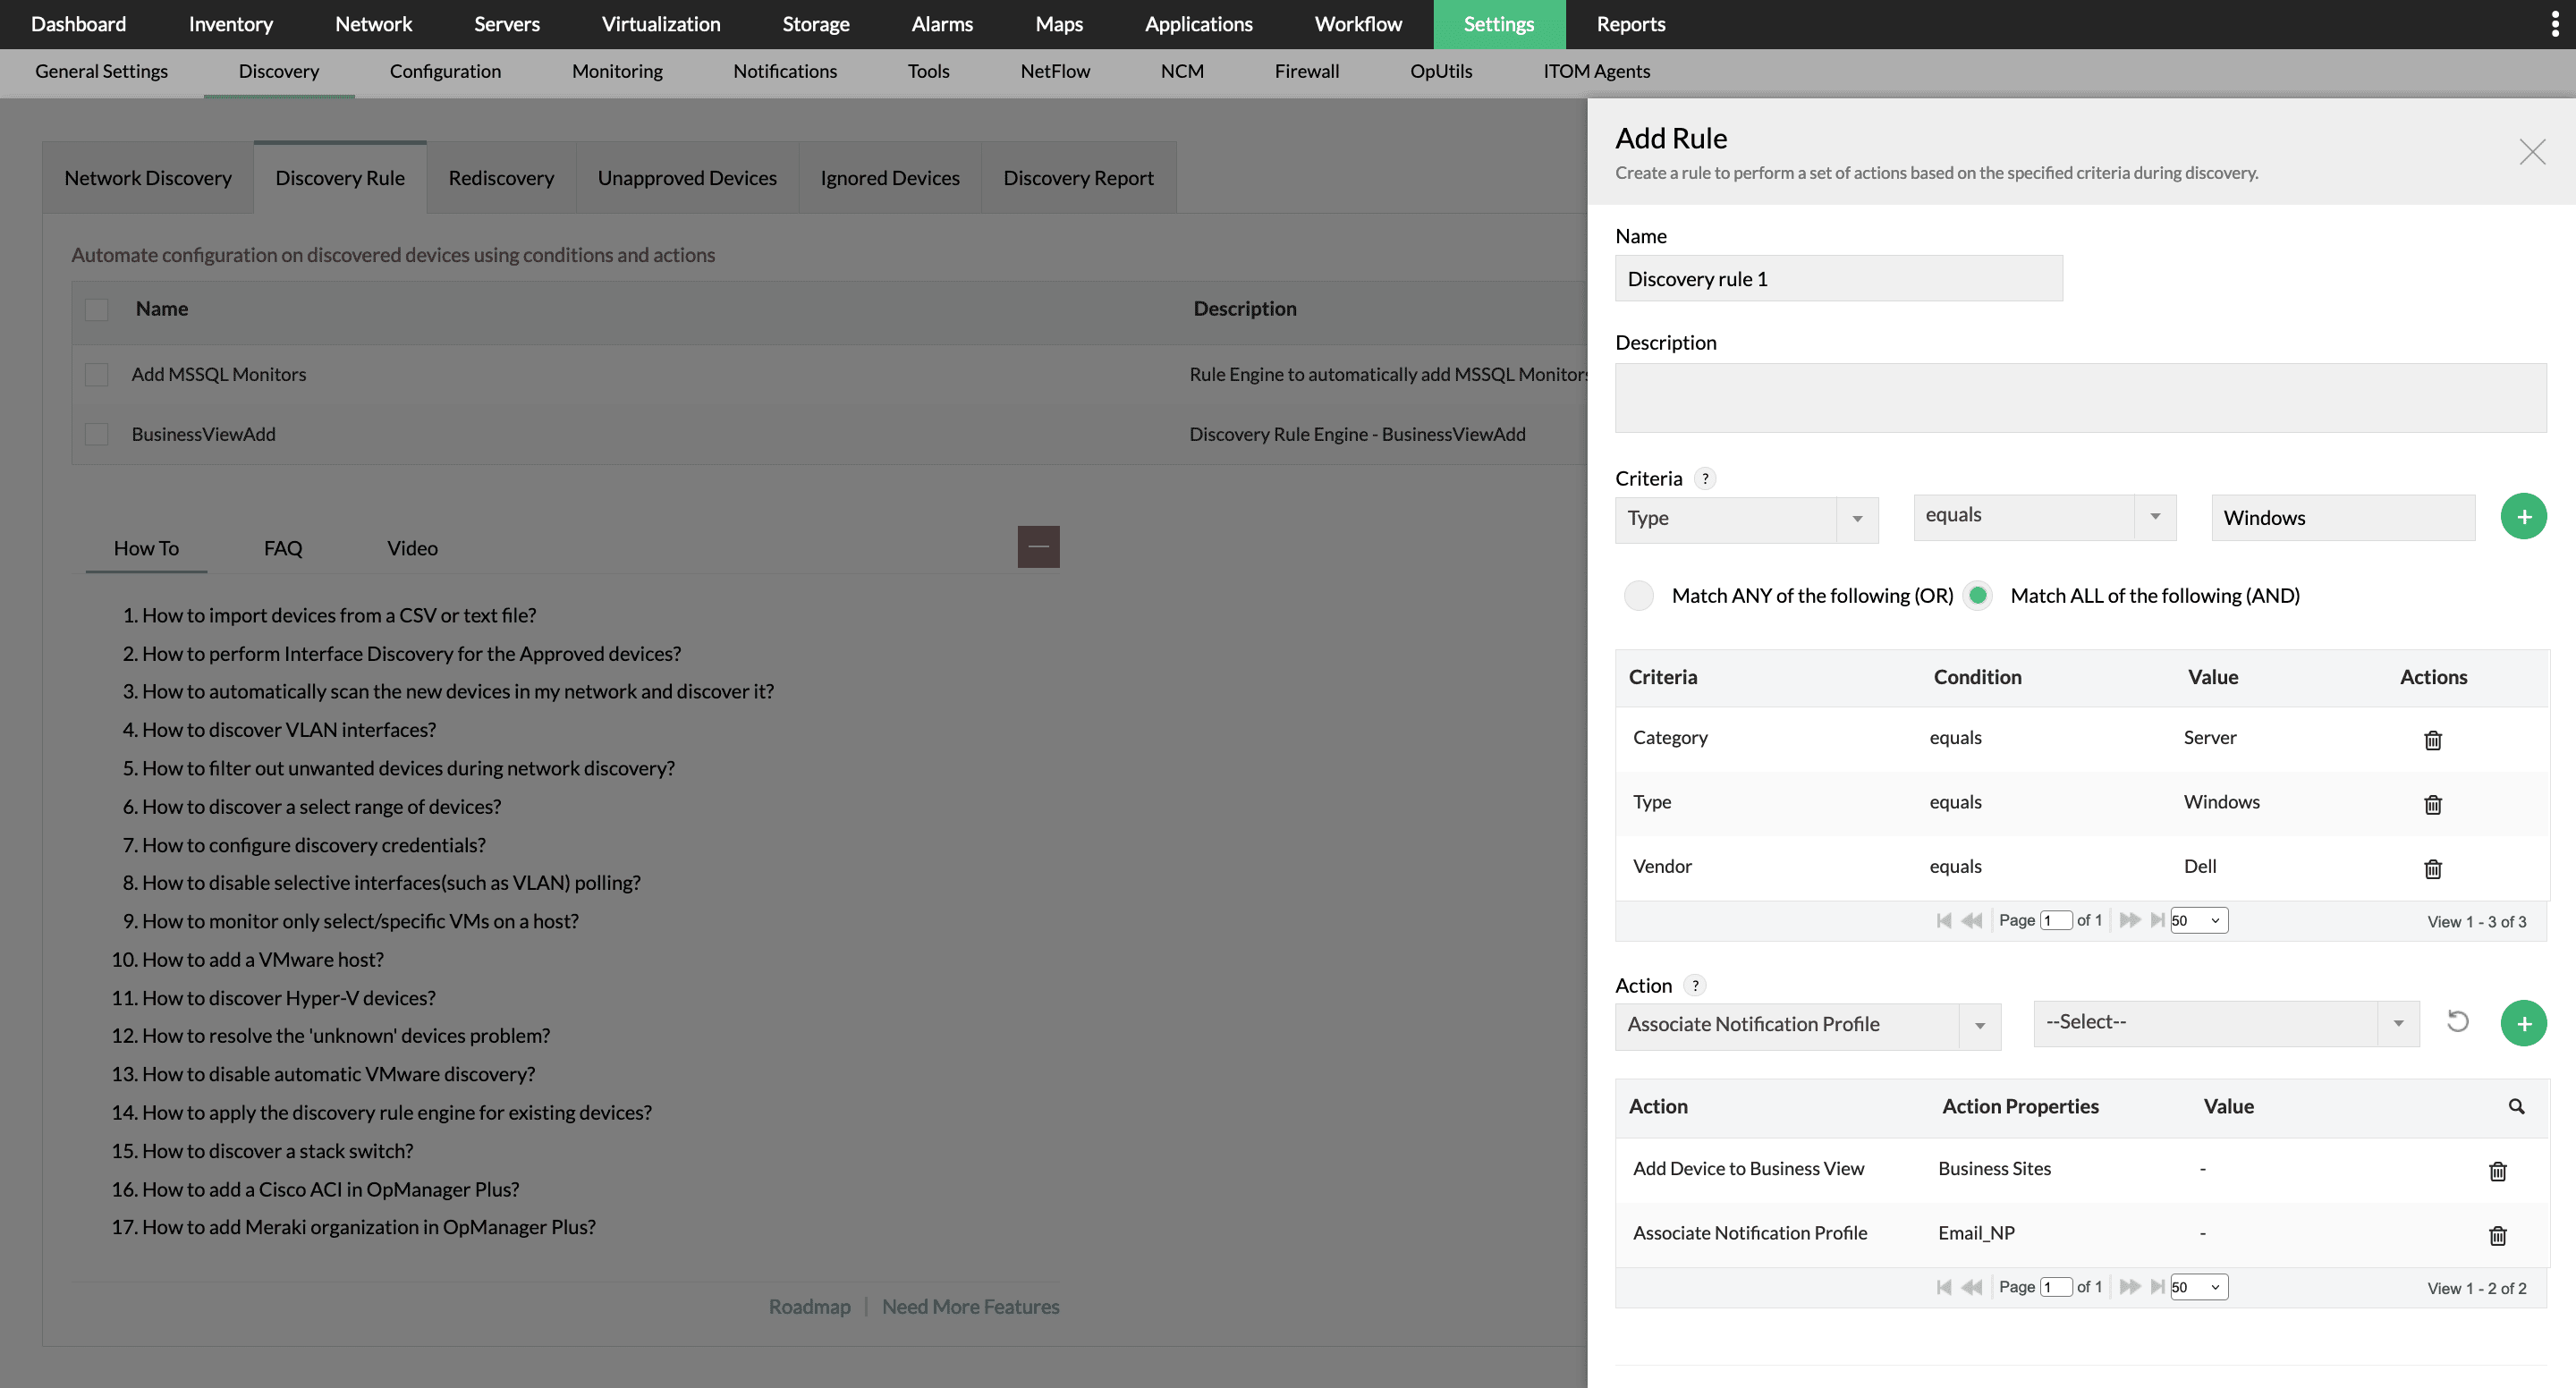
Create schedules and conditional rules to automate repetitive monitoring tasks. For instance, you can automate post-discovery monitor association, add discovered devices to groups, correlate related alarms, or escalate unattended alarms.
Gain in-depth visibility with maps and visualization
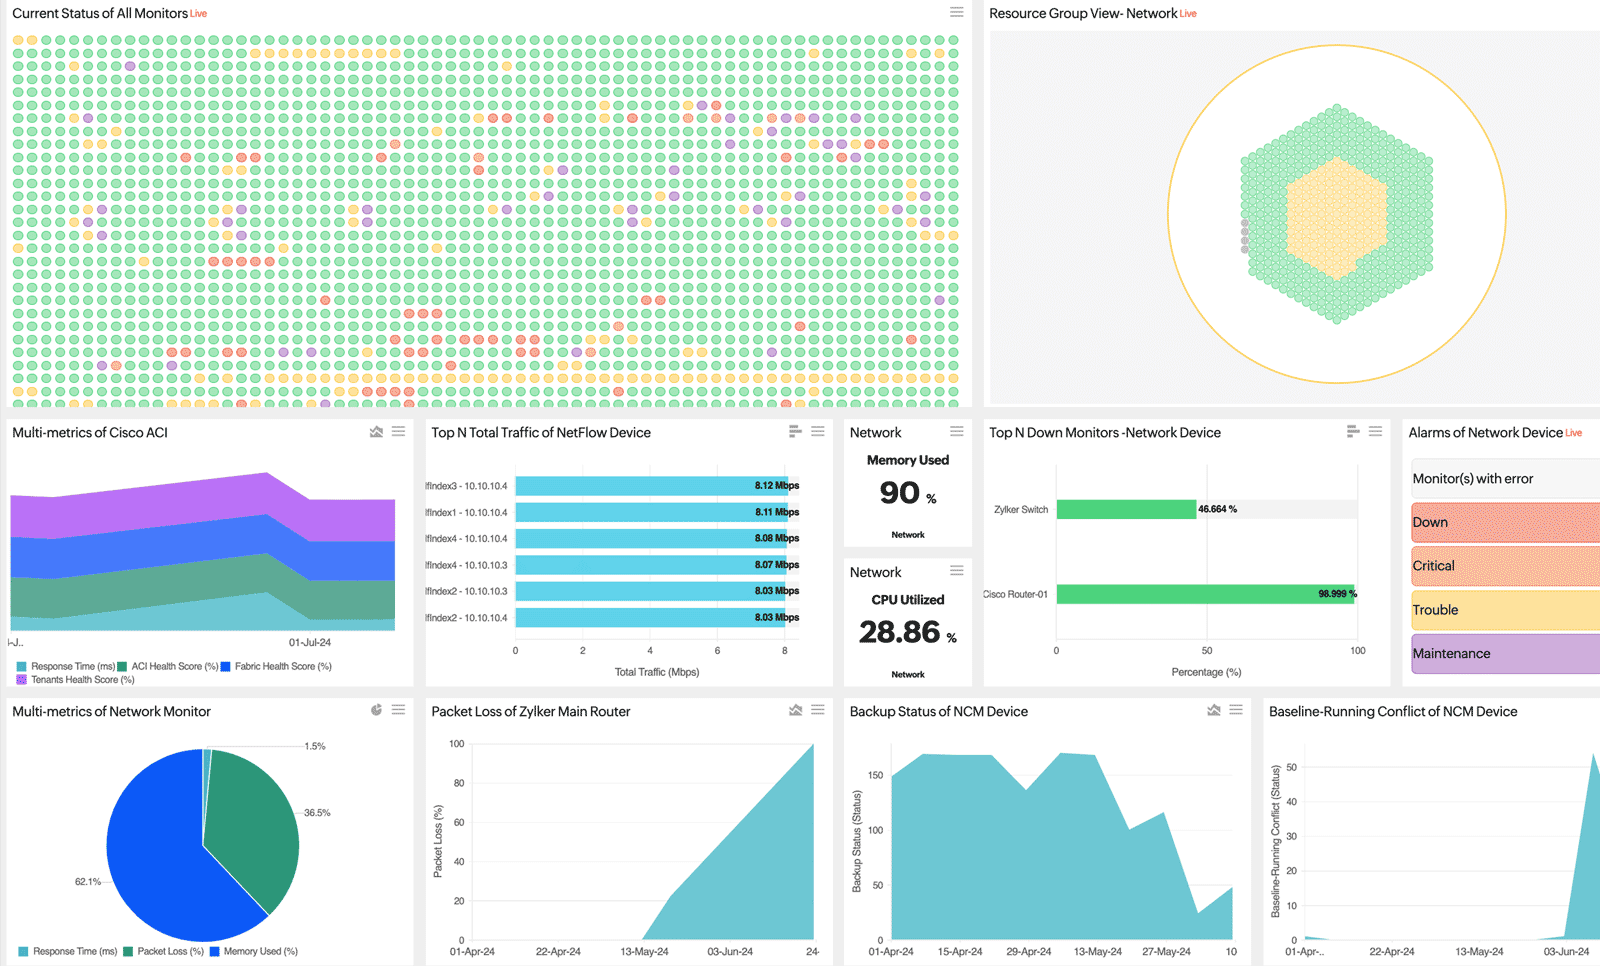
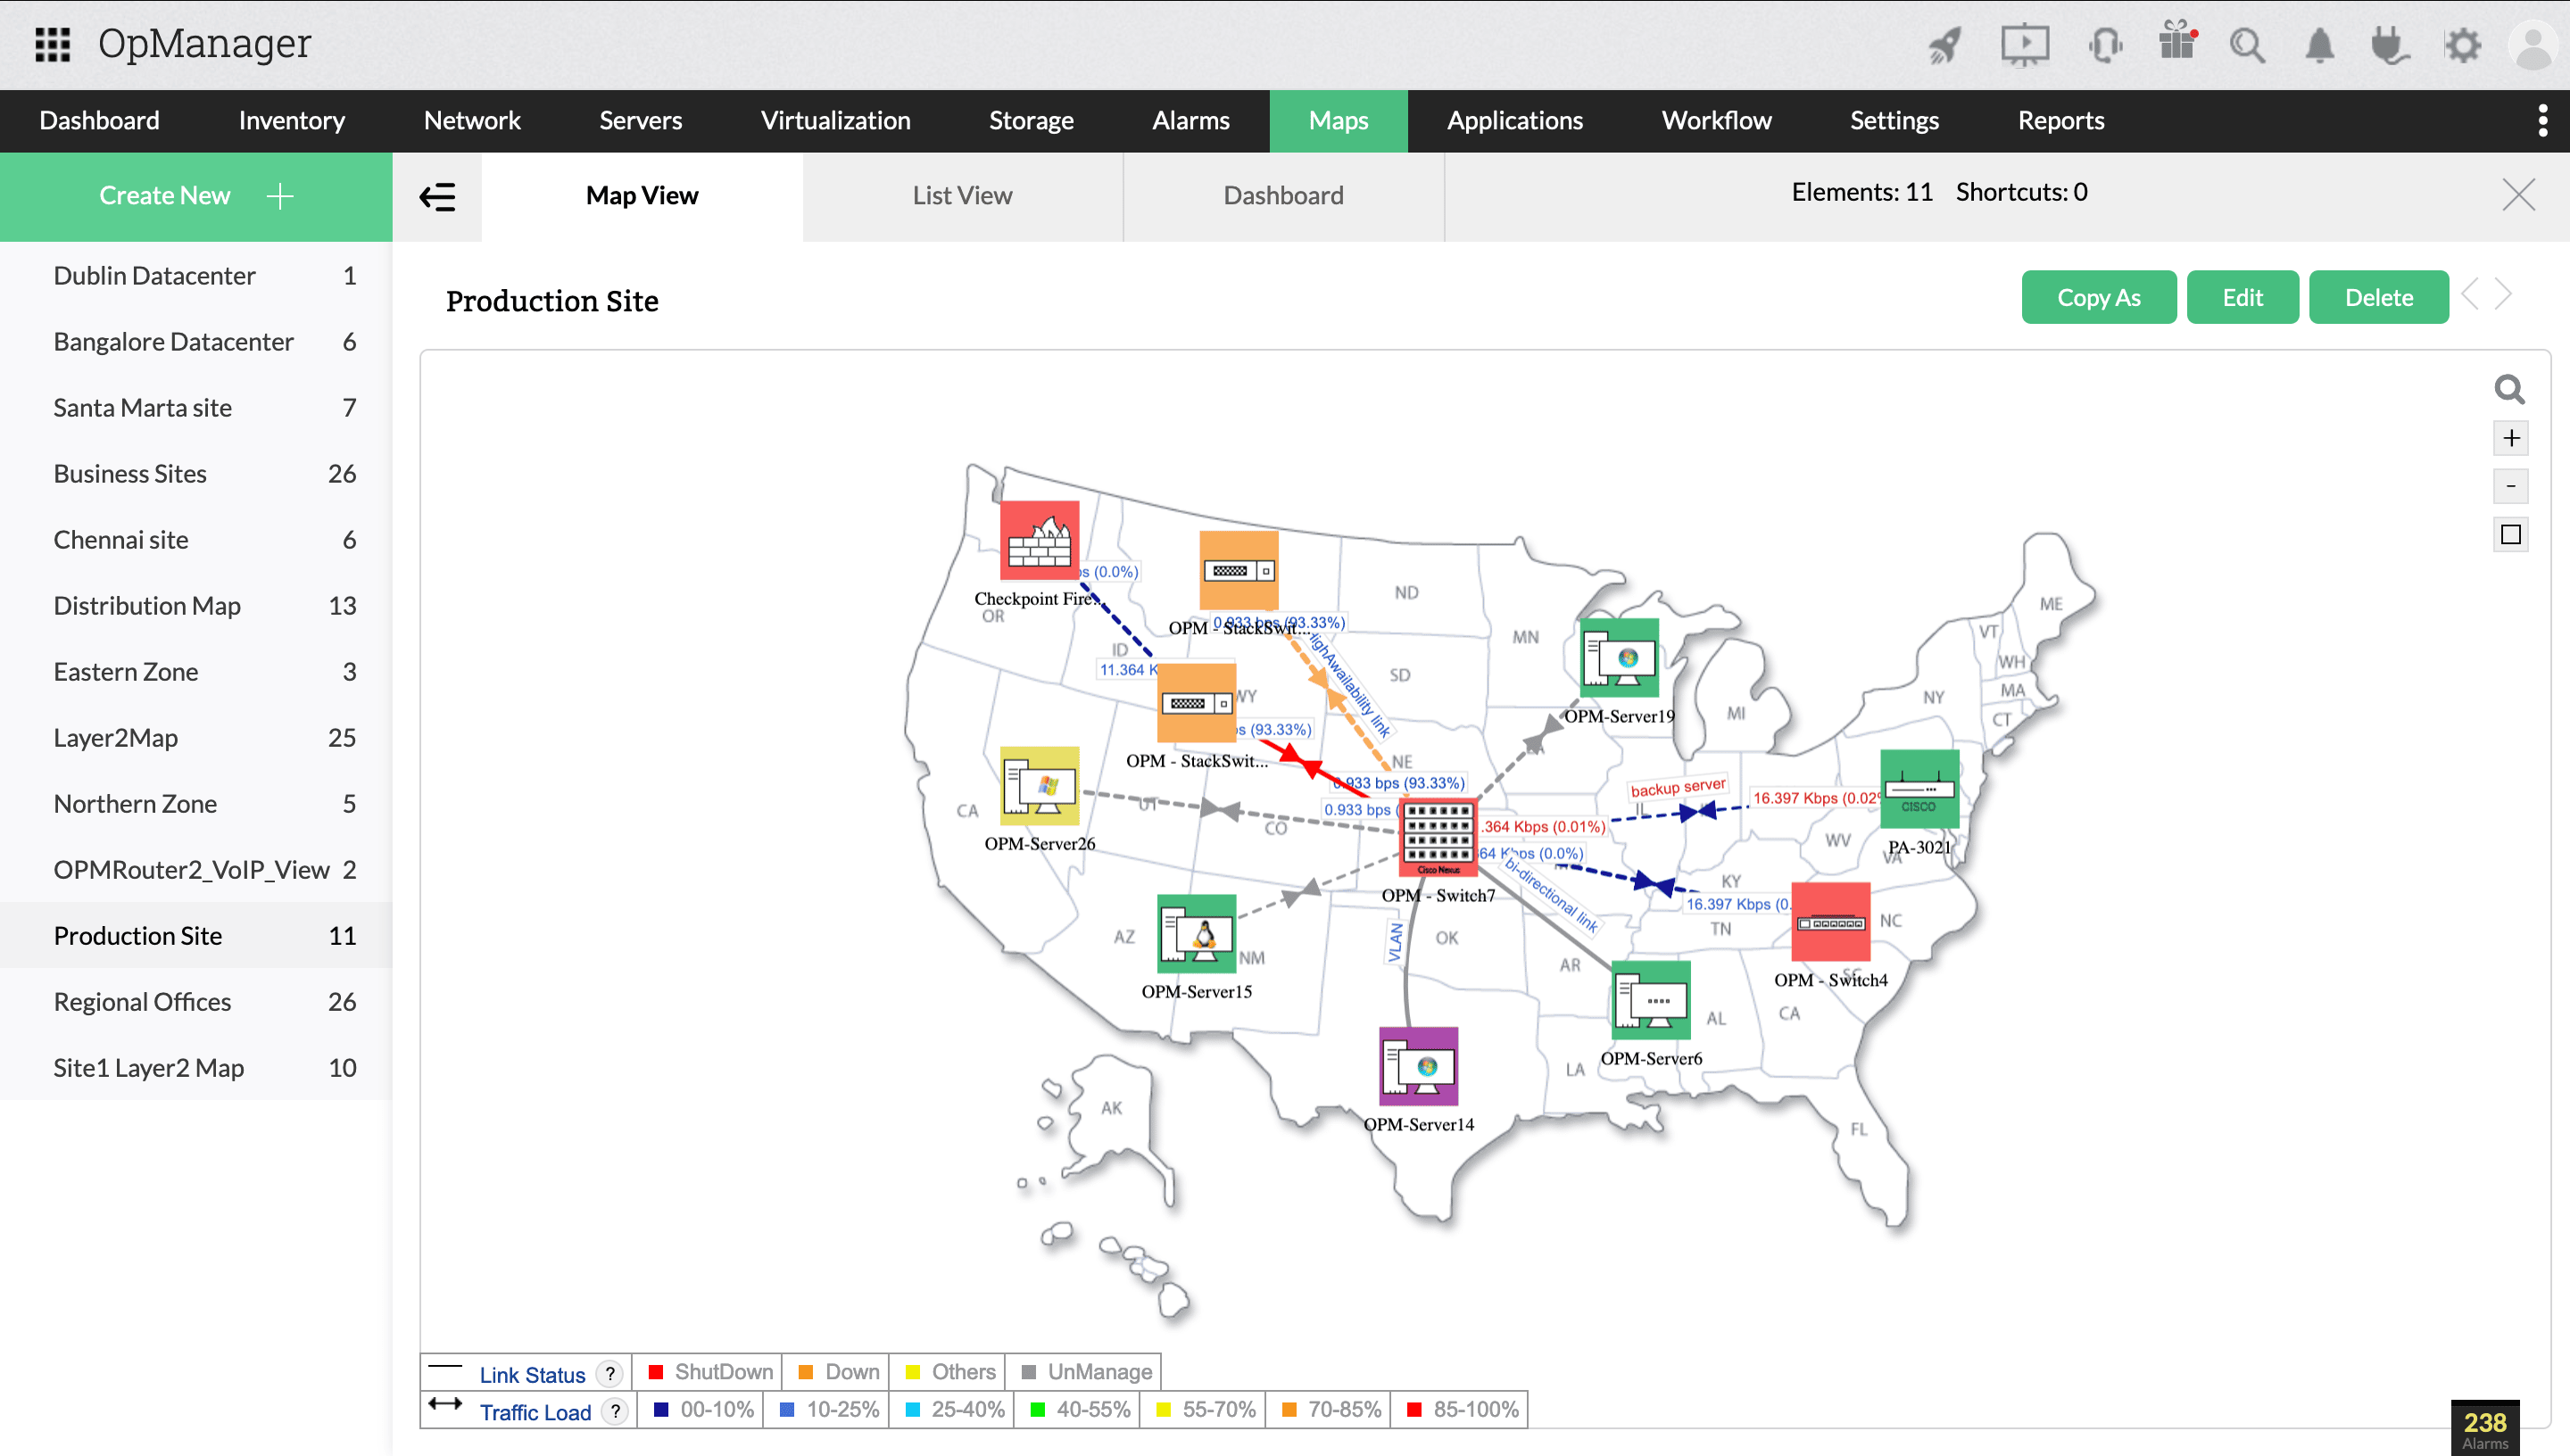
ManageEngine features color-coded, multi-format visualization tools and maps to represent monitored data in a easy-to-understand manner. Maps and visualization tools can be incorporated into dashboards to provide visibility into the network infrastructure at one glance.
Automated topology maps
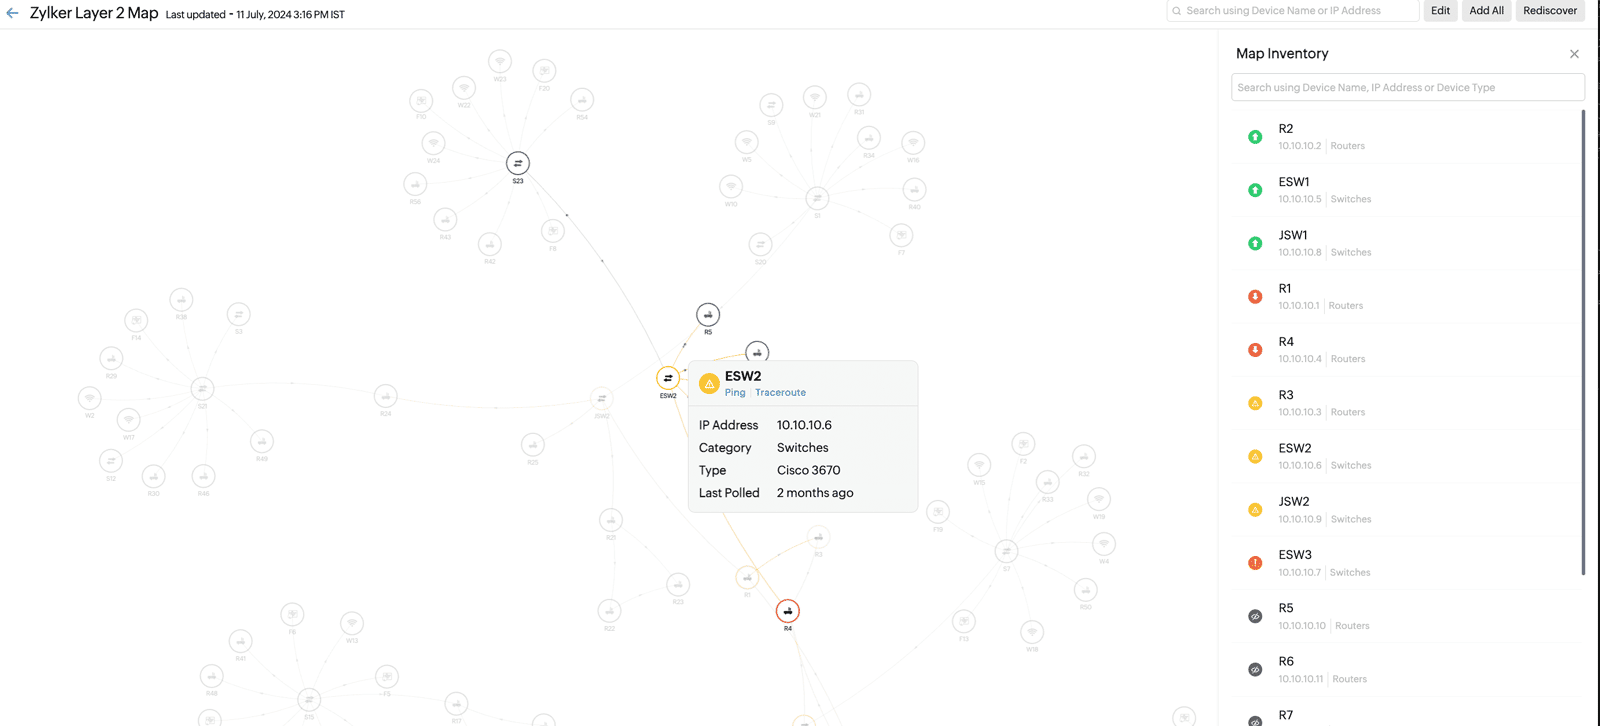
Track Layer 2, Layer 3, and virtual networks automatically to monitor device and interface status, parent devices, and topology.
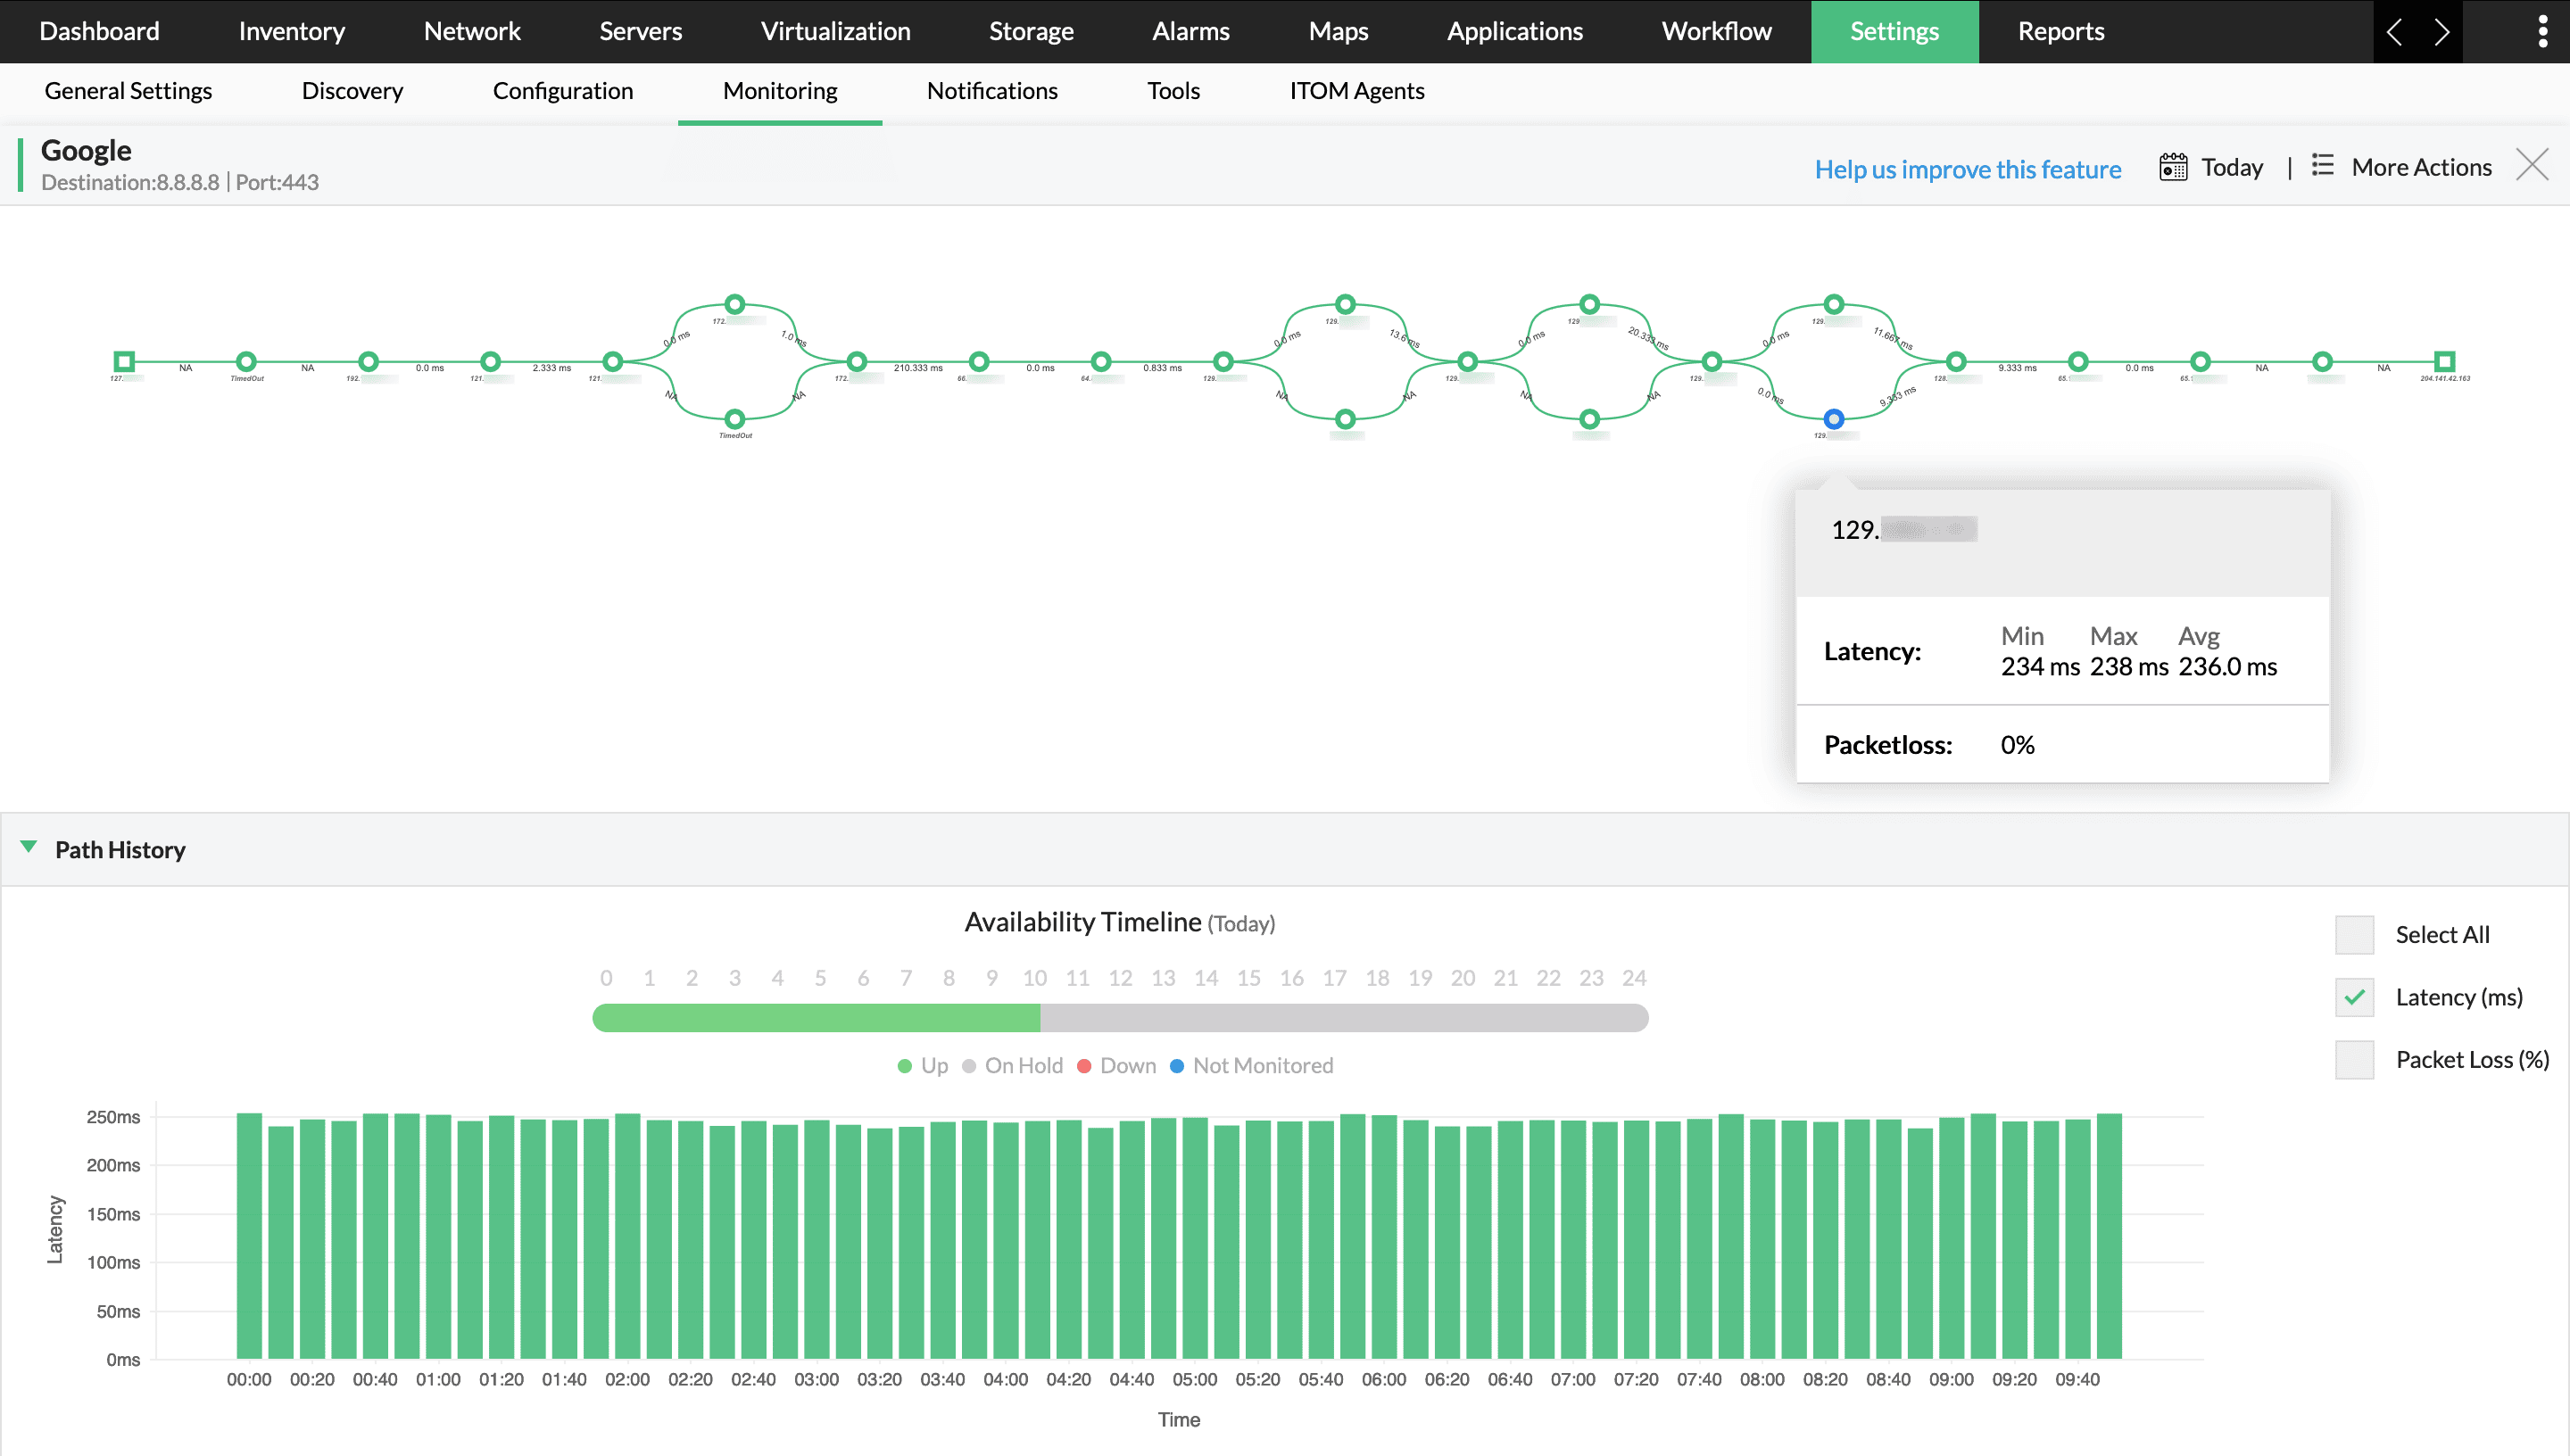
Network path/route maps
Map WAN networks on a hop-by-hop basis to pinpoint the exact node causing packet loss and high response time.
Zoho/Google maps integration
Add your monitored devices to a responsive global map to keep track of distributed infrastructure.
Cisco Meraki maps
Map Cisco Meraki environments to manage controllers, access points, and network performance.
5 Reasons why IT teams choose ManageEngine over PRTG

- Convenient: Powerful automation and intuitive interface
- Cost-effective: Better features at a lower price
- Secure: Local data storage, GDPR compliant
- Modernized: Advanced monitoring and security features
- AI-powered: In-built AI-engine for intelligent monitoring
Trusted by 1 million IT admins across the globe
Why customers prefer ManageEngine
Your privacy is our priority
We abide by the global privacy and security standards through regular testing and certifications


