Celona Monitoring
OpManager now supports monitoring Celona 5G private networks. By discovering the Celona Orchestrator, users gain visibility into sites, edge devices, and access points managed within the Celona environment.
Discovering Celona Orchestrator
OpManager discovers Celona components through the Orchestrator using REST API-based polling. During discovery, the following entities are automatically identified and associated:
- Orchestrator
- Sites
- Edge Devices
- Access Points
Steps to Add a Celona Orchestrator
- Go to Settings → Discovery → Add SD-WAN.
- Select Celona Orchestrator as the device model from the dropdown.
- Enter the required details:
- Orchestrator IP address / Hostname
- Celona API credentials
- Select SD-WAN credentials from the dropdown or click Add Credentials.
- Click Discover.
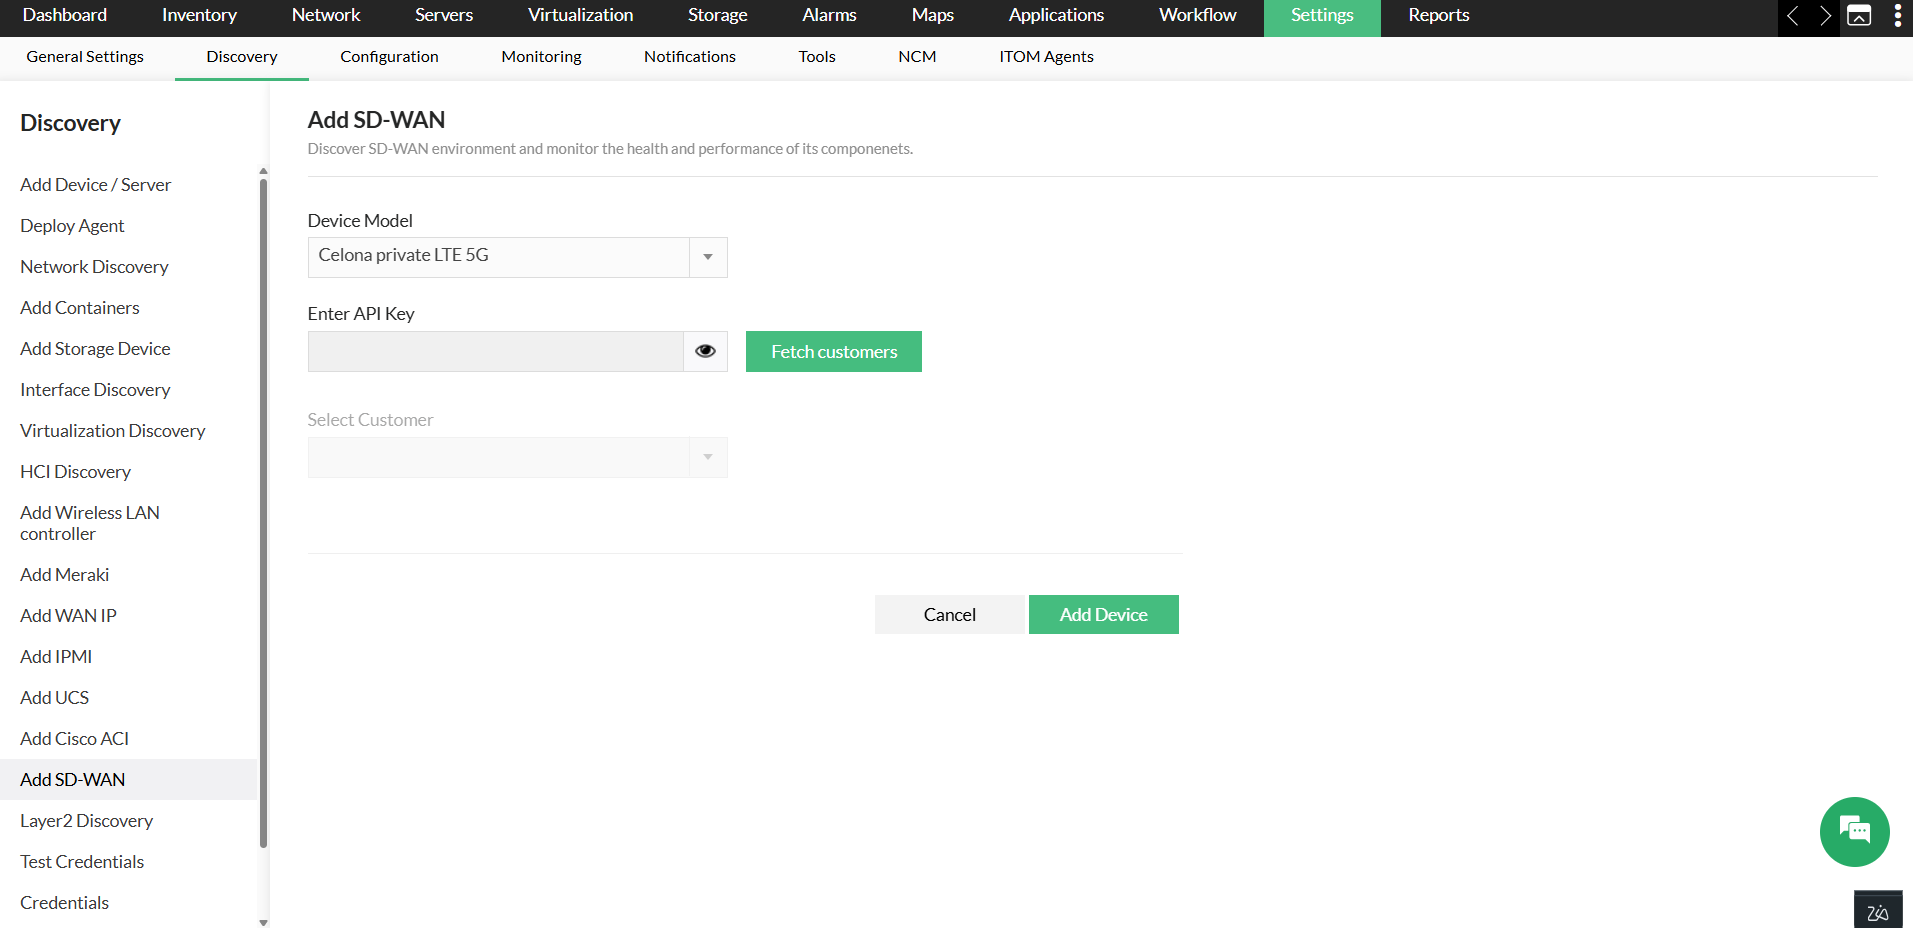
Once added, OpManager fetches all associated sites, edge devices, and access points from the Orchestrator.
Celona Orchestrator Snapshot Page
After discovery, the Celona Orchestrator is added to the inventory. The snapshot page provides a detailed overview of all components through dedicated tabs and summary sections.
Accessing the Snapshot Page
- Navigate to Inventory or Network.
- Select the Celona Orchestrator to open its snapshot page.
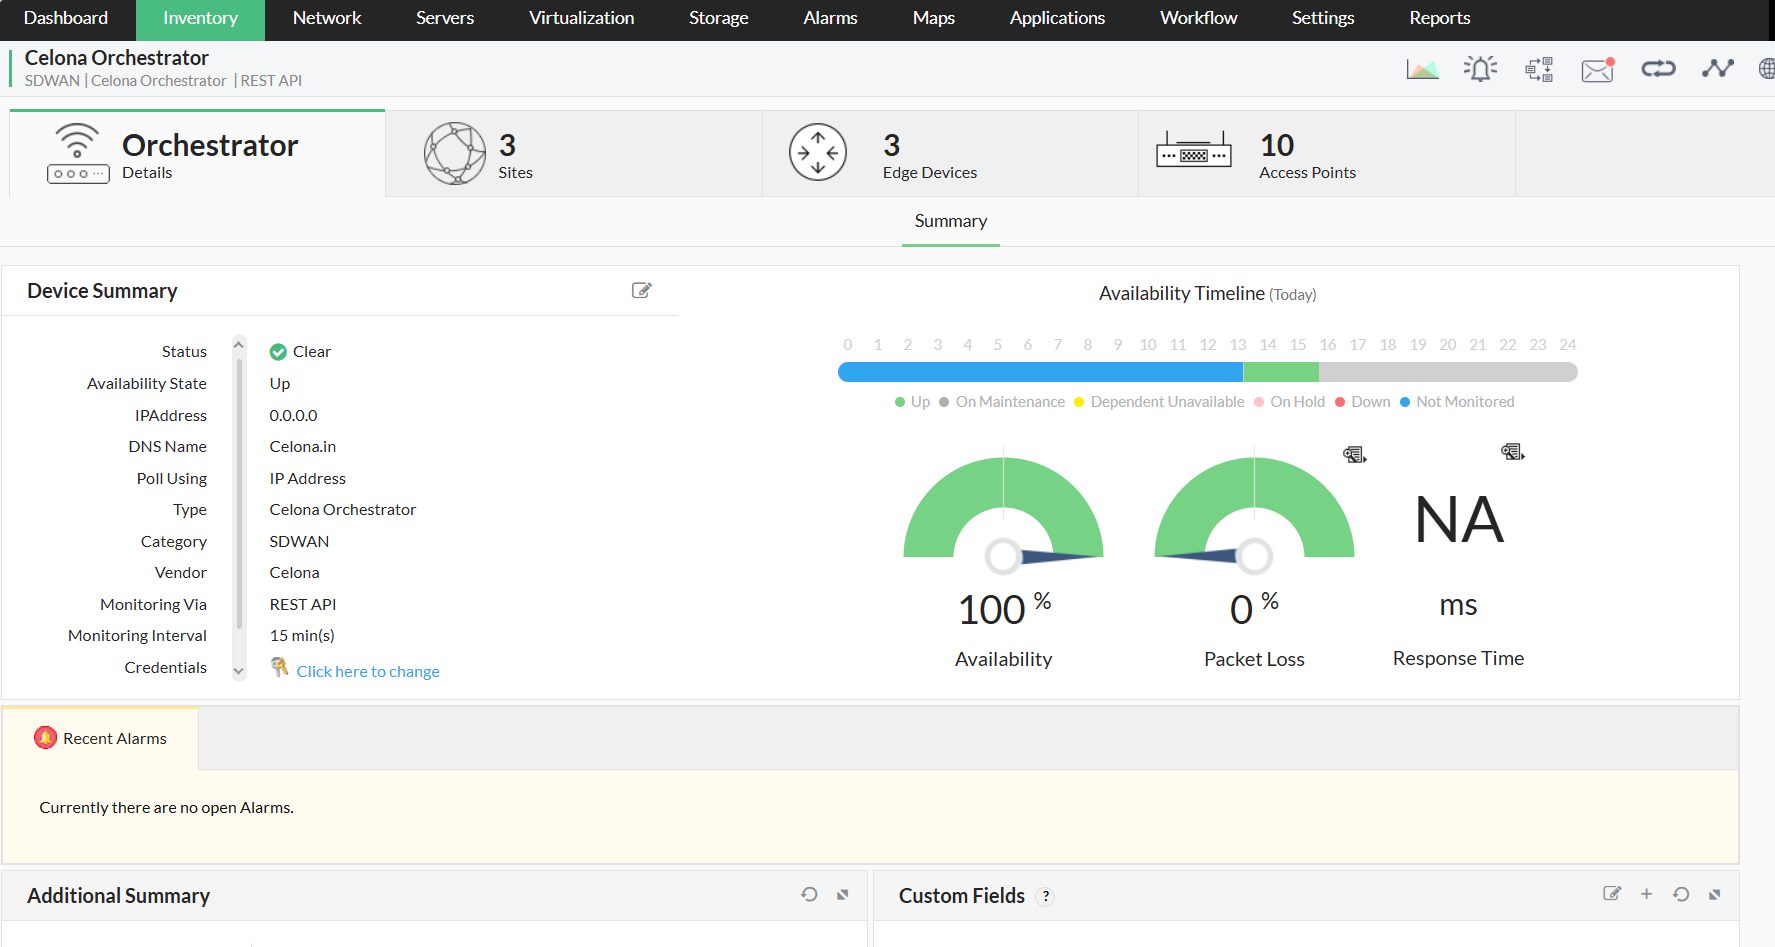
Device Summary
The Device Summary section displays key information:
- Status: Current health status (e.g., Clear, Trouble)
- Availability: Availability percentage
- Polling Information: REST API polling type and frequency (e.g., every 15 minutes)
- Alarms: Recent alarms for troubleshooting
Additional fields provide customer-related details such as ID, company name, and PLMN name. Custom fields can also be associated for added context.
Sites View
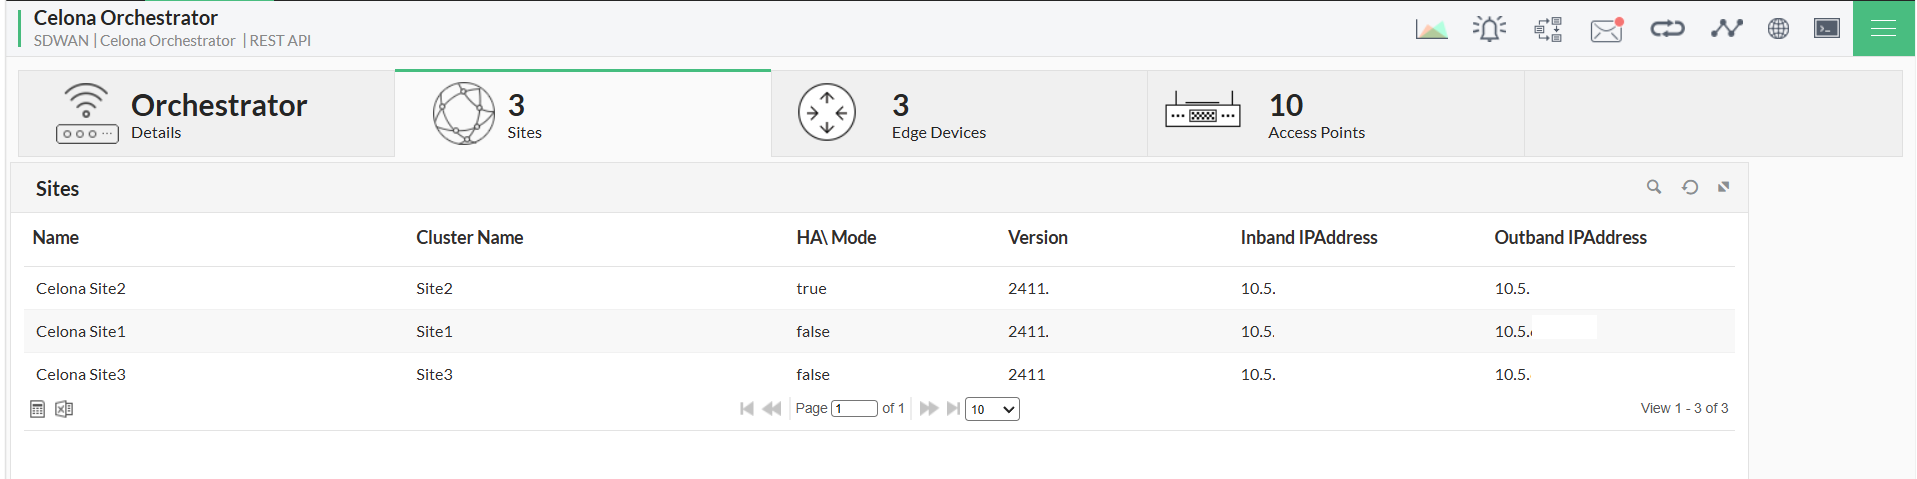
The Sites View lists all sites managed by the Celona Orchestrator.
- Name: Site identifier
- Cluster Name: Associated cluster
- HA Mode: High Availability status
- Version: Software version
- IP Address Details: Inbound and outbound IP addresses
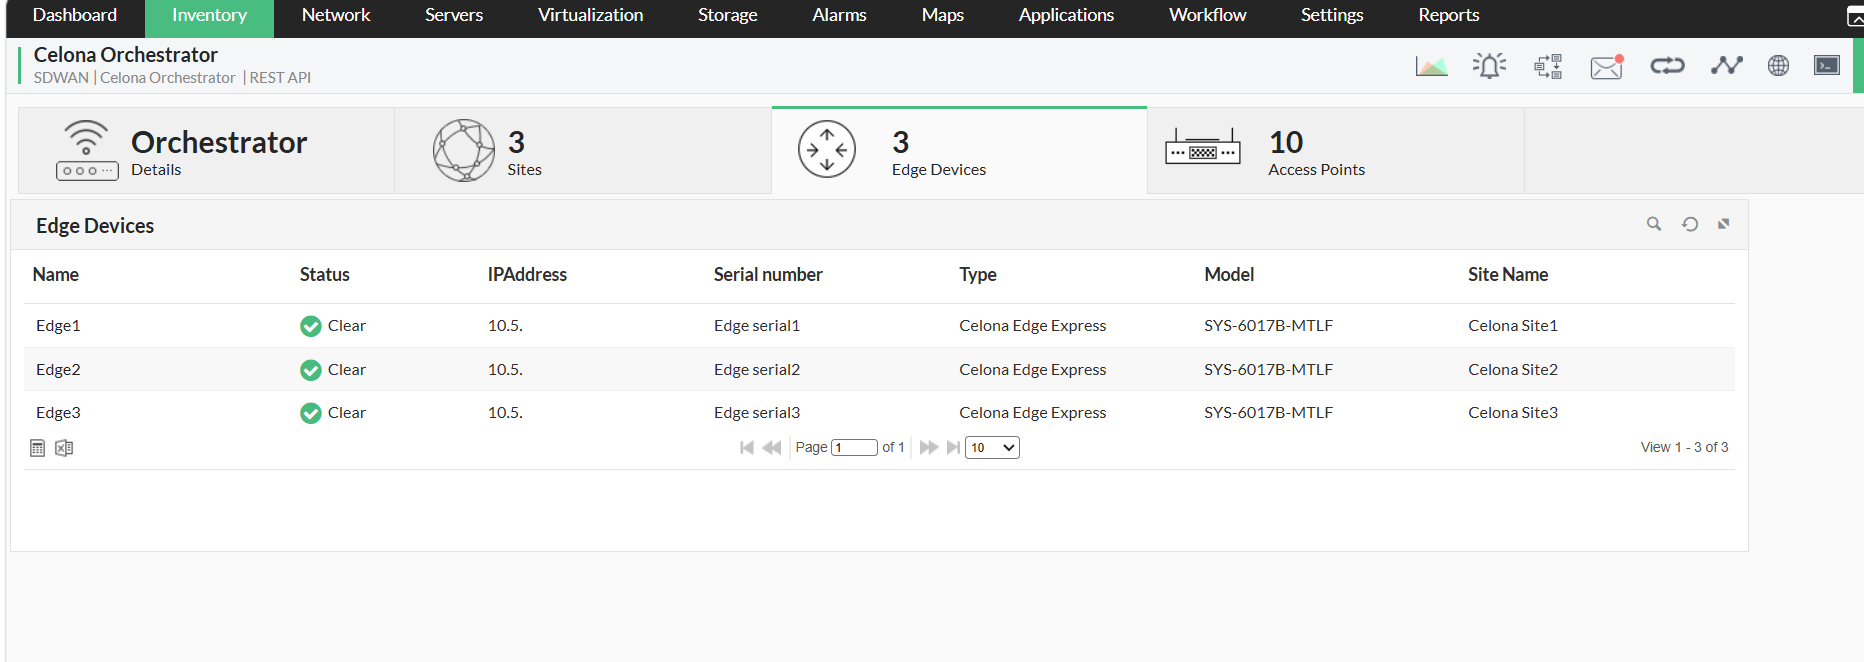
Edge Devices
Displays all edge devices associated with the orchestrator.
- Name: Device name
- Status: Health status (e.g., Clear)
- IP Address: Assigned IP
- Serial Number: Unique identifier
- Type: Device type (e.g., Celona Edge Express)
- Model: Device model
- Site Name: Associated site
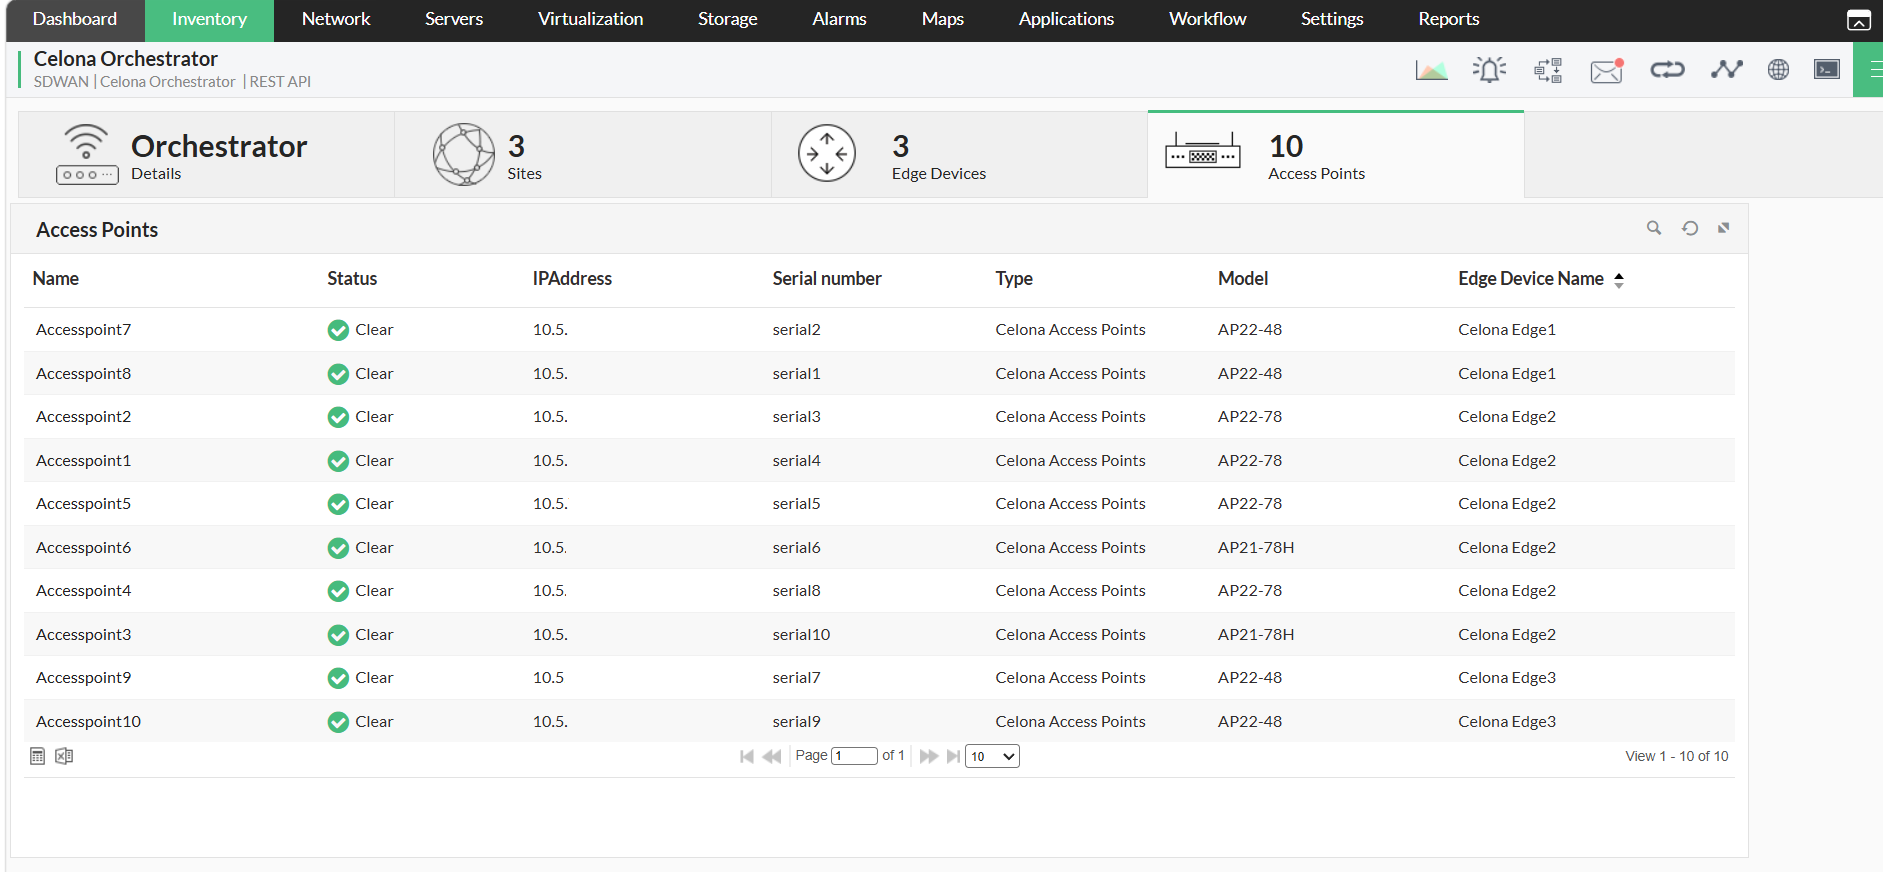
Access Points
Lists all Celona access points and their details.
- Name: Access point name
- Status: Current status (Clear, Trouble)
- IP Address: Assigned IP
- Serial Number: Unique identifier
- Type & Model: Device type and model
- Edge Device Name: Managing edge device