Monitoring with Data Ingestion
OpManager tracks device health and performance through a range of performance monitors, each collecting specific metrics from a device. Most of these monitors work by directly polling the device using a supported protocol.
Specific performance monitors are associated with OpManager devices and device templates through supported protocols such as SNMP, WMI, and CLI. Devices or templates that rely on multiple or unsupported protocols cannot always be monitored this way, since OpManager reads data only through the protocols it natively supports.
The Data Ingestion monitor type addresses this gap. Unlike protocol-based monitors, a Data Ingestion monitor does not collect data on its own. Instead, an external system or application pushes data into the monitor over REST API, using a generated API key. This allows any system capable of making an HTTP call including scripts, cloud services, or third-party tools to feed data into OpManager, extending monitoring coverage beyond what built-in protocols support.
- Adding a Data Ingestion Monitor
- Optional Configurations
- Associating a Data Ingestion Monitor
- Ingesting Data via REST API
- Viewing Ingested Data
Adding a Data Ingestion Monitor
- Go to the device's Snapshot page → Monitors → Performance Monitors → Actions → Add Performance Monitor.
- Alternatively, navigate to Settings → Monitoring → Add Performance Monitor.
- Select the DATA INGESTION tab.
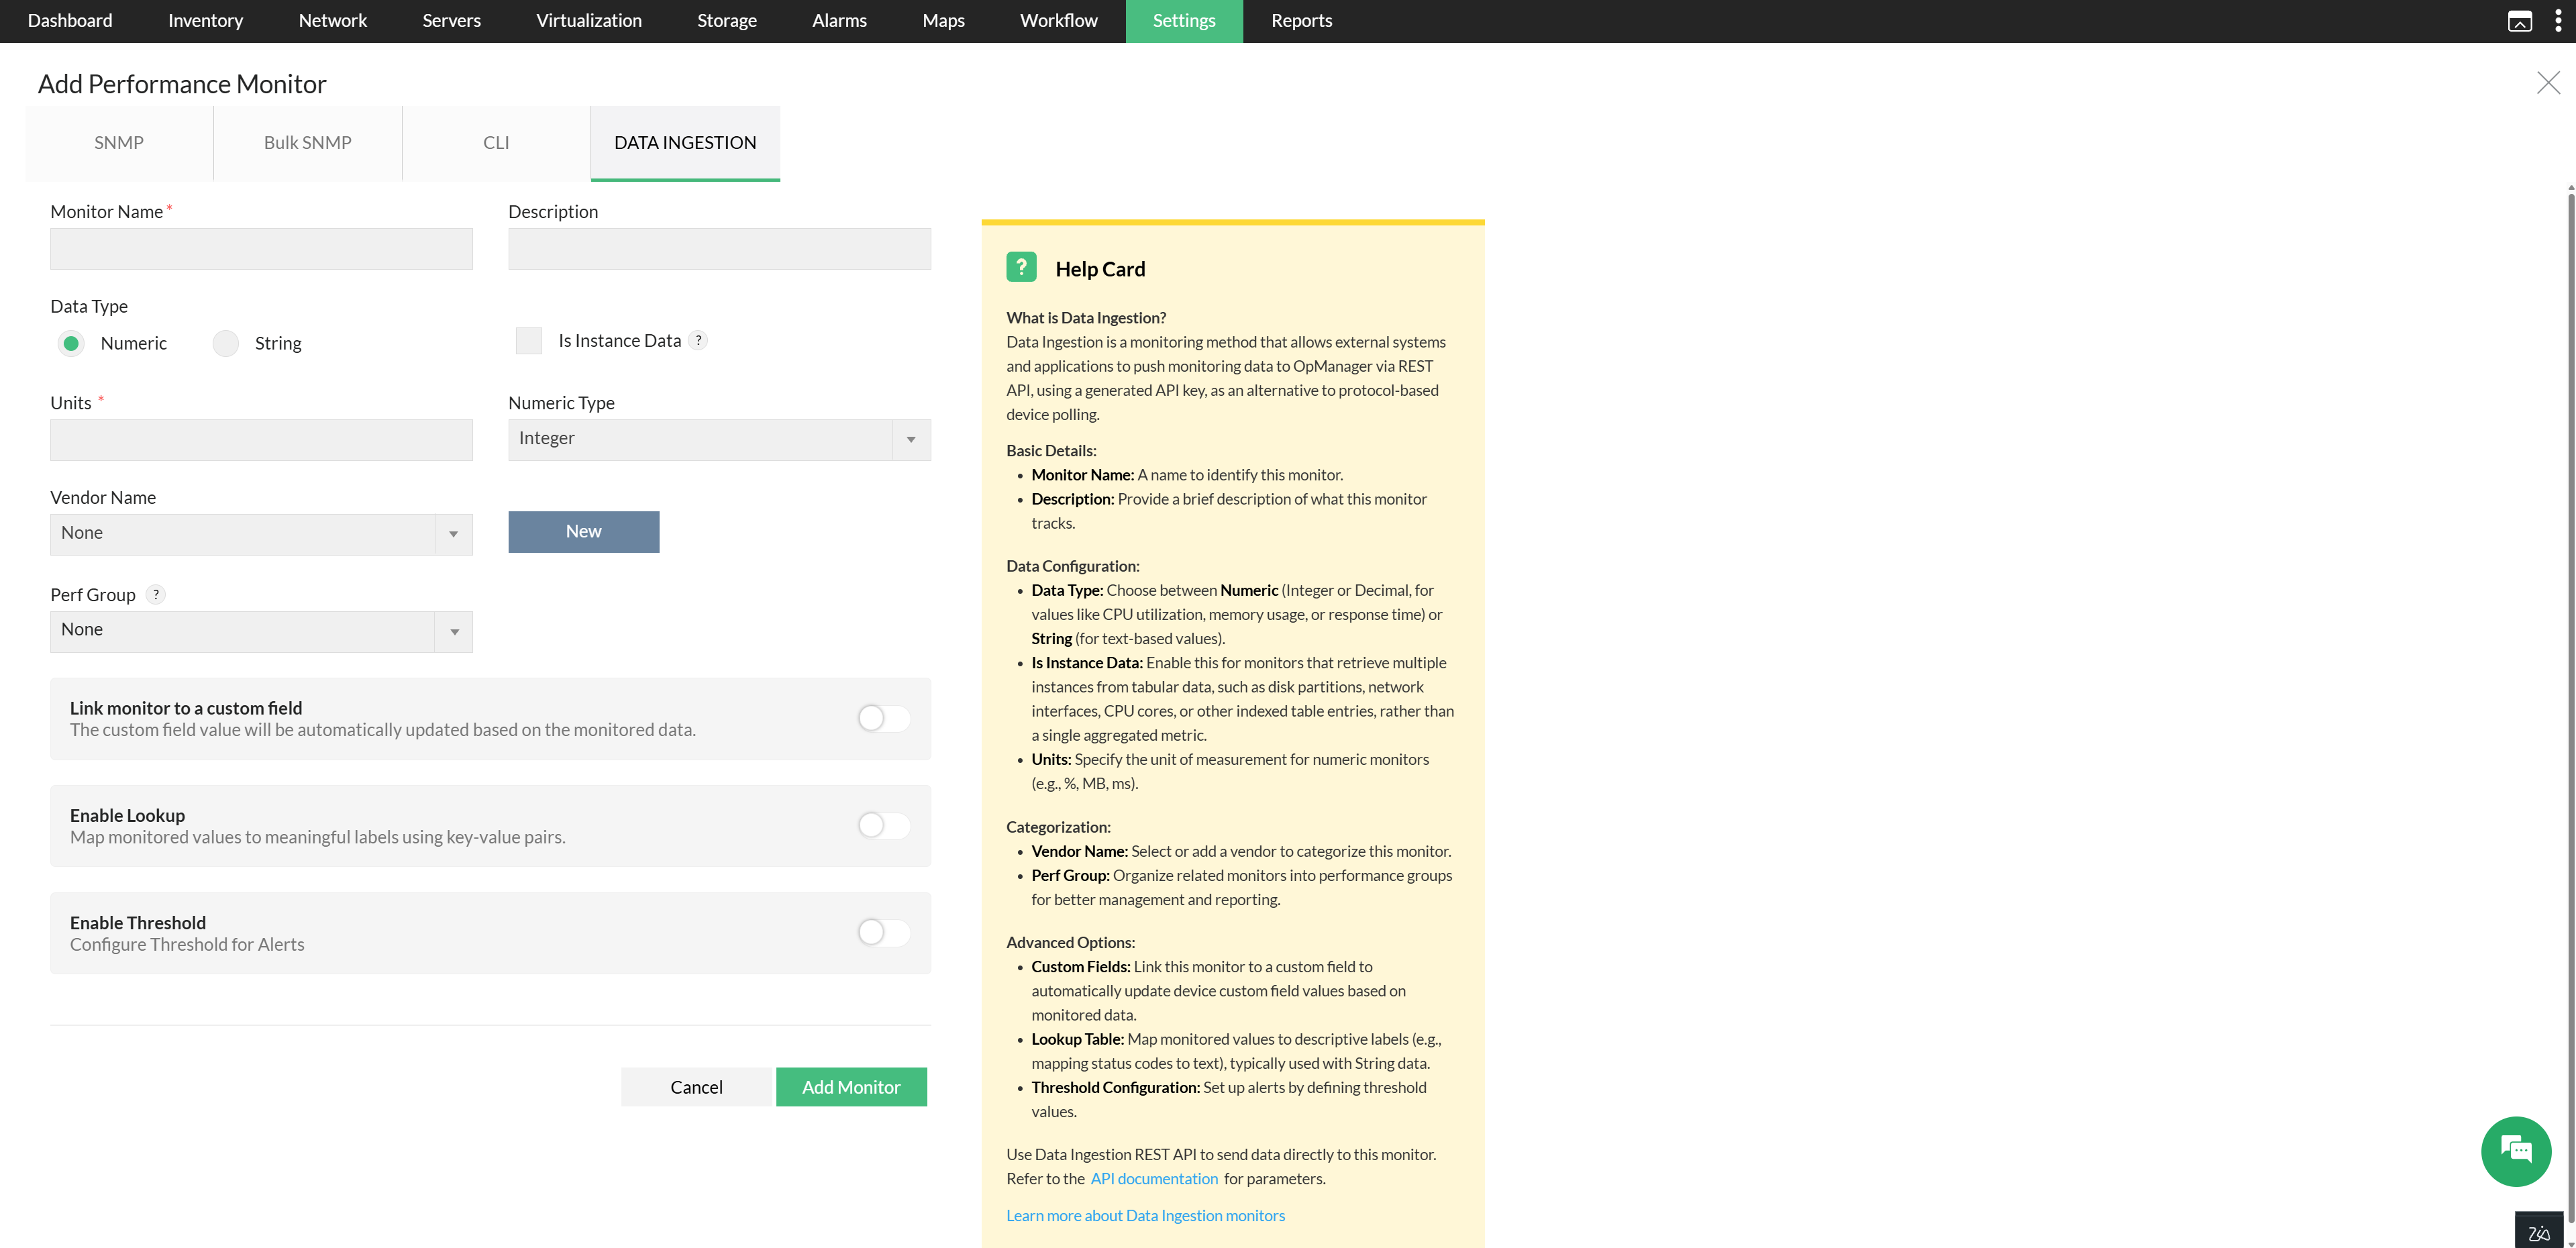
- Fill in the monitor fields. See the Field Reference below for details on each field.
- Click Add to save the monitor.
Field Reference
- Monitor Name: A name to identify this monitor.
- Description: Provide a brief description of what this monitor tracks.
- Data Type: Choose between Numeric (Integer or Decimal, for values like CPU utilization, memory usage, or response time) or String (for text-based values).
- Is Instance Data: Enable this for monitors that report multiple instances, such as disk partitions, network interfaces, CPU cores, or other indexed entries, rather than a single aggregated metric.
- Units: Specify the unit of measurement for numeric monitors (e.g., %, MB, ms).
- Vendor Name: Select or add a vendor to categorize this monitor.
- Perf Group: Organize related monitors into performance groups for better management and reporting.
- Custom Fields: Link this monitor to a custom field to automatically update device custom field values based on monitored data.
- Lookup Table: Map monitored values to descriptive labels (e.g., mapping status codes to text). Typically used with String data.
- Threshold Configuration: Set up alerts by defining threshold values.
Note: Requests that push data to the monitor are authenticated with the OpManager REST API key. See Ingesting Data via REST API.
Optional Configurations
The Data Ingestion tab includes a few optional configurations that can be enabled after the core monitor fields are filled in.
1. Linking a Monitor to a Custom Field
Enable Link Monitor to a Custom Field to automatically update a device's custom field value based on the data pushed to this monitor. This is useful for surfacing a dynamic, monitored value, such as a serial number or a status comment, directly on the device's custom field.
- Toggle on Link monitor to a custom field.
- Under Custom Fields, select an existing field from the list, or click Add New to create one.
- Click Add Monitor to save.
2. Enabling Lookup
This option maps incoming values to more meaningful labels using key-value pairs. Typically used with monitors that push numeric status codes, letting them display as readable text instead.
- Toggle on Enable Lookup.
- Under Value from device, enter the value the external system pushes to the monitor.
- Under Description, enter the label this value should map to.
- Click + to add additional value-to-label mappings.
- Click Add Monitor to save.
3. Enabling Threshold
Configure alerts based on the data pushed to this monitor. Ingested data is evaluated against these thresholds the same way as protocol-collected data, and alarms are raised when a threshold is breached.
- Toggle on Enable Threshold.
- Optionally, select Enable Adaptive Threshold to have OpManager dynamically adjust threshold values using its ML-based predictive algorithms, instead of using fixed values. Adaptive Thresholds require a minimum of 14 days of ingested data to establish a pattern before forecast values are applied. Refer to Adaptive Thresholds in OpManager for details on how this works and how to configure deviation values.
- Under Threshold details, set the condition and value for each severity level: Attention, Trouble, and Critical, along with the Rearm value that clears the alarm.
- Set Consecutive times to specify how many consecutive threshold breaches must occur before an alarm is raised.
- Click Add Monitor to save.
After a Data Ingestion monitor is created and associated with a device, an external system or application sends data to it over HTTP/REST. See Ingesting Data via REST API for the endpoint and request details.
Associating a Data Ingestion Monitor
Data Ingestion monitor can be associated with devices and device templates the same way as any other performance monitor in OpManager.
Via Device Template
- Go to Settings → Configuration → Device Templates.
- Select the relevant template from the list.
- Under the Monitors column, click Add.
- Locate the Data Ingestion monitor from the list and select it.
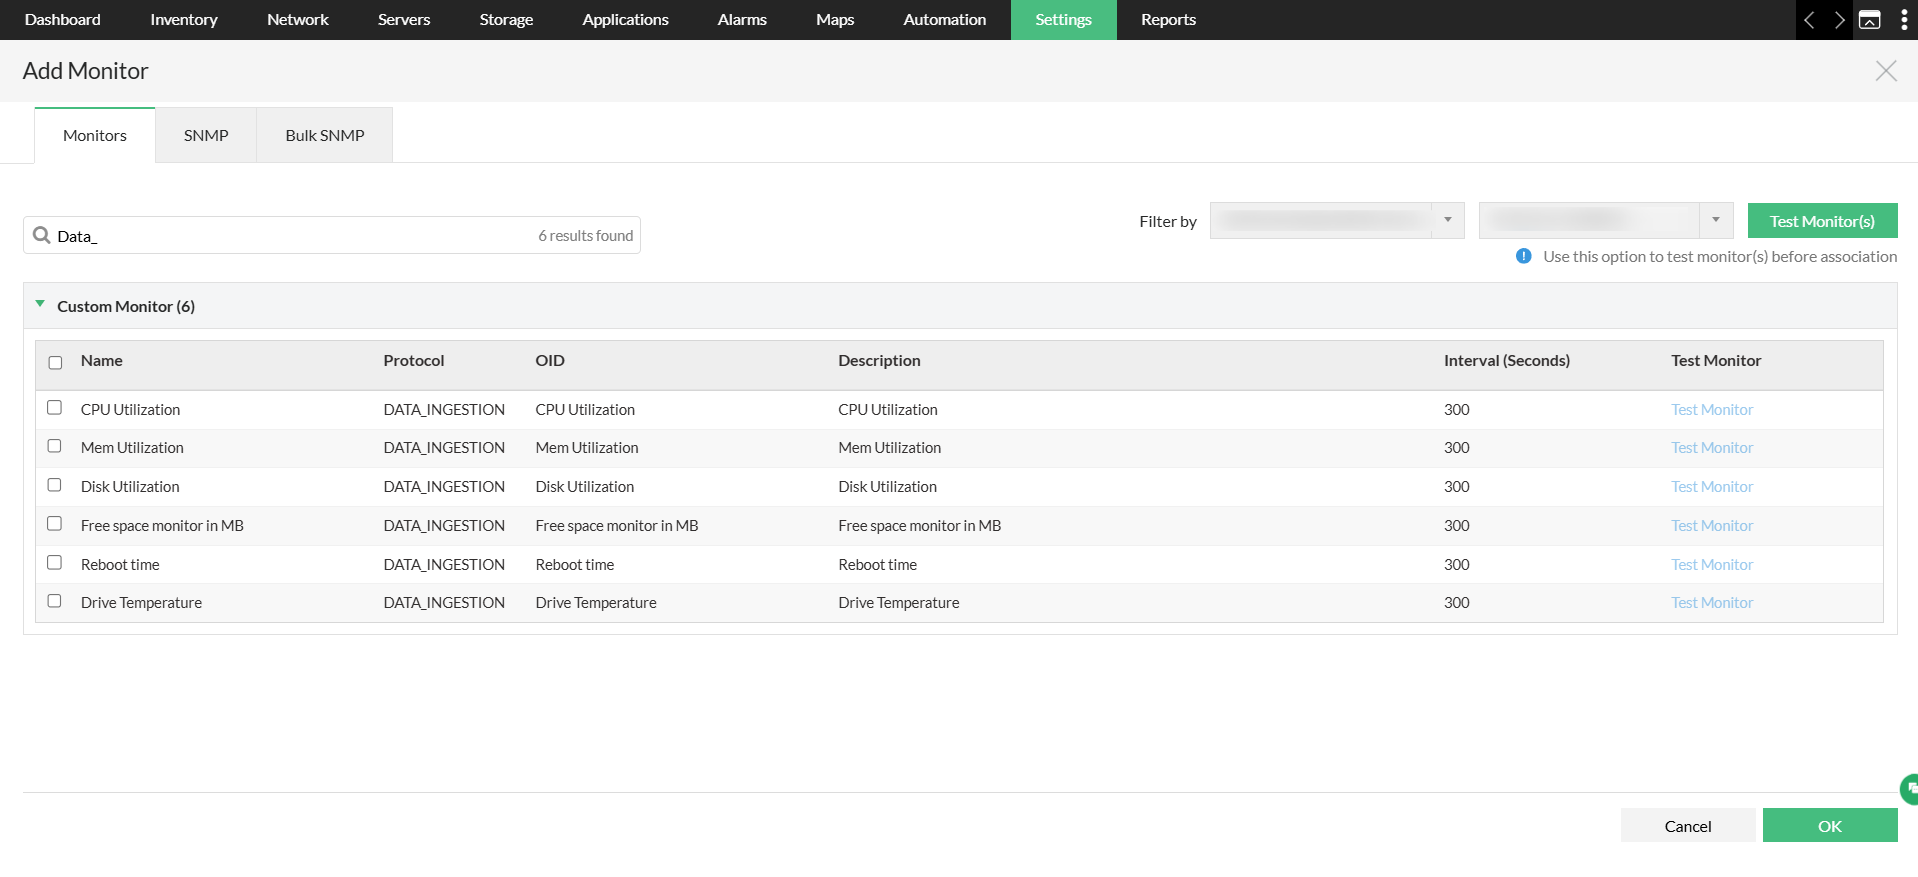
- Click Save and Associate to apply it to all devices mapped to that template.
Via Device Snapshot Page
- Navigate to the device's Snapshot page.
- Open the Monitors tab and click the Actions dropdown.
- Select Add Performance Monitors.
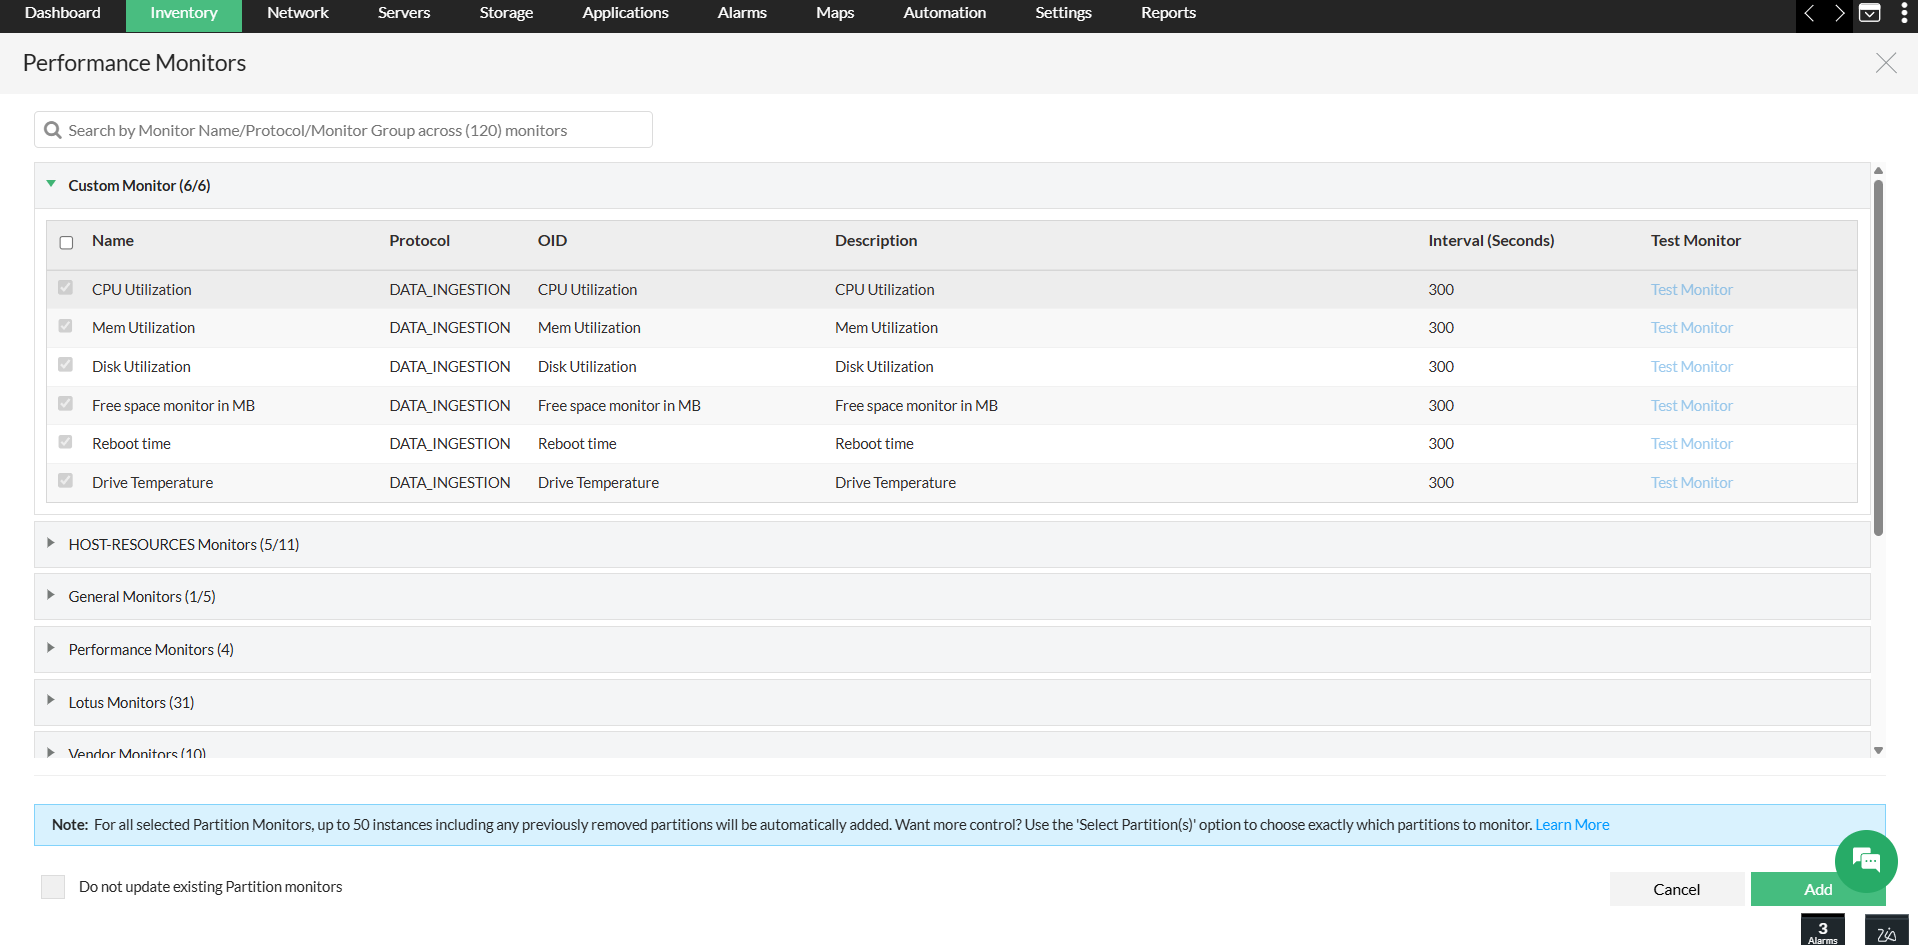
- Select the DATA_INGESTION monitor and click Add.
Ingesting Data via REST API
Use an external tool to push data to an associated monitor through the ingestMonitorData REST API.
Send a POST request to the following endpoint:
https://<server>:<port>/api/json/admin/ingestMonitorData- apiKey: The OpManager REST API key used to authenticate the request.
- deviceName: The internal name of the device the monitor is associated with.
- monitorName: The name of the Data Ingestion monitor.
- isInstance: Set to
falsefor a single value, ortruefor a monitor with multiple instances. - data: The value to ingest. For instance monitors, pass a JSON object with instance names as keys and their readings as values.
Note: Data Ingestion monitors have a default polling interval of 5 minutes, so scheduling the script at the same interval keeps the data in step with the monitor.
Refer to ingestMonitorData for the complete parameter list, data type handling, error codes, and rate limits.
Viewing Ingested Data
When an external system or application begins pushing data into a Data Ingestion monitor over REST API, the received metrics are available across three views in OpManager: Reports, Dashboard, and the device's Snapshot page. Each view serves a different purpose — use Reports for historical analysis, Dashboards for at-a-glance visibility, and Graphs for per-device metric detail.
1. From Reports
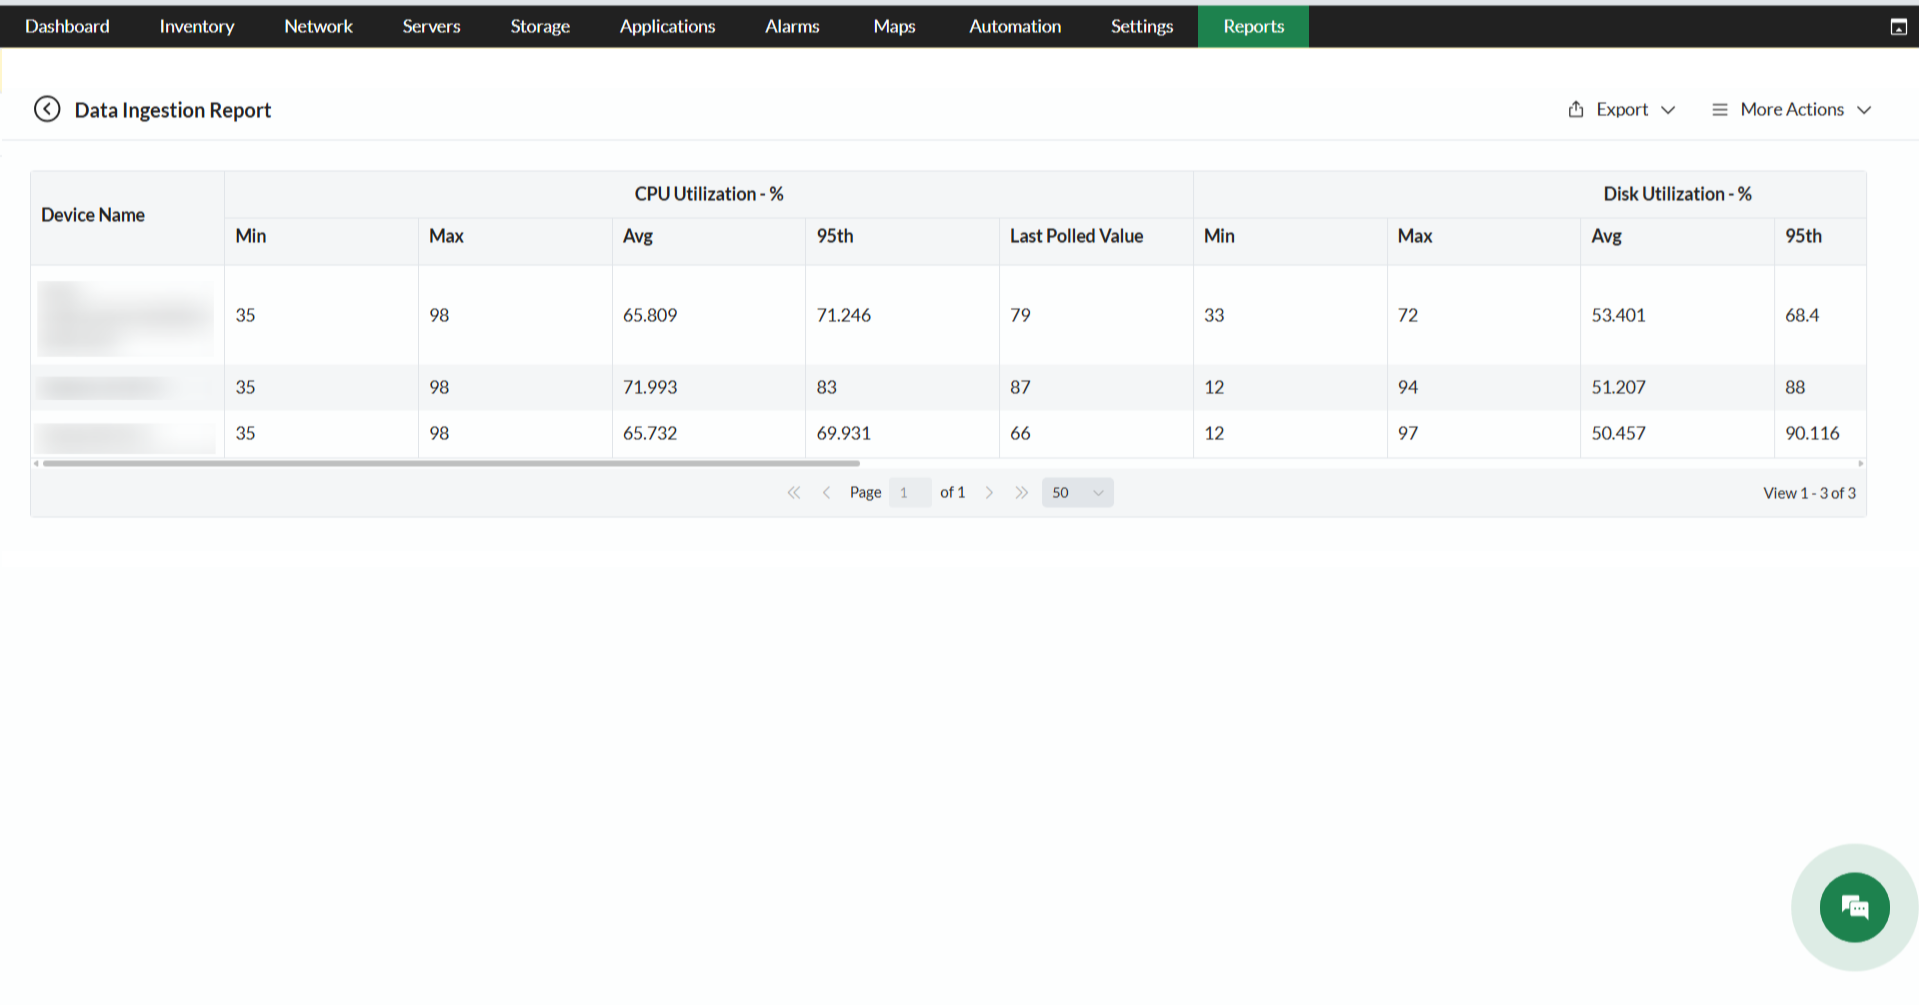
OpManager provides Default Reports and Advanced Reports for performance monitors, which include Data Ingestion monitors. These reports offer visibility into the values received over time, across devices and monitor instances.
To access these reports, navigate to Reports → Monitoring → Advanced Reports and filter by the relevant device or monitor name.
2. From Dashboard
Ingested metric data can be visualized directly on a dashboard using custom performance widgets.
- Navigate to Dashboard → Custom Dashboard, or create a new custom dashboard.
- Click Add Widget, and under the Health and Performance category, select the relevant performance widget type.
- Configure the widget to target the Data Ingestion monitor and the specific metric of interest.
- Add the widget to the dashboard. Hover on the widget to access the Edit option to filter by Category, Group, Monitor, Metric, Time Period, and Time Window.
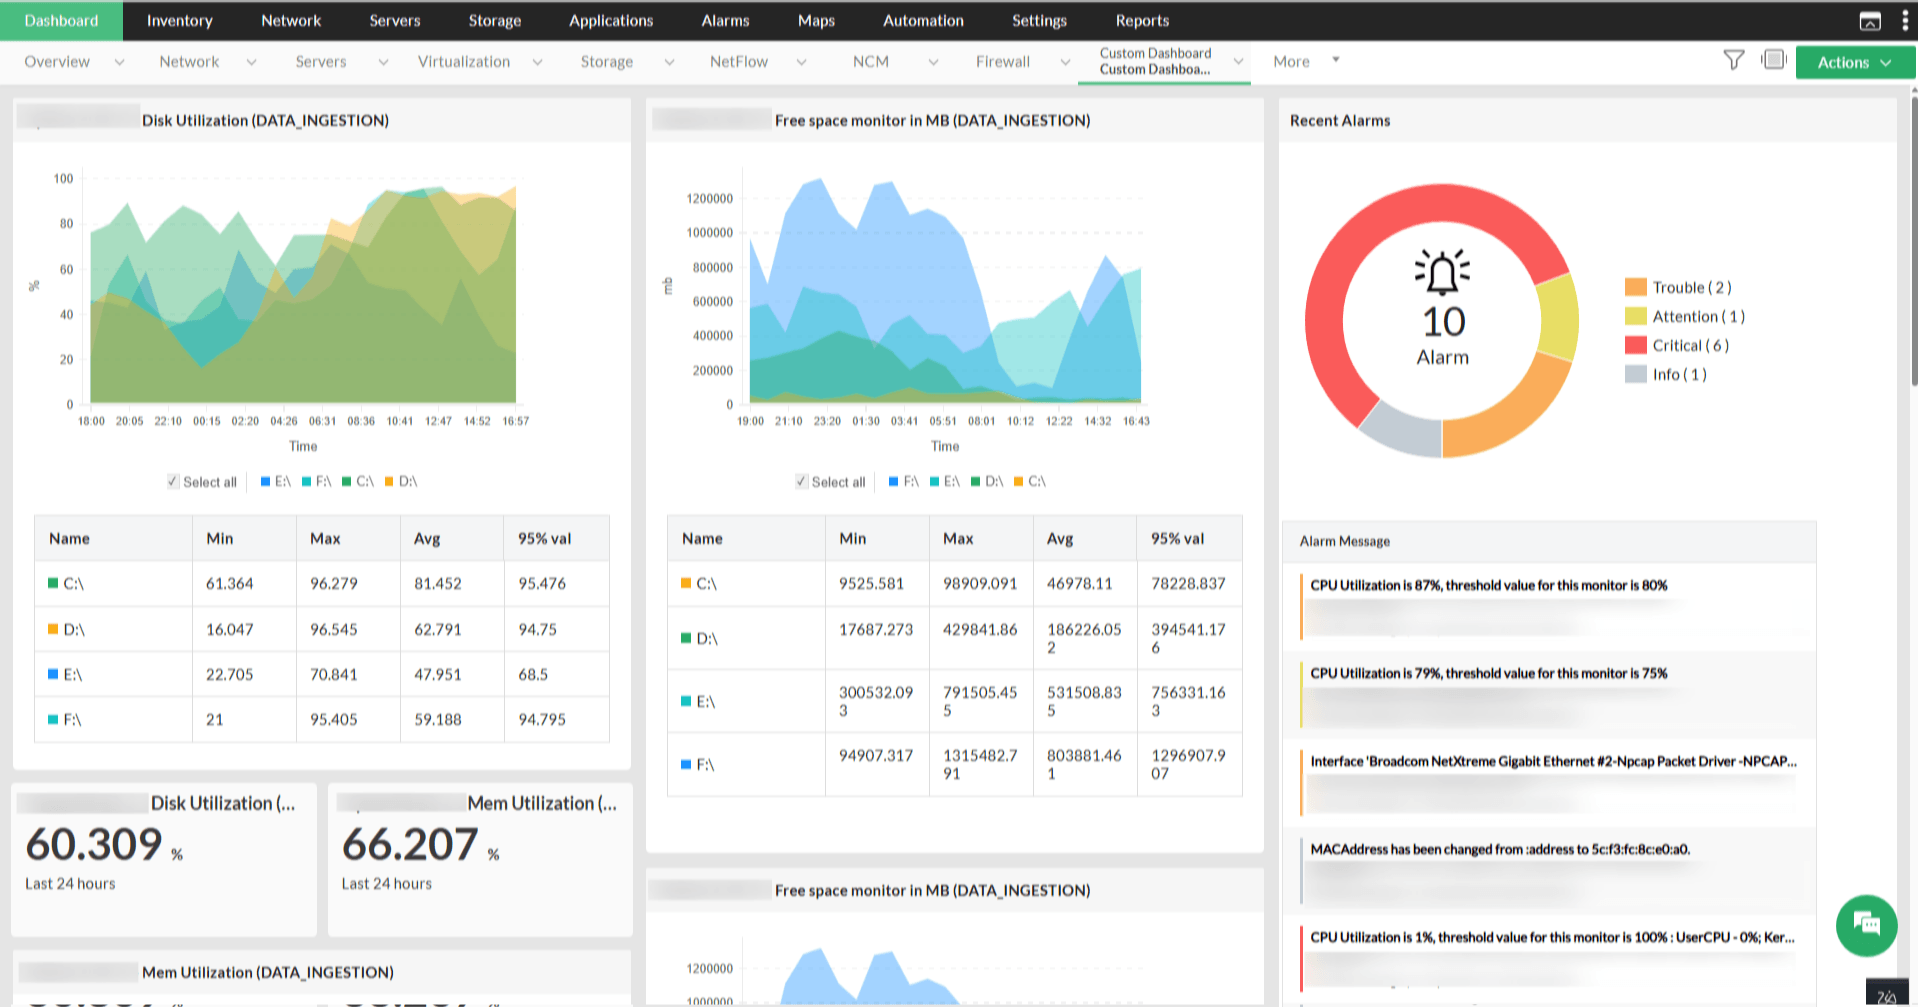
The widgets displays ingested metric values over time, allowing administrators to track data pushed from external systems alongside natively collected metrics.
3. From Device Snapshot Page
With a Data Ingestion monitor configured and data pushed via the REST API, navigate to the device's Snapshot page and click Monitors. Select the monitor name to open its detailed graph view.
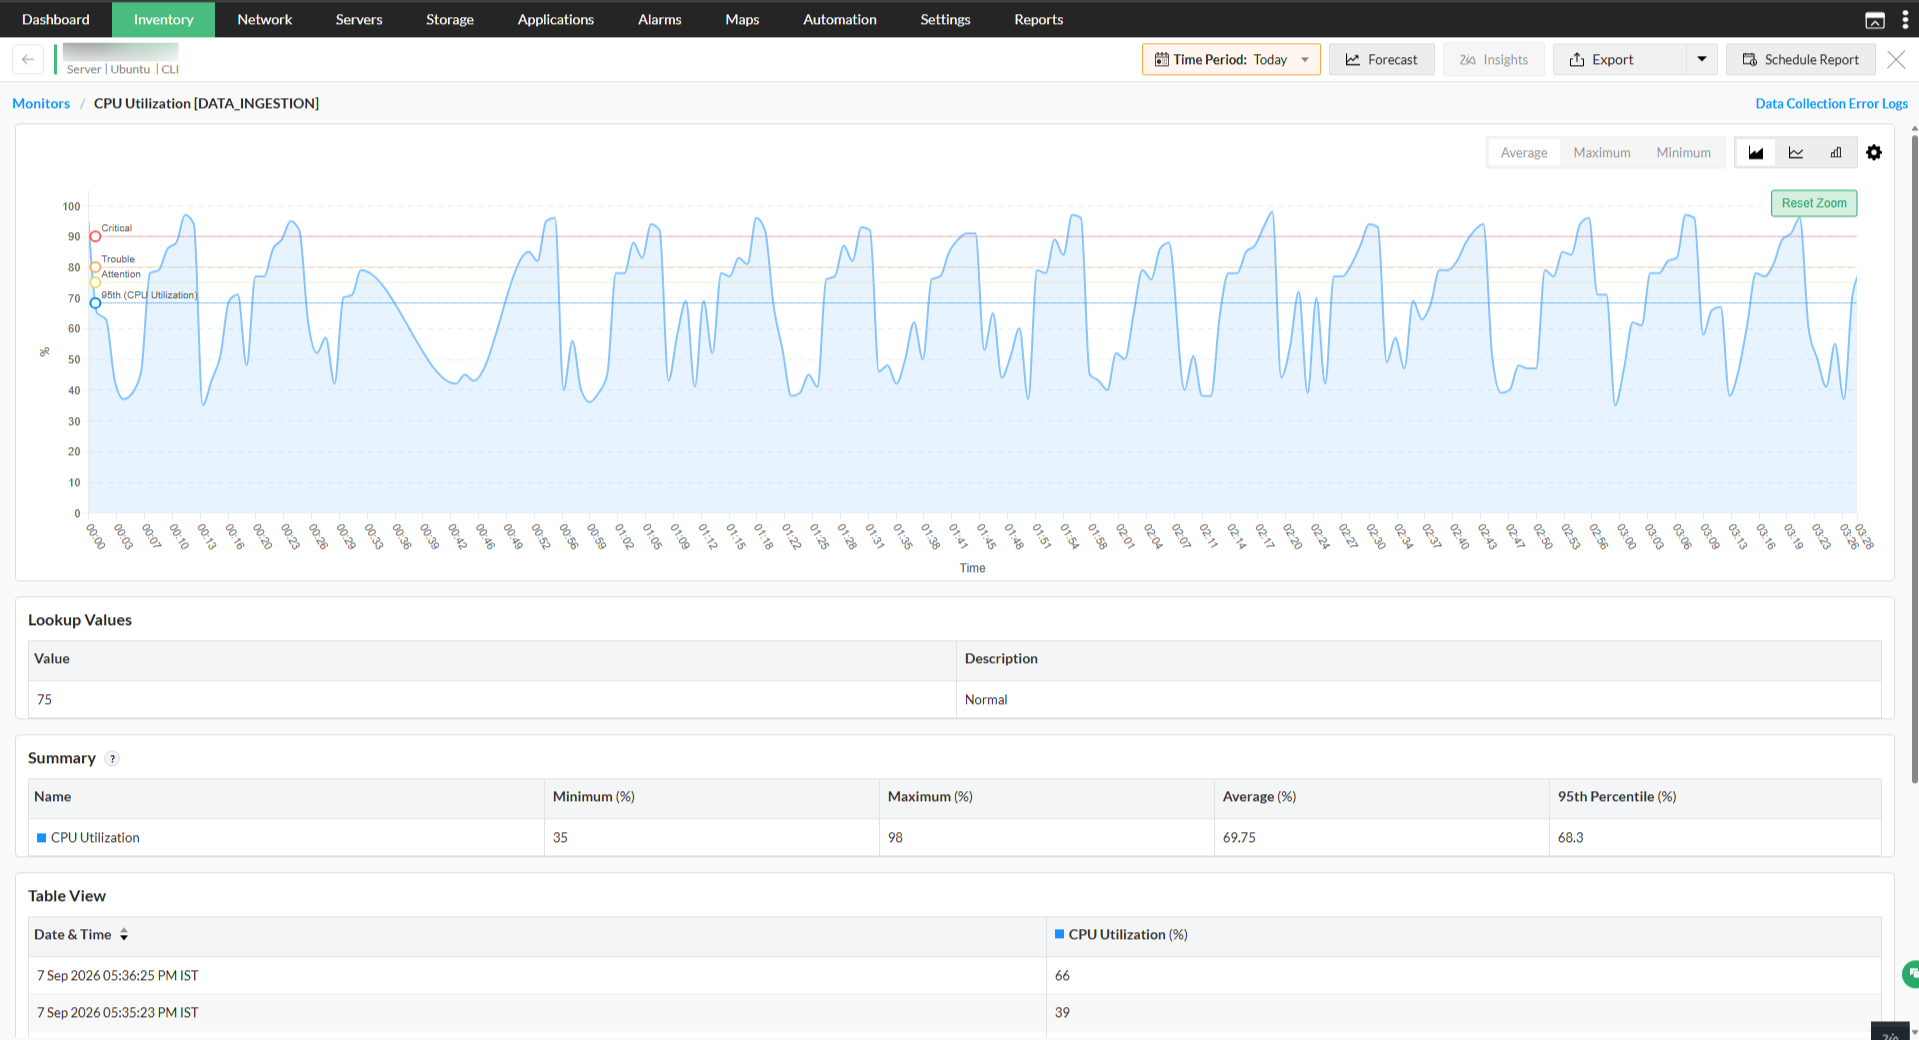
The graph plots ingested values over time and overlays configured threshold lines (Critical, Trouble, and Attention). Use the Time Period dropdown at the top right to change the reporting window, and switch between Average, Maximum, and Minimum views using the controls above the graph. Below the graph, the Lookup Values table maps raw numeric values to their corresponding status descriptions as defined in the monitor configuration.
Data Ingestion monitors extend OpManager's monitoring coverage to any system or application capable of making an HTTP call. By accepting data pushed over REST API, they remove the dependency on built-in protocols — making it possible to monitor custom applications, cloud services, and third-party tools from the same console as the rest of your infrastructure.