Health and Performance Reports
Health and Performance Reports in OpManager help enterprises monitor the well-being and operational efficiency of their entire infrastructure—servers, routers, switches, and more. These reports identify critical usage patterns, bottlenecks, and resource anomalies, empowering IT teams to proactively prevent downtime, optimize capacity, and maintain service reliability.
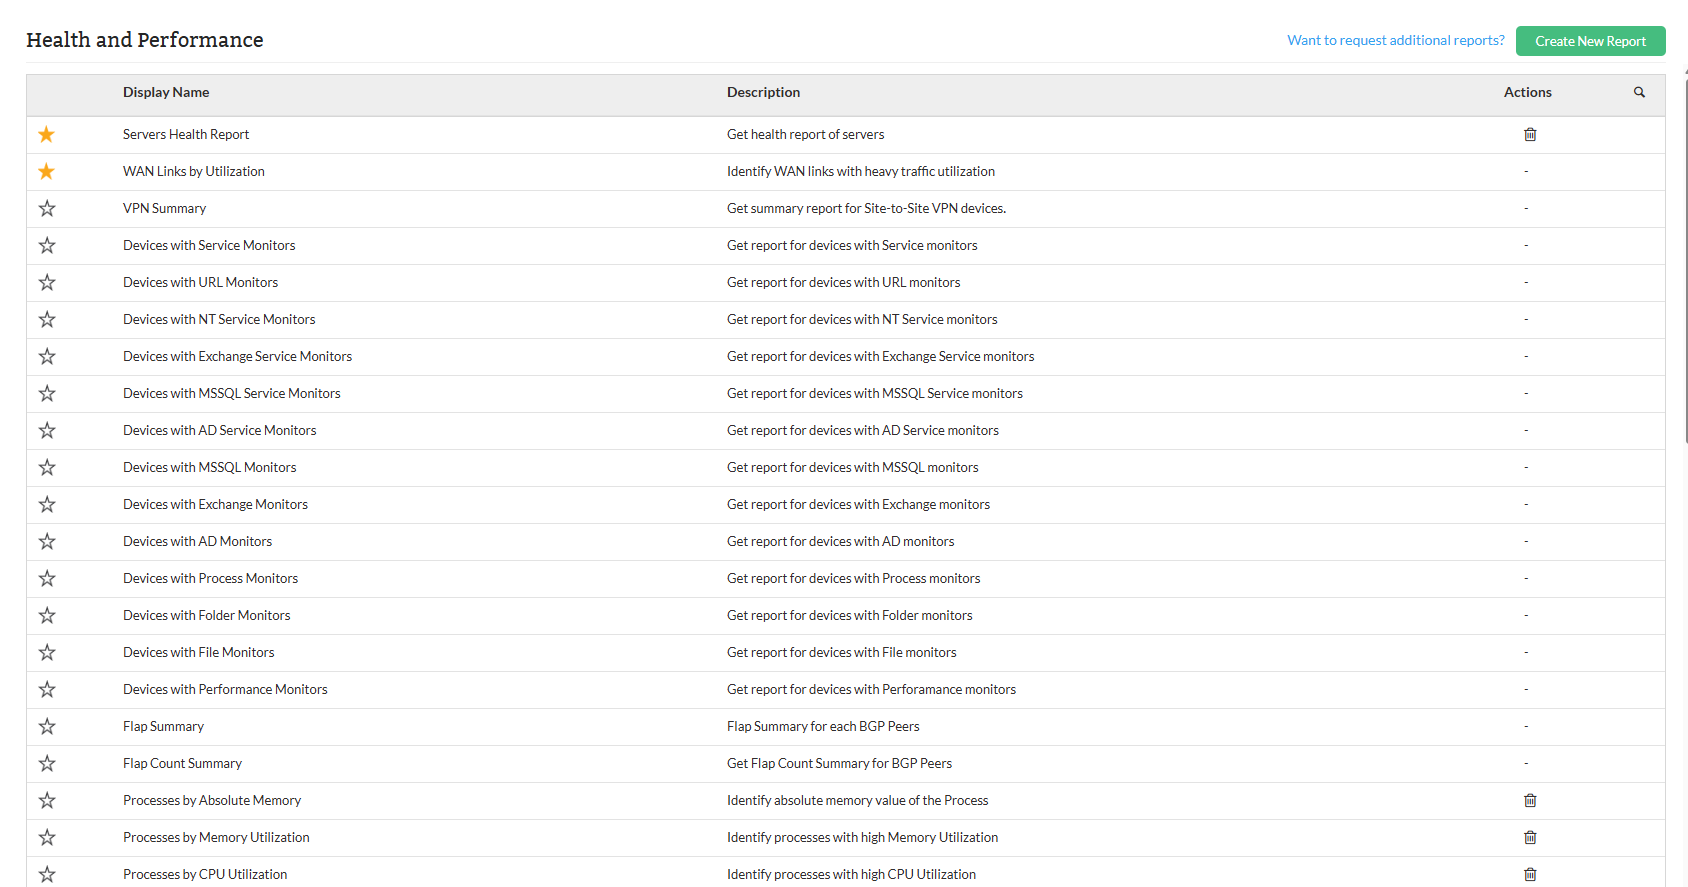
To access Health and Performance reports, Go to Reports → Health and Performance Reports
Types of Health and Performance reports
| Report Name | Description | Available Columns | Available Filters |
|---|---|---|---|
| WAN Links by Utilization | This report captures bandwidth utilization, ping response, and CPU usage statistics for WAN interfaces across various network devices over a selected period. It helps identify links with high usage or potential performance bottlenecks, supporting capacity planning and network troubleshooting. | Device Name, Interface Name, Bandwidth in bps (Avg In, Avg Out, Work Avg In, Work Avg Out, Max In, Max Out), Ping Response (Average, Maximum), CPU Usage (Average, Maximum) | Category,Filter by devices, or business views or groups devices, Period, Time Window / Business Hour, View Records |
| VPN Summary | The VPN Summary report provides a concise view of the status of VPN connections across different devices. It allows administrators to assess whether VPN tunnels are clear, monitor the number of tunnels and interfaces associated with each device, and evaluate device types and their IP addresses. | Device Name, Status, IP Address, Device Type, Tunnels, Interfaces | Filter by |
| Devices with Service Monitors | Provides information on devices being monitored along with the services being checked to track service status across devices. | Device Name, IP Address, Type, Monitor Name | Category,Filter by devices, or business views or groups |
| Devices with URL Monitors | Details about the URLs being monitored on devices, tracking the status of critical URLs for accessibility. | Device Name, IP Address, Type, Monitor Name, URL | Category,Filter by devices, or business views or groups |
| Devices with NT Service Monitors | Provides information on Windows-based devices monitored for NT services to ensure critical services are running. | Device Name, IP Address, Type, Monitor Name | Category,Filter by devices, or business views or groups |
| Devices with Exchange Service Monitors | Details about devices monitored for Microsoft Exchange services to ensure essential components function correctly. | Device Name, IP Address, Type, Monitor Name | Category,Filter by devices, or business views or groups |
| Devices with MSSQL Service Monitors | Displays devices monitored for Microsoft SQL Server services, helping track SQL service availability and performance. | Device Name, IP Address, Type, Monitor Name | Category,Filter by devices, or business views or groups |
| Devices with AD Service Monitors | Lists devices monitored for Active Directory-related services, ensuring domain services are operational. | Device Name, IP Address, Type, Monitor Name | Category,Filter by devices, or business views or groups |
| Devices with MSSQL Monitors | Insights into devices monitored for Microsoft SQL Server performance metrics such as memory and transaction rates. | Device Name, IP Address, Type, Monitor Name, Protocol | Category,Filter by devices, or business views or groups |
| Devices with Exchange Monitors | Lists devices monitored for Exchange performance metrics including error rates and connection counts via WMI. | Device Name, IP Address, Type, Monitor Name, Protocol | Category,Filter by devices, or business views or groups |
| Devices with AD Monitors | Performance data for domain controllers monitoring AD operations such as replication and binding via WMI. | Device Name, IP Address, Type, Monitor Name, Protocol | Category,Filter by devices, or business views or groups |
| Devices with Process Monitors | Lists systems monitored for specific processes across platforms to ensure critical process uptime. | Device Name, IP Address, Type, Monitor Name, Protocol | Category,Filter by devices, or business views or groups |
| Devices with Folder Monitors | Lists devices monitored for folder availability or changes, ensuring critical directories function correctly. | Device Name, IP Address, Type, Monitor Name, Folder Monitors, Protocol | Category,Filter by devices, or business views or groups |
| Devices with Performance Monitors | Lists devices monitored for various metrics like latency, packet loss, and uptime. | Device Name, IP Address, Type, Monitor Name, Protocol | Category,Filter by devices, or business views or groups |
| Flap Summary | Tracks device or peer disruptions, including start and end times, and total downtime. | Name, Peer Address, Start Time, End Time, Total Down Time | Filter by, Period, View Records |
| Flap Count Summary | Summarizes flapping events to identify unstable network links or devices. | Name, Peer Address, Flap Count, Total Down Time | Filter by, Period, View Records |
| Processes by Absolute Memory | Shows memory usage details (Min, Max, Avg) across processes to identify high consumers. | Device Name, Name, Min, Max, Avg | Category,Filter by devices, or business views or groups, Period, Time Window / Business Hour, View Records |
| Processes by Memory Utilization | Shows memory usage percentage details (Min, Max, Avg) across processes to detect performance issues. | Device Name, Name, Min, Max, Avg | Category,Filter by devices, or business views or groups, Period, Time Window / Business Hour, View Records |
| Processes by CPU Utilization | Displays CPU usage of processes across devices to identify resource-heavy operations. | Device Name, Name, Min, Max, Avg | Category,Filter by devices, or business views or groups, Period, Time Window / Business Hour, View Records |
| Hardware Health Report | Overview of hardware component health, focusing on fan RPM and related metrics. | Sensor Name, Value, Date and Time, Units | Category,Filter by devices, or business views or groups, Period |
| Interfaces By TotalBytes Transferred | Shows total data transferred across interfaces for bandwidth analysis. | Device Name, Interface Name, In, Out, Total Bytes | Category,Filter by devices, or business views or groups, Period, Time Window / Business Hour, View Records |
| Top N Errors And Discards | Highlights interfaces with the most errors or discarded packets for troubleshooting. | Device Name, Interface Name, Errors, Discards | Category,Filter by devices, or business views or groups, Period, Time Window / Business Hour, View Records |
| Volumes With High Disk Utilization | Lists volumes nearing capacity to aid in proactive disk space management. | Device Name, Partition, Used (%) | Category,Filter by devices, or business views or groups, View Records |
| Volumes With Low Disk Utilization | Highlights volumes with available storage that can be optimized or reassigned. | Device Name, Partition, Used (%) | Category,Filter by devices, or business views or groups, View Records |
| All Interfaces By Traffic | Provides traffic stats for all interfaces, showing speeds and bytes transmitted/received. | Device Name, Interface Name, In Speed, Receives (Bps), Out Speed, Transmits (Bps) | Category,Filter by devices, or business views or groups, Period, Time Window / Business Hour, View Records |
| DCs by Disk Utilization | Shows disk usage stats (Min, Max, Avg) for Domain Controllers. | Name, Min, Max, Avg % | Category,Filter by devices, or business views or groups, Period, Time Window / Business Hour, View Records |
| DCs by Memory Utilization | Displays memory usage statistics for Domain Controllers. | Name, Min, Max, Avg % | Category,Filter by devices, or business views or groups, Period, Time Window / Business Hour, View Records |
| DCs by CPU Utilization | Tracks CPU usage metrics for Domain Controllers to ensure performance health. | Name, Min, Max, Avg % | Category,Filter by devices, or business views or groups, Period, Time Window / Business Hour, View Records |
| Ports by Tx Utilization | Monitors port Tx utilization to identify links under heavy outbound traffic. | Device Name, Interface Name, Min, Max, Avg, 95th PercVal (%) | Category,Filter by devices, or business views or groups, Period, Time Window / Business Hour, View Records |
| Ports by Rx Utilization | Shows inbound utilization to detect overloaded input ports. | Device Name, Interface Name, Min, Max, Avg, 95th PercVal (%) | Category,Filter by devices, or business views or groups, Period, Time Window / Business Hour, View Records |
| Ports by Tx Errors | Tracks transmission errors to spot misconfigured or failing interfaces. | Device Name, Interface Name, Min, Max, Avg, 95th PercVal (%) | Category,Filter by devices, or business views or groups, Period, Time Window / Business Hour, View Records |
| Ports by Rx Errors | Highlights reception error rates that may indicate physical or configuration issues. | Device Name, Interface Name, Min, Max, Avg, 95th PercVal (%) | Category,Filter by devices, or business views or groups, Period, Time Window / Business Hour, View Records |
| Ports by Tx Traffic | Identifies ports transmitting the most outbound traffic to assess usage. | Device Name, Interface Name, Min, Max, Avg, 95th PercVal (%) | Category,Filter by devices, or business views or groups, Period, Time Window / Business Hour, View Records |
| Ports by Rx Traffic | Lists ports with highest inbound traffic to detect core or congested links. | Device Name, Interface Name, Min, Max, Avg, 95th PercVal (%) | Category,Filter by devices, or business views or groups, Period, Time Window / Business Hour, View Records |
| Switches Health Report | Graphical summary of switch health metrics including response time and utilization. | Availability, Packet Loss, Response Time, Backplane Utilization, CPU Utilization, Memory Utilization | Category,Filter by devices, or business views or groups, Period, Time Window / Business Hour, Monitors |
| Router Interfaces by Tx Utilization | Shows Tx metrics on router interfaces to monitor bandwidth usage. | Device Name, Interface Name, Min, Max, Avg, 95th PercVal (%) | Category,Filter by devices, or business views or groups, Period, Time Window / Business Hour, View Records |
| Router Interfaces by Rx Utilization | Displays Rx stats to track inbound traffic on router interfaces. | Device Name, Interface Name, Min, Max, Avg, 95th PercVal (%) | Category,Filter by devices, or business views or groups, Period, Time Window / Business Hour, View Records |
| Router Interfaces by Tx Errors | This report provides a detailed view of transmission (Tx) errors across various router interfaces, helping to monitor and assess the number of errors occurring during data transmission. It includes key metrics such as minimum, maximum, average, and the 95th percentile of errors measured in packets per second. Monitoring Tx errors is essential for diagnosing network issues and ensuring stable data transmission. | Device Name, Interface Name, Min, Max, Avg, 95th PercVal (%) | Category,Filter by devices, or business views or groups, Period, Time Window / Business Hour, View Records |
| Router Interfaces by Rx Errors | This report provides a detailed view of reception (Rx) errors across various router interfaces, helping to monitor and assess the number of errors occurring while receiving data. It includes key metrics such as minimum, maximum, average, and the 95th percentile of errors measured in packets per second. Monitoring Rx errors is essential for identifying network issues and ensuring the integrity of incoming data. | Device Name, Interface Name, Min, Max, Avg, 95th PercVal (%) | Category,Filter by devices, or business views or groups, Period, Time Window / Business Hour, View Records |
| Router Interfaces by Tx Traffic | This report provides a comprehensive overview of the outgoing (Tx) traffic on router interfaces. It helps in evaluating how much data is being transmitted over time and identifying traffic patterns or potential congestion points. The report includes minimum, maximum, average, and 95th percentile values of traffic measured in bits per second (bps), offering valuable insight into bandwidth usage. | Device Name, Interface Name, Min, Max, Avg, 95th PercVal (%) | Category,Filter by devices, or business views or groups, Period, Time Window / Business Hour, View Records |
| Router Interfaces by Rx Traffic | This report provides a comprehensive overview of the incoming (Rx) traffic on router interfaces. It is useful for analyzing how much data is being received over time and for identifying bandwidth usage trends or potential performance issues. The report includes minimum, maximum, average, and 95th percentile values of traffic measured in bits per second (bps), offering insight into inbound network load. | Device Name, Interface Name, Min, Max, Avg, 95th PercVal (%) | Category,Filter by devices, or business views or groups, Period, Time Window / Business Hour, View Records |
| Routers by Memory Utilization | This report displays memory utilization statistics for routers, enabling monitoring of memory usage trends across devices. It helps in identifying devices with consistently high memory consumption, which could impact performance or indicate potential issues. The report includes minimum, maximum, and average memory utilization percentages over the monitoring period. | Name, Min, Max, Avg % | Category,Filter by devices, or business views or groups, Period, Time Window / Business Hour, View Records |
| Routers by CPU Utilization | This report displays CPU utilization statistics for routers, assisting in tracking processor load across network devices. It is useful for identifying routers that may be overutilized or under stress, which can affect performance and reliability. The report includes minimum, maximum, and average CPU utilization percentages over the monitoring period. | Name, Min, Max, Avg % | Category,Filter by devices, or business views or groups, Period, Time Window / Business Hour, View Records |
| Routers Health Report | This report presents the operational health and performance of routers over a selected period. It tracks key metrics like availability, temperature, packet loss, response time, and resource utilization, helping ensure optimal router performance and quick identification of issues. | Availability, Temperature, Packet Loss, Response Time, CPU Utilization, Memory Utilization | Category,Filter by devices, or business views or groups, Period, Time Window / Business Hour, Monitors |
| Servers by Tx Utilization | This report displays the transmission (Tx) utilization statistics of server interfaces. It helps in identifying bandwidth usage trends and potential network bottlenecks by showing how much data is being transmitted across server interfaces. Useful for capacity planning and traffic analysis. | Device Name, Interface Name, Min (%), Max (%), Avg (%), 95th Percentile Value (%) | Category,Filter by devices, or business views or groups, Period, Time Window / Business Hour, View Records |
| Servers by Rx Utilization | This report provides insights into the receive (Rx) utilization across various server interfaces. It is essential for monitoring incoming network traffic and detecting potential overutilization or unusual traffic patterns. This data supports network capacity planning and helps ensure stable server performance. | Device Name, Interface Name, Min (%), Max (%), Avg (%), 95th Percentile Value (%) | Category,Filter by devices, or business views or groups, Period, Time Window / Business Hour, View Records |
| Servers by Tx Traffic | This report shows the volume of transmitted (Tx) network traffic across server interfaces, measured in bits per second (bps). It helps track how much data is being sent out from each server, which is useful for analyzing bandwidth consumption, identifying heavily loaded servers, and optimizing traffic distribution. | Device Name, Interface Name, Min (%), Max (%), Avg (%), 95th Percentile Value (%) | Category,Filter by devices, or business views or groups, Period, Time Window / Business Hour, View Records |
| Servers by Rx Traffic | This report presents the amount of received (Rx) network traffic across server interfaces, measured in bits per second (bps). It is useful for monitoring inbound data flow to servers, identifying traffic-heavy interfaces, and ensuring efficient handling of incoming network loads. | Device Name, Interface Name, Min (%), Max (%), Avg (%), 95th Percentile Value (%) | Category,Filter by devices, or business views or groups, Period, Time Window / Business Hour, View Records |
| Servers by Rx Utilization | This report provides insights into the receive (Rx) utilization across various server interfaces. It is essential for monitoring incoming network traffic and detecting potential overutilization or unusual traffic patterns. This data supports network capacity planning and helps ensure stable server performance. | Device Name, Interface Name, Min (%), Max (%), Avg (%), 95th Percentile Value (%) | Category,Filter by devices, or business views or groups, Period, Time Window / Business Hour, View Records |
| Servers by Disk Utilization | This report summarizes disk usage across servers by showing the percentage of disk space utilized over time. It helps identify servers nearing capacity, ensuring proactive storage management and preventing potential service disruptions due to full disks. | Name, Min (%), Max (%), Avg (%) | Category,Filter by devices, or business views or groups, Period, Time Window / Business Hour, View Records |
| Servers by Memory Utilization | This report provides an overview of memory usage across servers. It highlights the minimum, maximum, and average memory utilization, allowing administrators to monitor memory consumption trends and avoid server performance issues due to insufficient memory. | Name, Min (%), Max (%), Avg (%) | Category,Filter by devices, or business views or groups, Period, Time Window / Business Hour, View Records |
| Servers by CPU Utilization | This report displays CPU utilization metrics for each server, including the minimum, maximum, and average CPU usage. It helps identify overutilized servers, allowing for performance tuning and ensuring that CPU resources are optimally allocated to prevent slowdowns. | Name, Min (%), Max (%), Avg (%) | Category,Filter by devices, or business views or groups, Period, Time Window / Business Hour, View Records |
| Interfaces by Tx Errors | This report highlights the transmission (Tx) errors occurring across various interfaces. It helps network administrators monitor the frequency of packet errors and detect issues that may affect data transmission quality or network stability. This data can assist in identifying problematic interfaces and optimizing network performance. | Device Name, Interface Name, Min (packets per sec), Max (packets per sec), Avg (packets per sec), 95th Percentile Value (packets per sec) | Category,Filter by devices, or business views or groups, Period, Time Window / Business Hour, View Records |
| Interfaces by Rx Errors | This report tracks the reception (Rx) errors across various network interfaces. It provides insights into the errors occurring during data reception, which can indicate issues with the network hardware, signal integrity, or configuration problems. Monitoring Rx errors helps identify and resolve network connectivity issues. | Device Name, Interface Name, Min (errors per sec), Max (errors per sec), Avg (errors per sec), 95th Percentile Value (errors per sec) | Category,Filter by devices, or business views or groups, Period, Time Window / Business Hour, View Records |
| Interfaces by Tx Utilization | This report shows the transmission (Tx) utilization for various network interfaces. It helps track how much of the available bandwidth is being utilized by data transmissions. High utilization can indicate potential congestion or the need for bandwidth management. | Device Name, Interface Name, Min (%), Max (%), Avg (%), 95th Percentile Value (%) | Category,Filter by devices, or business views or groups, Period, Time Window / Business Hour, View Records |
| Interfaces by Rx Utilization | This report presents the reception (Rx) utilization across network interfaces. It provides insights into how much of the bandwidth is being used for incoming traffic, helping to identify bottlenecks and optimize network performance. | Device Name, Interface Name, Min (%), Max (%), Avg (%), 95th Percentile Value (%) | Category,Filter by devices, or business views or groups, Period, Time Window / Business Hour, View Records |
| Interfaces by Tx Traffic | This report tracks the volume of transmitted (Tx) network traffic across interfaces. It measures the data sent from each interface, allowing for the identification of high-traffic interfaces and enabling proactive traffic management. | Device Name, Interface Name, Min (bps), Max (bps), Avg (bps), 95th Percentile Value (bps) | Category,Filter by devices, or business views or groups, Period, Time Window / Business Hour, View Records |
| Interfaces by Rx Traffic | This report shows the volume of received (Rx) network traffic across interfaces. Monitoring incoming traffic helps detect over-utilized interfaces and ensures optimal network performance by managing inbound data flows. | Device Name, Interface Name, Min (bps), Max (bps), Avg (bps), 95th Percentile Value (bps) | Category,Filter by devices, or business views or groups, Period, Time Window / Business Hour, View Record |
To know more about the Available Filters in various reports of OpManager, Click here.