Integrating OpManager with Grafana
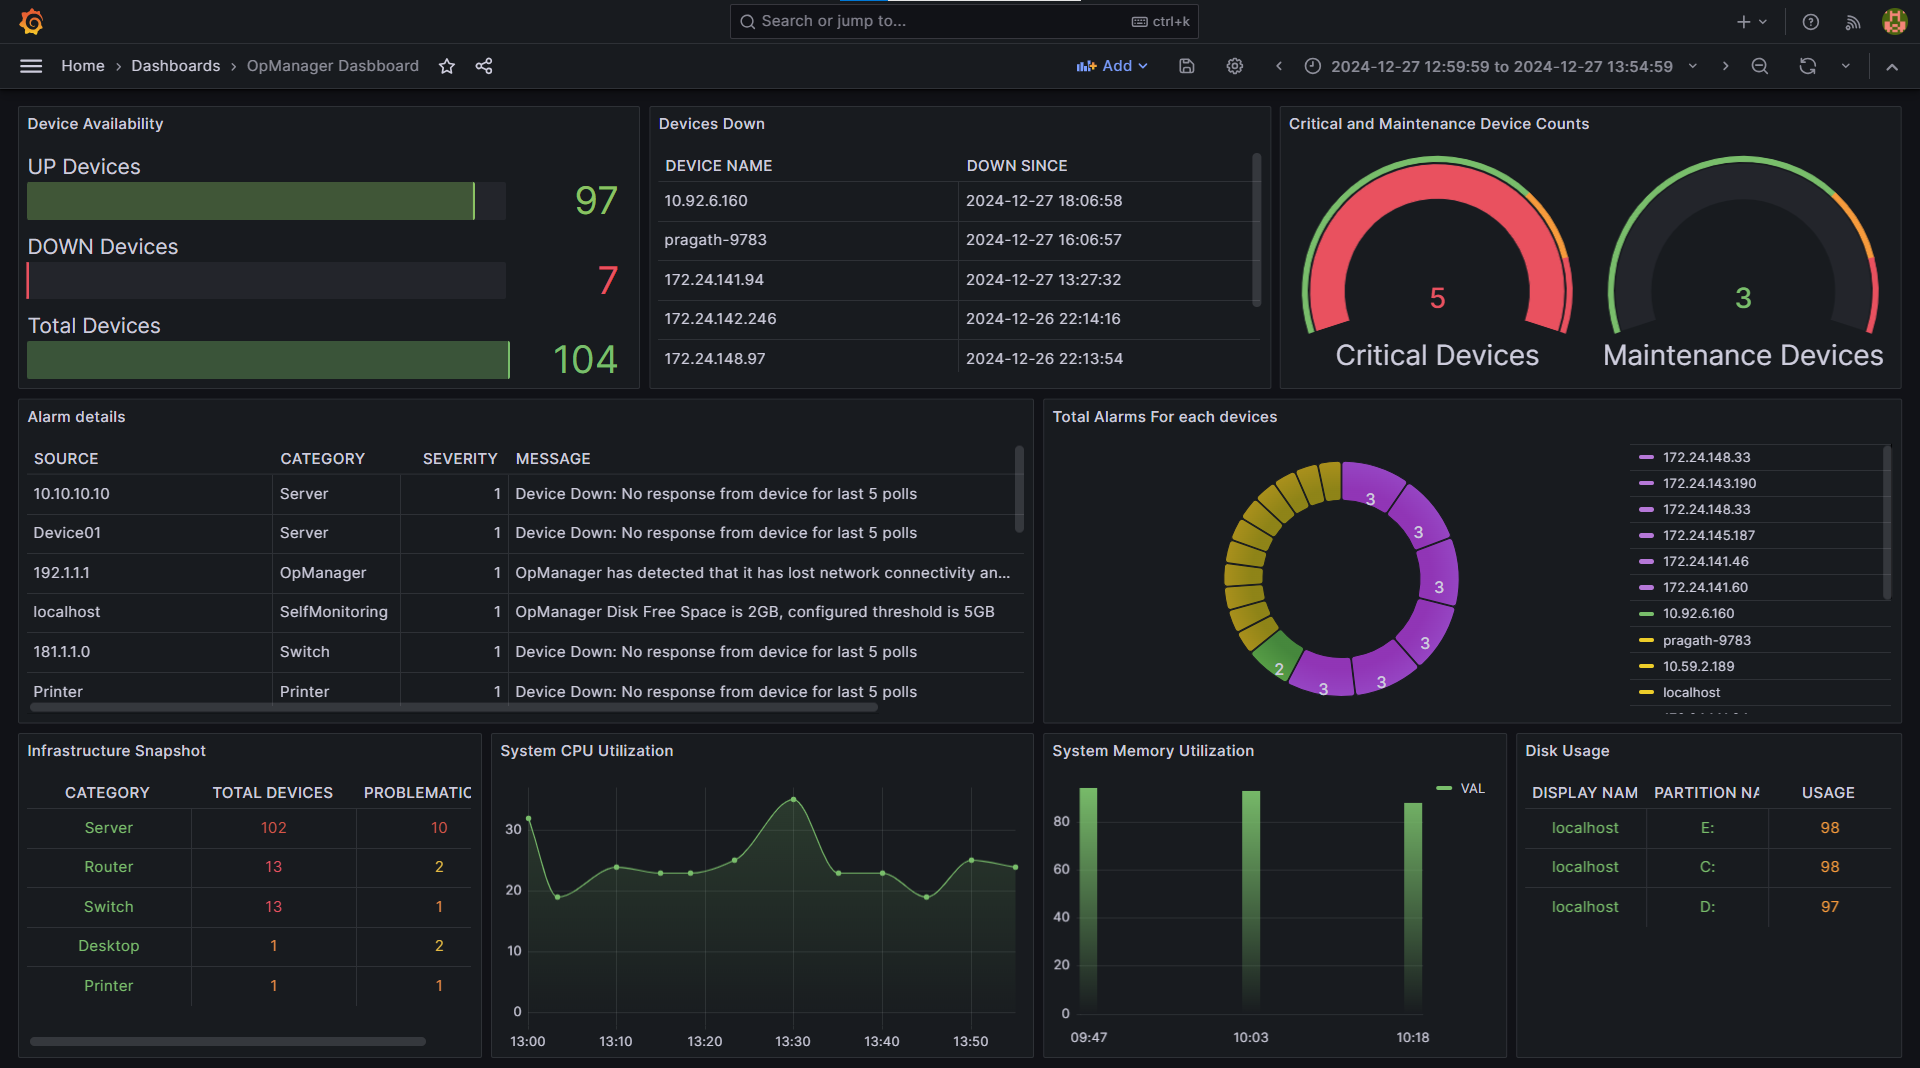
OpManager's integration with Grafana allows you to visualize and monitor OpManager data using Grafana's advanced dashboarding capabilities. This integration enables you to create interactive dashboards, track key performance metrics, and analyze trends in real time. The help document provides detailed instructions for setting up the integration and querying data from the OpManager into Grafana.
This help document covers the following topics:
Steps to connect OpManager to Grafana
Note:
- For integrating Grafana with the OpManager database, only MSSQL database are supported.
- Ensure that the MSSQL ROUser account is used for the integration.
To connect OpManager to grafana, login to grafana and open the dashboard,
- Click the left-hand menu to open the Connections section.
- Click on Data Sources.
- Click the Add new data source button.
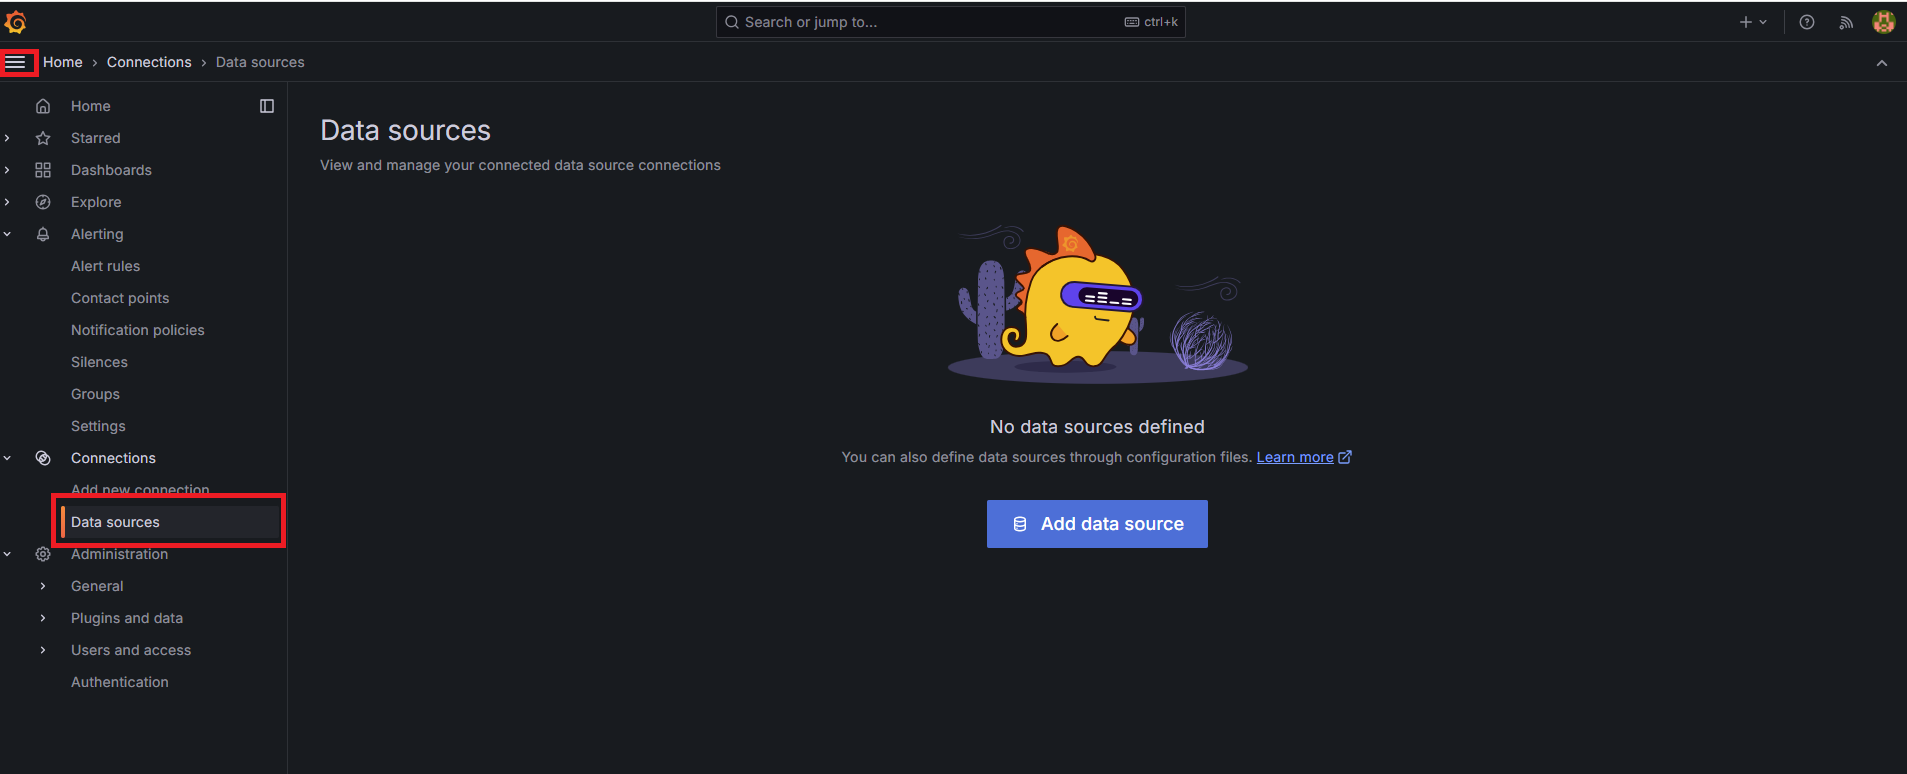
- In the list of available data sources, search for Microsoft SQL Server, and select it.

- Provide the following information to connect to your SQL Server database:
- Name: Enter a name for this data source (e.g., MSSQL_DB).
- Host: Input the server address and port. By default, SQL Server uses port 1433. For example: mssql-server1.sample.com:1433.
- Database: Specify the name of the database you want to connect to (e.g., my_database).
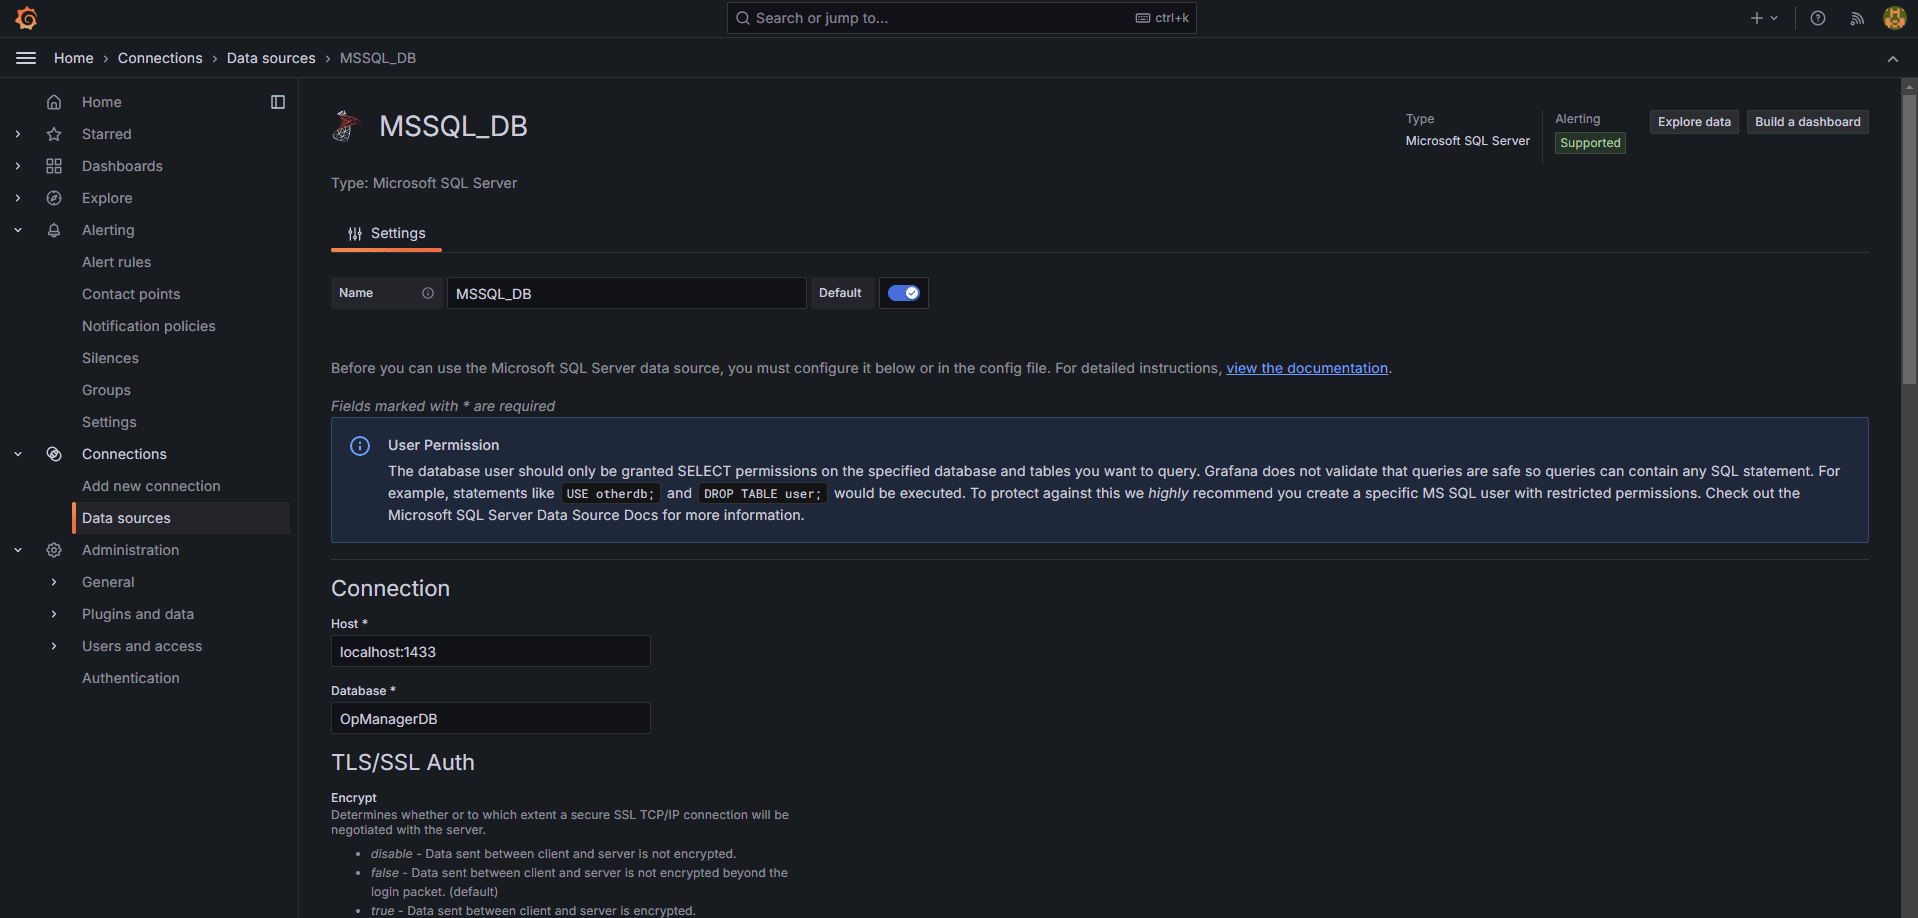
- User: Enter your SQL Server username.
- Password: Provide the password associated with the username.
Authentication: Choose the appropriate authentication method:
- Windows Authentication: If you are using domain-based credentials and your SQL Server is configured for this.
- SQL Server Authentication: If you are logging in with a SQL Server account.
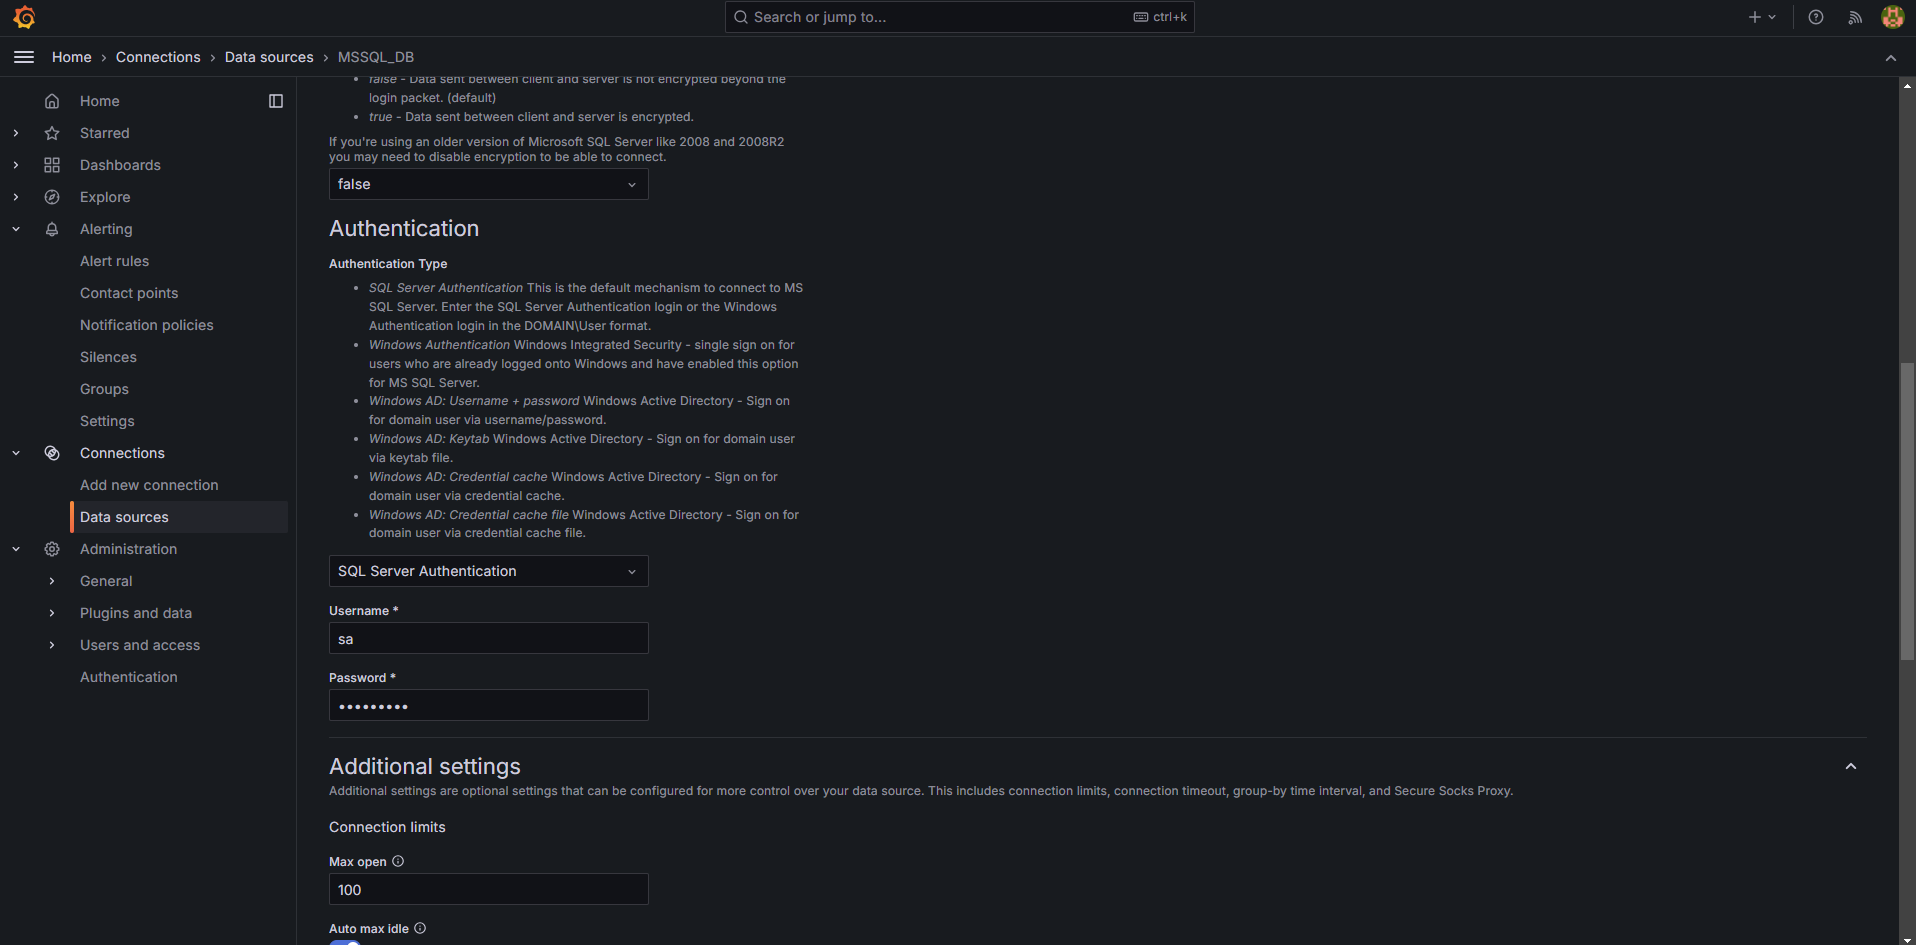
- TLS/SSL Settings: Configure these settings if your server requires a secure connection.
Example Configuration for SQL Server Authentication
- Host: mssql-server1.sample.com:1433
- Database: my_database
- User: sa
- Password: your_password
- After entering the connection details, click the Test & Save button.
- If the connection is successful, you will see a 'Data Connection OK' message.
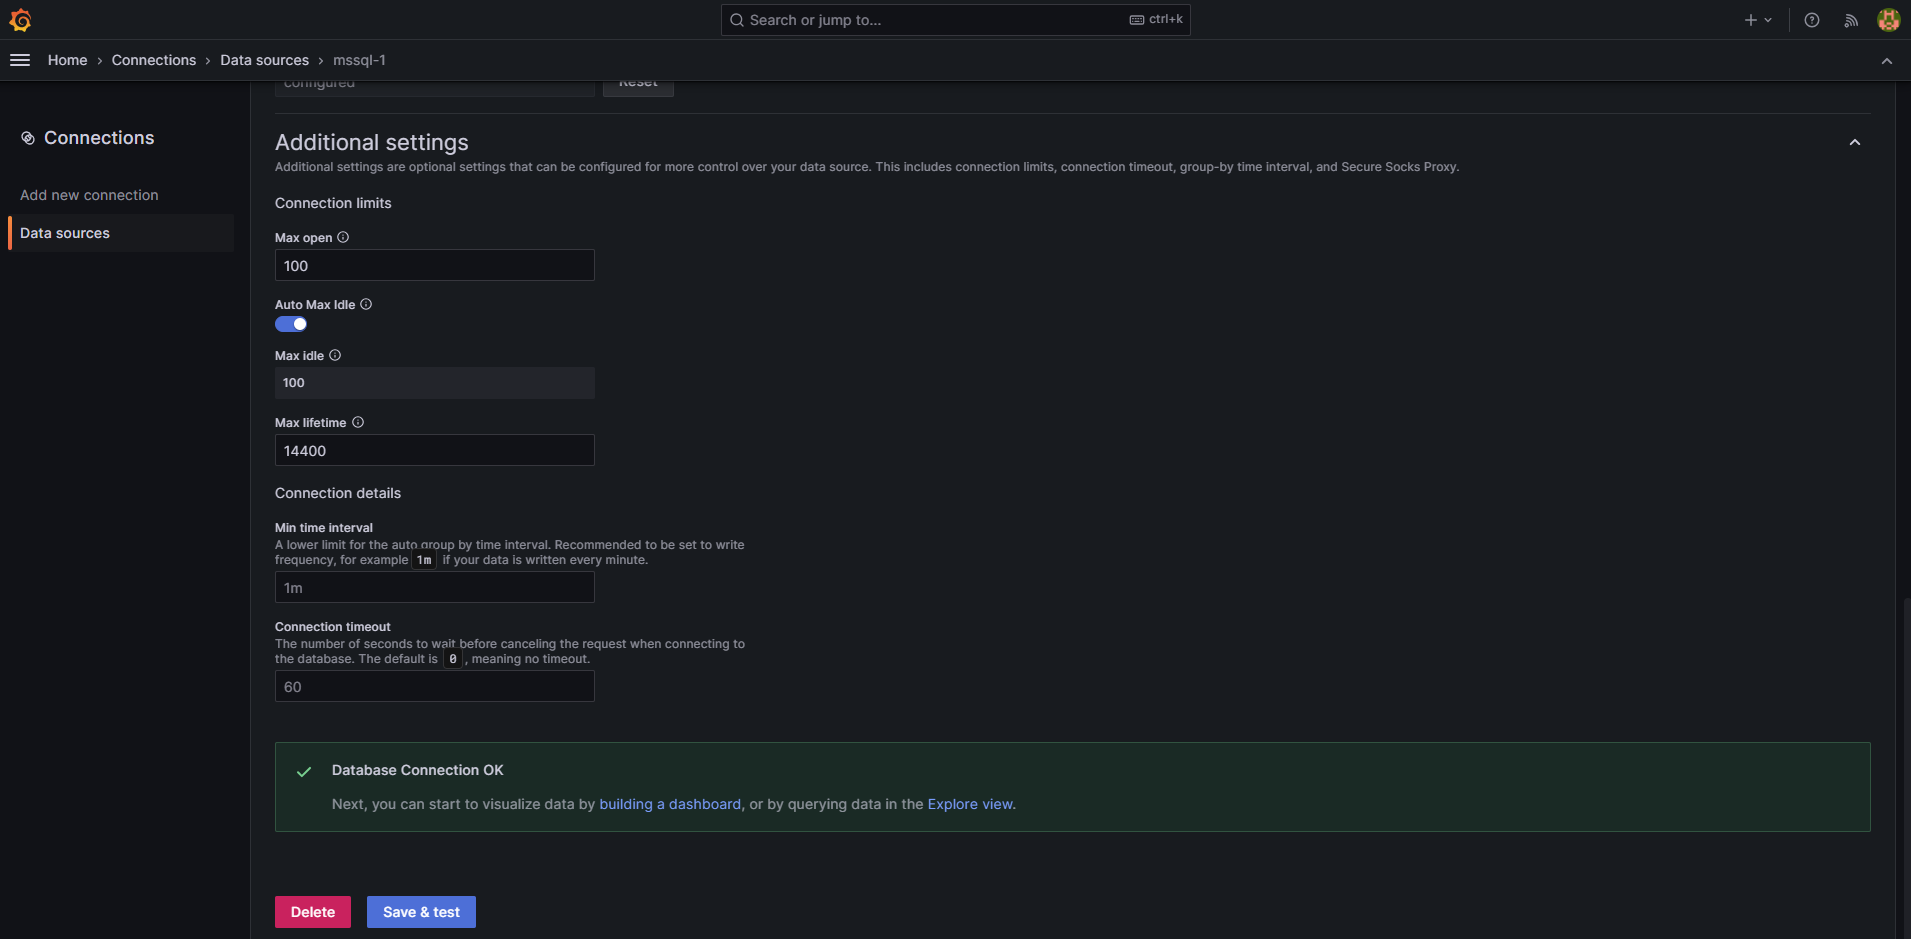
Click here to learn more about configuring MSSQL database in Grafana.
How to create a Dashboard in Grafana
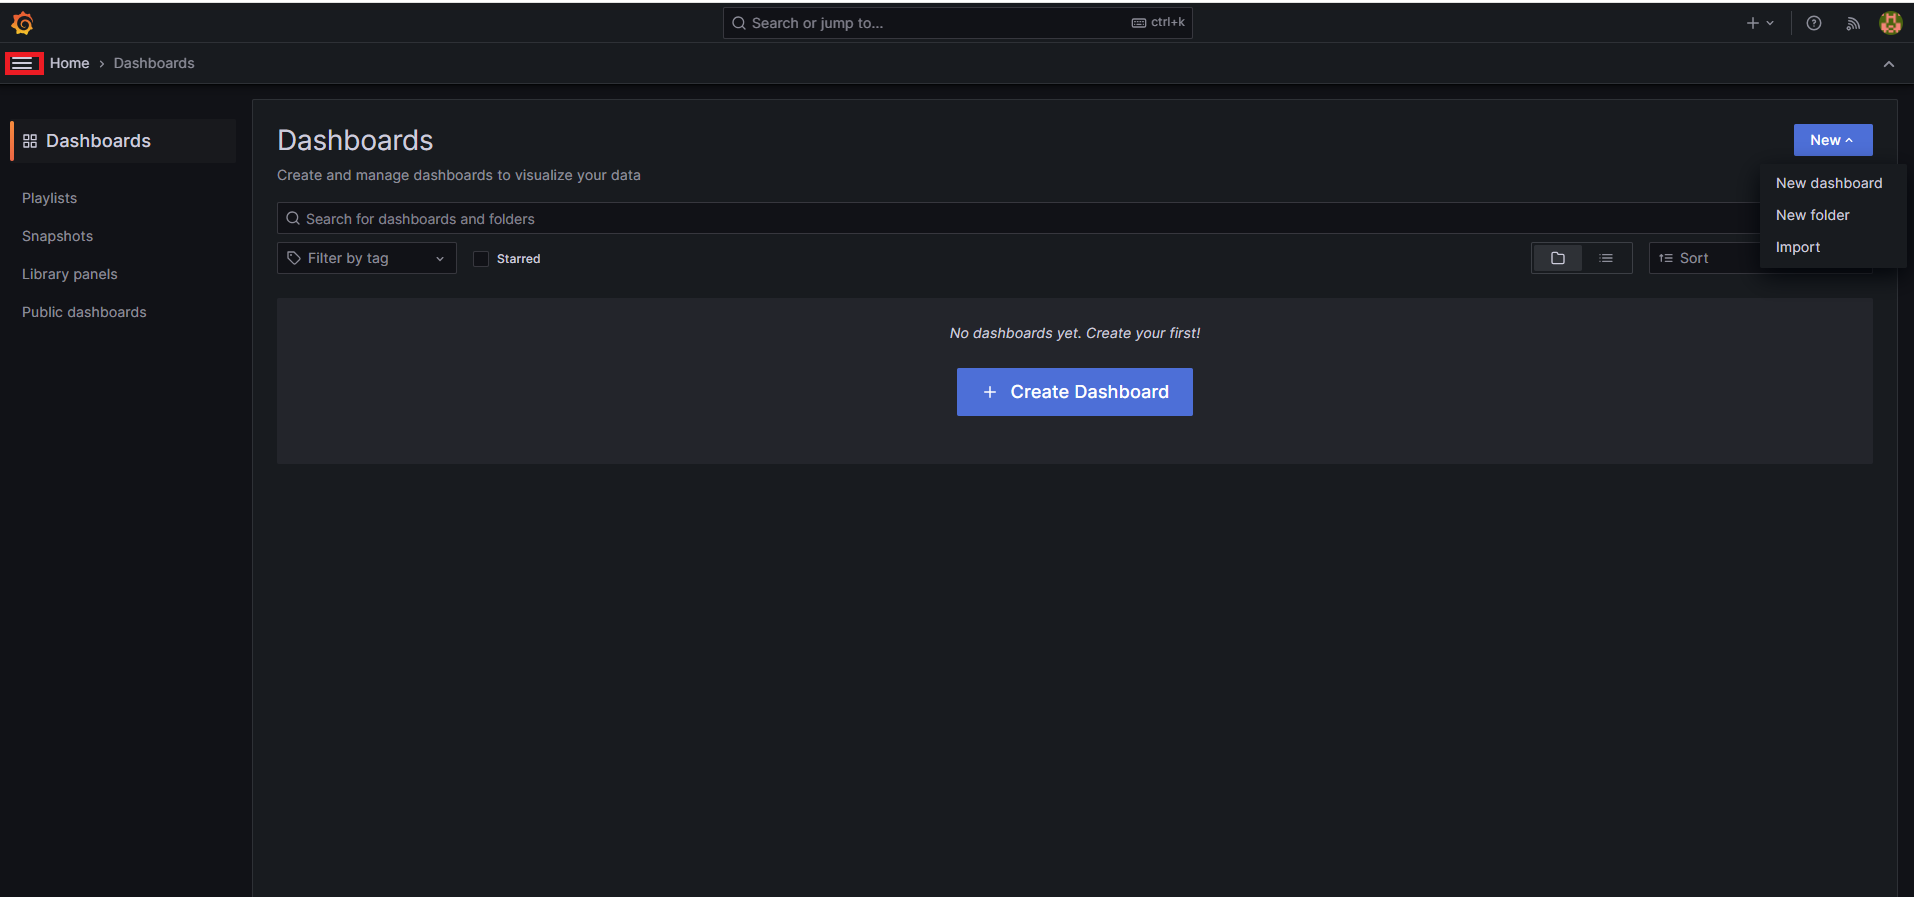
- Click the left-hand menu to open the Dashboards menu
- Create a new dashboard by clicking on the + Create Dashboard button.
- Select the added SQL server in the data source.
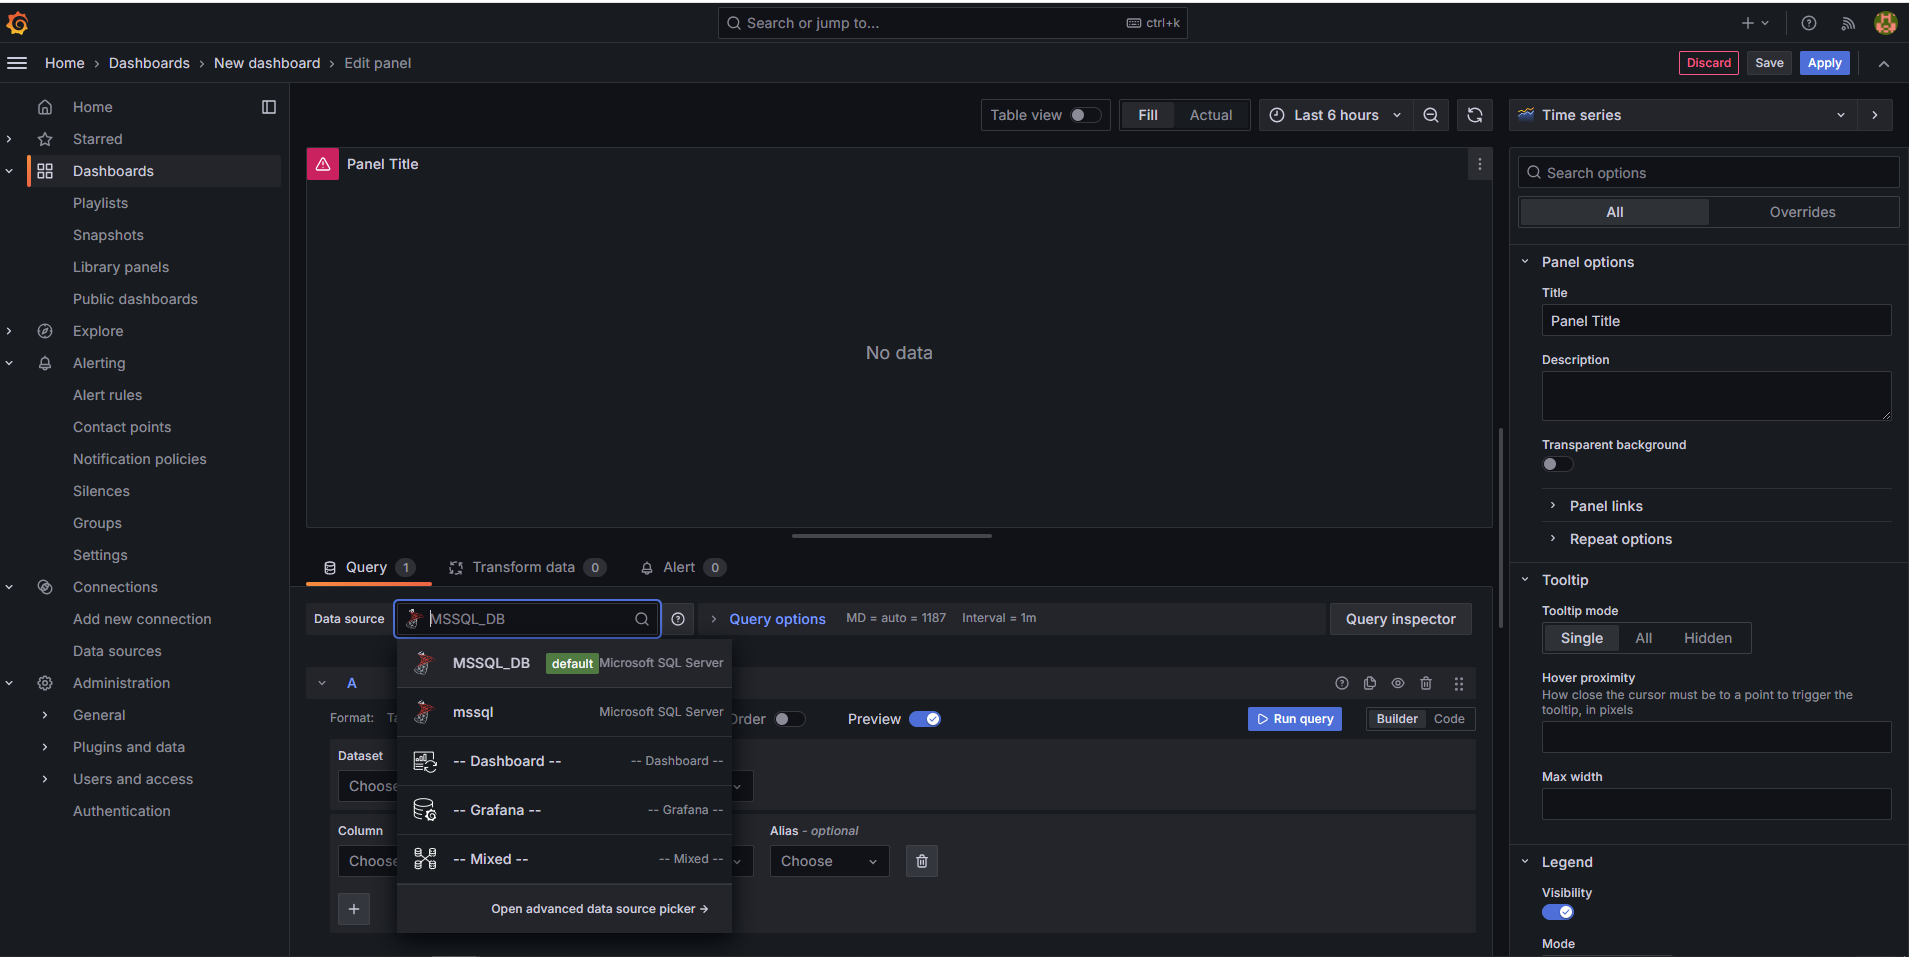
- Name the query.
- In the query editor, go to the Code section and type your SQL query.
- Run the query.
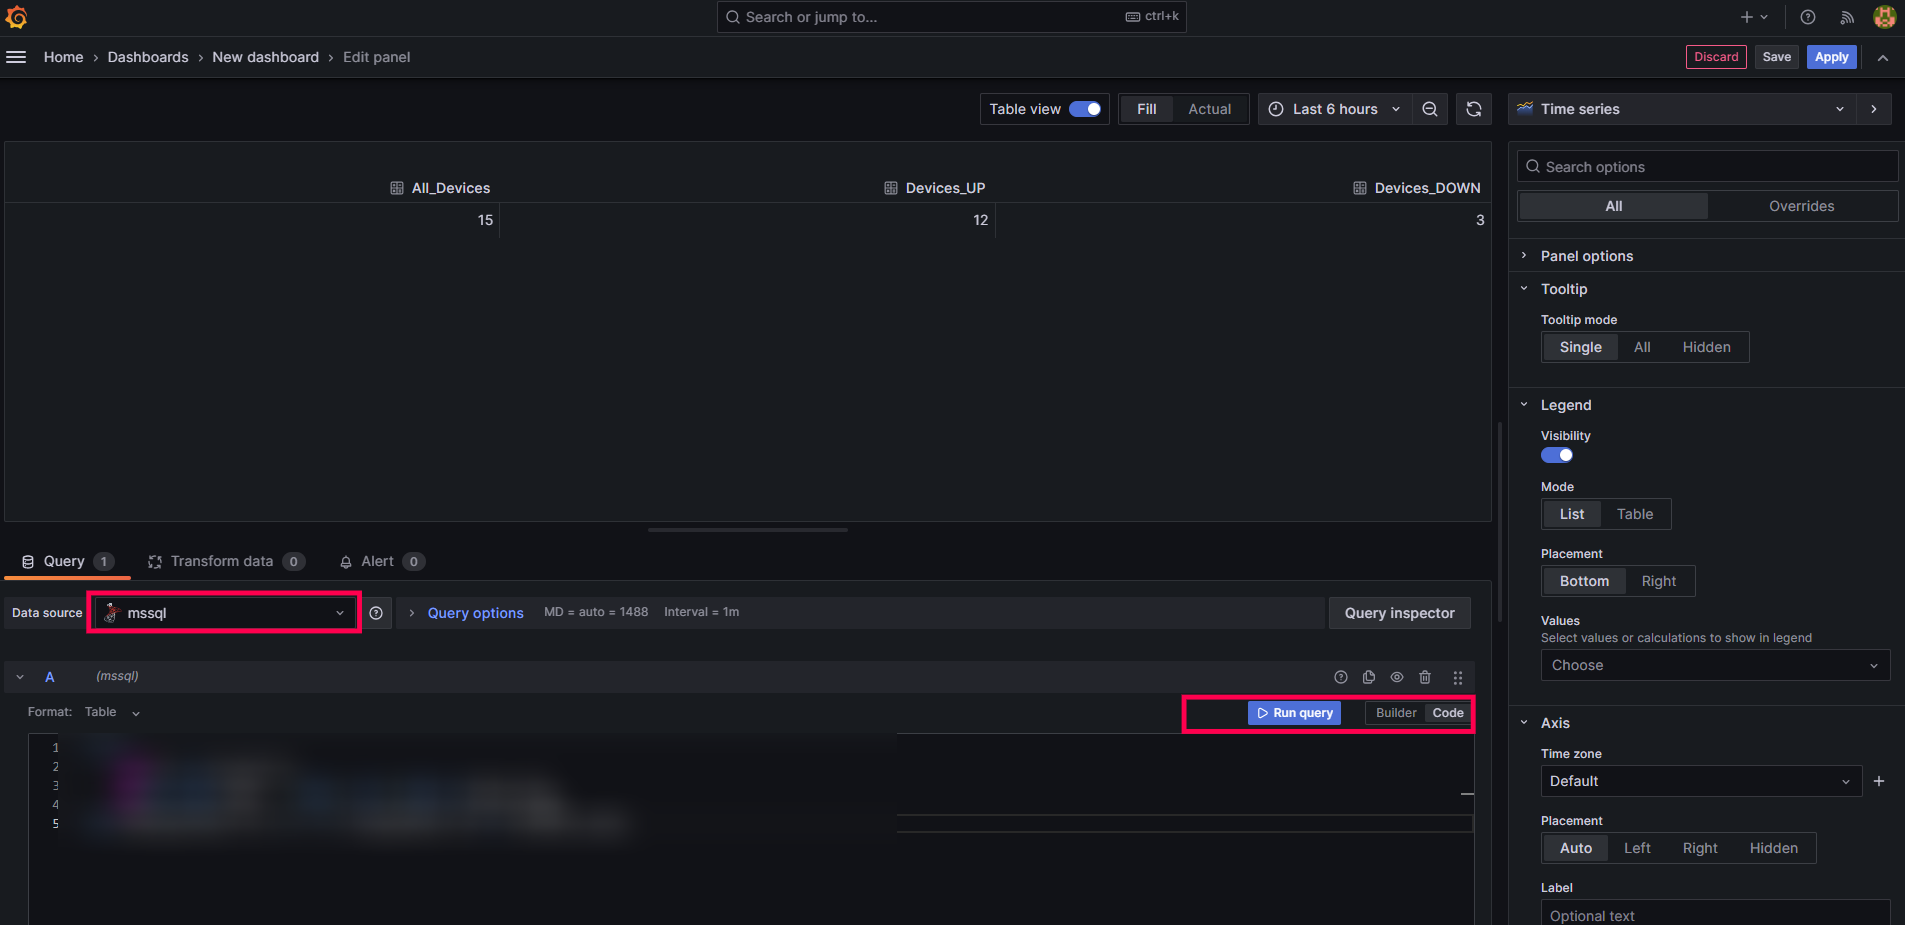
- In the right-hand side tab, choose the table or visualization type for the query.
- Name the dashboard and save it by clicking Save in the top-right corner.
- After saving the details, navigate to the dashboard to view the newly created dashboards in Grafana.