Configuring MCP Server Support in OpManager
The OpManager MCP Server implements the Model Context Protocol (MCP), a standardized interface that enables AI agents and large language models to interact seamlessly with ManageEngine OpManager. It acts as a bridge, allowing MCP-compatible clients to access OpManager operational data by providing the required context to AI models through a unified interface.
This document explains how to configure the ITOM MCP Server to enable MCP-compatible clients to interact with ManageEngine OpManager.
- Why MCP Server?
- Server Deployment (Docker-Based)
- First-Time Authorization Flow
- Configuring Visual Studio Code (GitHub Copilot)
- Configuring Claude Desktop
- Configuring Claude Code CLI
- Configuring Cursor
- Configuring stdio Clients (Local Subprocess Mode)
- Legacy API-Key Header Mode
- How to generate an API key in OpManager?
- Supported MCP Tool Categories
Why MCP Server?
The OpManager MCP Server enables MCP-compatible AI clients to interact with ManageEngine OpManager using a standardized MCP interface. It provides contextual access to OpManager data through authenticated API communication and supports integration with popular MCP hosts such as Visual Studio Code, Claude Desktop, Claude Code CLI, and Cursor along with other MCP clients that support MCP server connections.
By acting as a middleware layer between AI agents and OpManager, the MCP Server eliminates the need for direct client-side integrations while enabling secure, API key-based access to operational data.
- Enables MCP-compatible AI clients to interact with ManageEngine OpManager using a standardized MCP interface.
- Provides contextual access to OpManager data through authenticated API communication.
- Supports integration with popular MCP hosts such as Visual Studio Code, Claude Desktop, Claude Code CLI, and Cursor.
- Uses secure API key-based authentication for controlled access to OpManager resources.
- Supports both OAuth 2.1 authorization (recommended) and a deprecated legacy API-key header mode for clients that do not yet support MCP OAuth.
Server Deployment (Docker-Based)
The OpManager MCP Server is distributed as a Docker image and now runs as a long-lived HTTP service that MCP clients connect to over the network, rather than a container the client spawns per session.
The ITOM MCP Server is distributed as a Docker image and runs locally to facilitate communication between MCP-compatible clients and an OpManager instance. The Docker container uses environment variables to authenticate and establish connectivity with OpManager.
Prerequisites
Ensure the following requirements are met before proceeding:
- Docker is installed on the host that will run the MCP server (for example, Docker Desktop or Rancher Desktop).
- Access to an OpManager build with MCP support (version 12.8.719 or later).
- Network connectivity from the MCP server host to the OpManager instance.
- An MCP-compatible client, such as:
Configuration Steps
Step 1: Pull the MCP Server Docker image from Docker Hub
The official pre-built Docker image is available on Docker Hub and can be pulled directly to set up the ITOM MCP Server.
docker pull manageengineonpremises/itom-mcp-server:latestStep 2: Start the MCP Server (HTTP mode)
Configure your MCP-compatible client to connect to the ITOM MCP Server.
docker run -d --name itom-mcp -p 8000:8000 \
  -e MCP_PUBLIC_BASE_URL=http://<mcp-server-host>:8000 \
  -e MCP_TRANSPORT=http \
  --cap-drop=ALL \
  --cap-add=NET_BIND_SERVICE \
  manageengineonpremises/itom-mcp-server:latest
Replace <mcp-server-host> with the hostname/IP where this MCP server container is reachable by MCP clients.
-e OPMANAGER_API_URL=<OpManager_URL> at startup to fix the OpManager instance for all users of this server — in that case the browser form only asks for the API key.For production deployments behind HTTPS, add the following flags to the docker run command:
  -e MCP_TLS_ENABLED=true \
  -e MCP_TLS_PORT=8443 \
  -e MCP_TLS_CERT_FILE=/certs/server-cert.pem \
  -e MCP_TLS_KEY_FILE=/certs/server-key.pem \
  -v /host/certs:/certs:ro
Connecting from Another Network or the Cloud
To let clients outside the local network (a different office, home, or a cloud-hosted MCP client) reach this server, expose it through a secure tunnel/gateway instead of opening inbound firewall ports directly — for example ngrok, Microsoft devtunnel, or an equivalent reverse-tunnel service. The tunnel forwards a public HTTPS URL to the server's local port:
# Example with ngrok, forwarding to the container's published port 8000
ngrok http 8000
Use the tunnel's public URL (for example https://abcd1234.ngrok-free.app) as MCP_PUBLIC_BASE_URL in the docker run command, so OAuth metadata, /authorize redirects, and client mcp.json entries all agree on the same externally reachable origin:
docker run -d --name itom-mcp -p 8000:8000 \
  -e OPMANAGER_API_URL=<OpManager_URL> \
  -e MCP_PUBLIC_BASE_URL=https://abcd1234.ngrok-free.app \
  -e MCP_TRANSPORT=http \
  --cap-drop=ALL \
  --cap-add=NET_BIND_SERVICE \
  manageengineonpremises/itom-mcp-server:latest
Then point the remote client's mcp.json at the same tunnel URL instead of the LAN/localhost address used in the client sections below.
(Optional) stdio Mode
For local, single-user setups, the MCP client launches the server container itself as a subprocess — there is nothing to run manually here. Pull the image once:
docker pull manageengineonpremises/itom-mcp-server:latestThen configure the client with the docker run command and arguments (see Configuring stdio Clients (Local Subprocess Mode) below); the client executes that command for you on every launch.
In stdio mode there is no browser or HTTP header to fall back on, so both OPMANAGER_API_URL and OPMANAGER_MCP_API_KEYmust be passed as Docker environment variables in the client config. OAuth is not used in stdio mode.
First-Time Authorization Flow
Once the MCP server is running and a client is configured to point at it (see client sections below), the first connection triggers a one-time browser-based authorization:
- The MCP client fetches the server's OAuth discovery metadata (
/.well-known/oauth-authorization-server) and self-registers via Dynamic Client Registration (POST /register). - The client opens
/authorize, which redirects to a small page hosted by the MCP server (/itom/auth/page) asking for the OpManager API key (and, if not fixed by the server admin, the OpManager URL). - The server validates the key against OpManager (
GET /api/json/admin/getSupportedMCPVersions). On success, it issues a self-contained JWT access token (default 1 hour) and refresh token (default 30 days). The API key is encrypted inside the token. - The browser tab closes automatically and the client receives the token. No further browser interaction is required until the token expires or the server restarts.
- All subsequent MCP requests carry
Authorization: Bearer <token>.
Configuring Visual Studio Code (GitHub Copilot)
To configure the ITOM MCP Server in Visual Studio Code:
- Install Visual Studio Code and open your project workspace.
- In your project, navigate to the
.vscodefolder and create or openmcp.json. - Add the following ITOM MCP Server configuration under
"servers":
{
   "servers": {
     "ITOM_MCP_SERVER": {
       "type": "http",
       "url": "http://<mcp-server-host>:8000/mcp/"
     }
   }
 }
Replace the placeholder:
<mcp-server-host>- Hostname/IP of the running MCP server container
No API key is required in this file — you will be prompted for it in the browser the first time the client connects (see First-Time Authorization Flow).
Save the file after making the changes. On first use, approve the browser prompt and enter your OpManager API key.
Configuring Claude Desktop
To configure the ITOM MCP Server in Claude Desktop:
- Install and open Claude Desktop on your system.
- Navigate to Settings → Developer.
- Click Edit Config to open the
claude_desktop_config.jsonfile. - Add the following ITOM MCP Server configuration under
"mcpServers":
{
   "mcpServers": {
     "ITOM_MCP_SERVER": {
       "type": "http",
       "url": "http://<mcp-server-host>:8000/mcp/"
     }
   }
 }
Replace the placeholder:
<mcp-server-host>- Hostname/IP of the running MCP server container
Save the file. On first use, a browser tab opens to collect your OpManager API key.
Configuring Claude Code CLI
To configure the ITOM MCP Server in Claude Code CLI:
- Install and start Claude Code CLI on your system.
- Run the following command to add the ITOM MCP Server:
claude mcp add ITOM_MCP_SERVER --transport http http://<mcp-server-host>:8000/mcp/Replace the placeholder:
<mcp-server-host>- Hostname/IP of the running MCP server container
- Start Claude Code and use the ITOM MCP tools. On first use, a browser tab opens to collect your OpManager API key.
Configuring Cursor
To configure the ITOM MCP Server in Cursor:
- Open Cursor.
- Navigate to Settings → Tools & MCP.
- Click New MCP Server.
- Add the ITOM MCP Server configuration in the
mcp.jsonfile. - Paste the following configuration:
{
   "mcpServers": {
     "ITOM_MCP_SERVER": {
       "type": "http",
       "url": "http://<mcp-server-host>:8000/mcp/"
     }
   }
 }
Replace the placeholder:
<mcp-server-host>- Hostname/IP of the running MCP server container
Save the mcp.json file. On first use, a browser tab opens to collect your OpManager API key.
Configuring stdio Clients (Local Subprocess Mode)
If you started the server in stdio mode instead of HTTP mode (see Optional stdio Mode), the client launches the container itself and must supply both the OpManager URL and API key as environment variables — there is no browser prompt in stdio mode. Use this mcp.json/mcpServers entry (VS Code, Cursor, Claude Desktop all accept the same shape):
{
   "servers": {
     "ITOM_MCP_SERVER": {
       "type": "stdio",
       "command": "docker",
       "args": [
         "run", "-i", "--rm",
         "-e", "OPMANAGER_API_URL=<OpManager_URL>",
         "-e", "OPMANAGER_MCP_API_KEY=<OpManager_APIKey>",
         "-e", "MCP_TRANSPORT=stdio",
         "--cap-drop=ALL",
         "--cap-add=NET_BIND_SERVICE",
         "manageengineonpremises/itom-mcp-server:latest"
       ]
     }
   }
 }
Replace the placeholders:
<OpManager_URL>- URL of your OpManager instance (for example,https://your-server:8060)<OpManager_APIKey>- Your OpManager MCP API key
This is the closest equivalent to the previously published flow and remains useful for single-user/local setups, but the HTTP + OAuth flow above is recommended for shared/production deployments.
Legacy API-Key Header Mode
For MCP clients that do not yet support OAuth 2.1, the server can accept the OpManager API key directly as an HTTP header. This is deprecated and can be disabled by setting ITOM_AUTH_LEGACY_HEADER_ENABLED=false on the server.
{
   "servers": {
     "ITOM_MCP_SERVER": {
       "type": "http",
       "url": "http://<mcp-server-host>:8000/mcp/",
       "headers": {
         "OPMANAGER_MCP_API_KEY": "<OpManager_APIKey>"
       }
     }
   }
}mcp.json files. Prefer the OAuth flow above whenever the client supports it.How to generate an API key in OpManager?
MCP Server API access must be enabled at both the product level and user level, and the API key must be generated before configuring an MCP client.
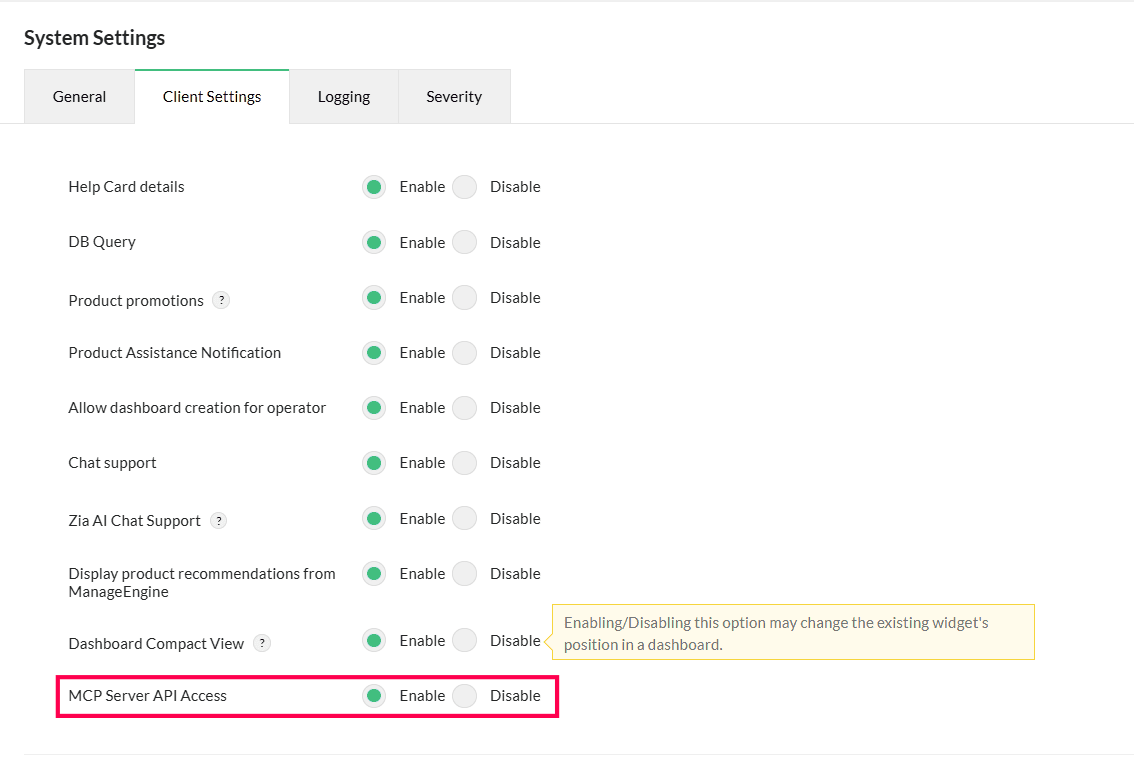
Step 1: Enable MCP Server API Access at the Product Level
This setting enables MCP Server support for the OpManager instance.
- Navigate to General Settings → System Settings → Client Settings.
- Locate MCP Server API Access.
- Select Enable.
- Click Save.
Step 2: Enable MCP Server API Access for a User
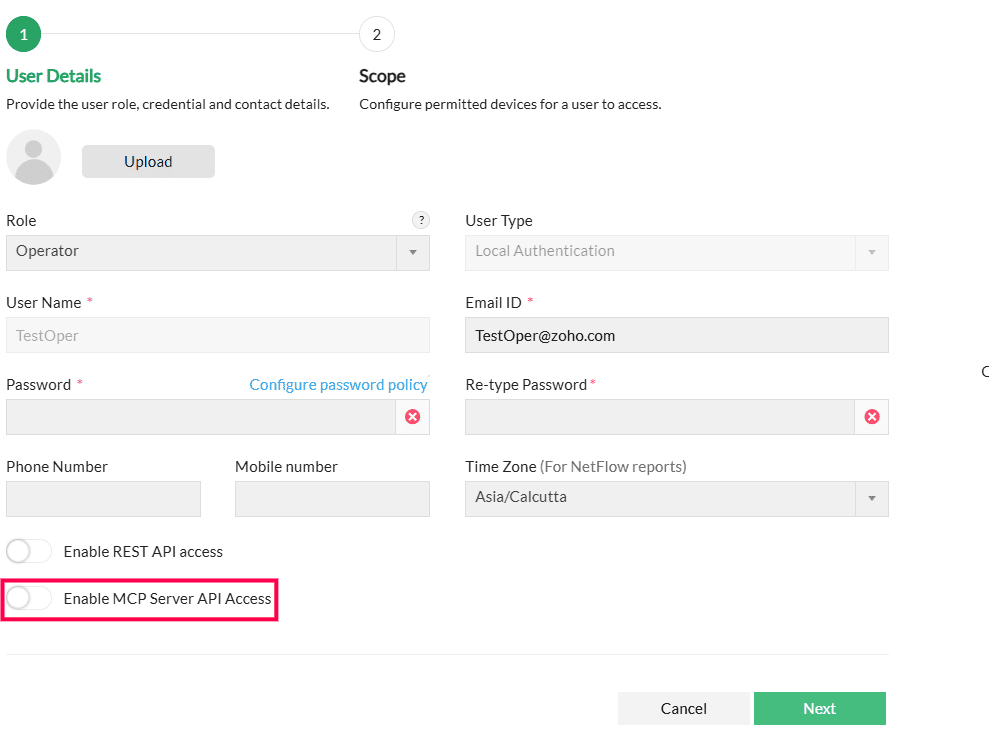
This setting allows a specific user to generate and use an MCP API key.
- Go to Settings → User Management → Users.
- Click Edit for the required user.
- In the User Details section, enable Enable MCP Server API Access.
- Click Next, configure the user scope if required, and click Save.
Step 3: Generate the MCP Server API Key
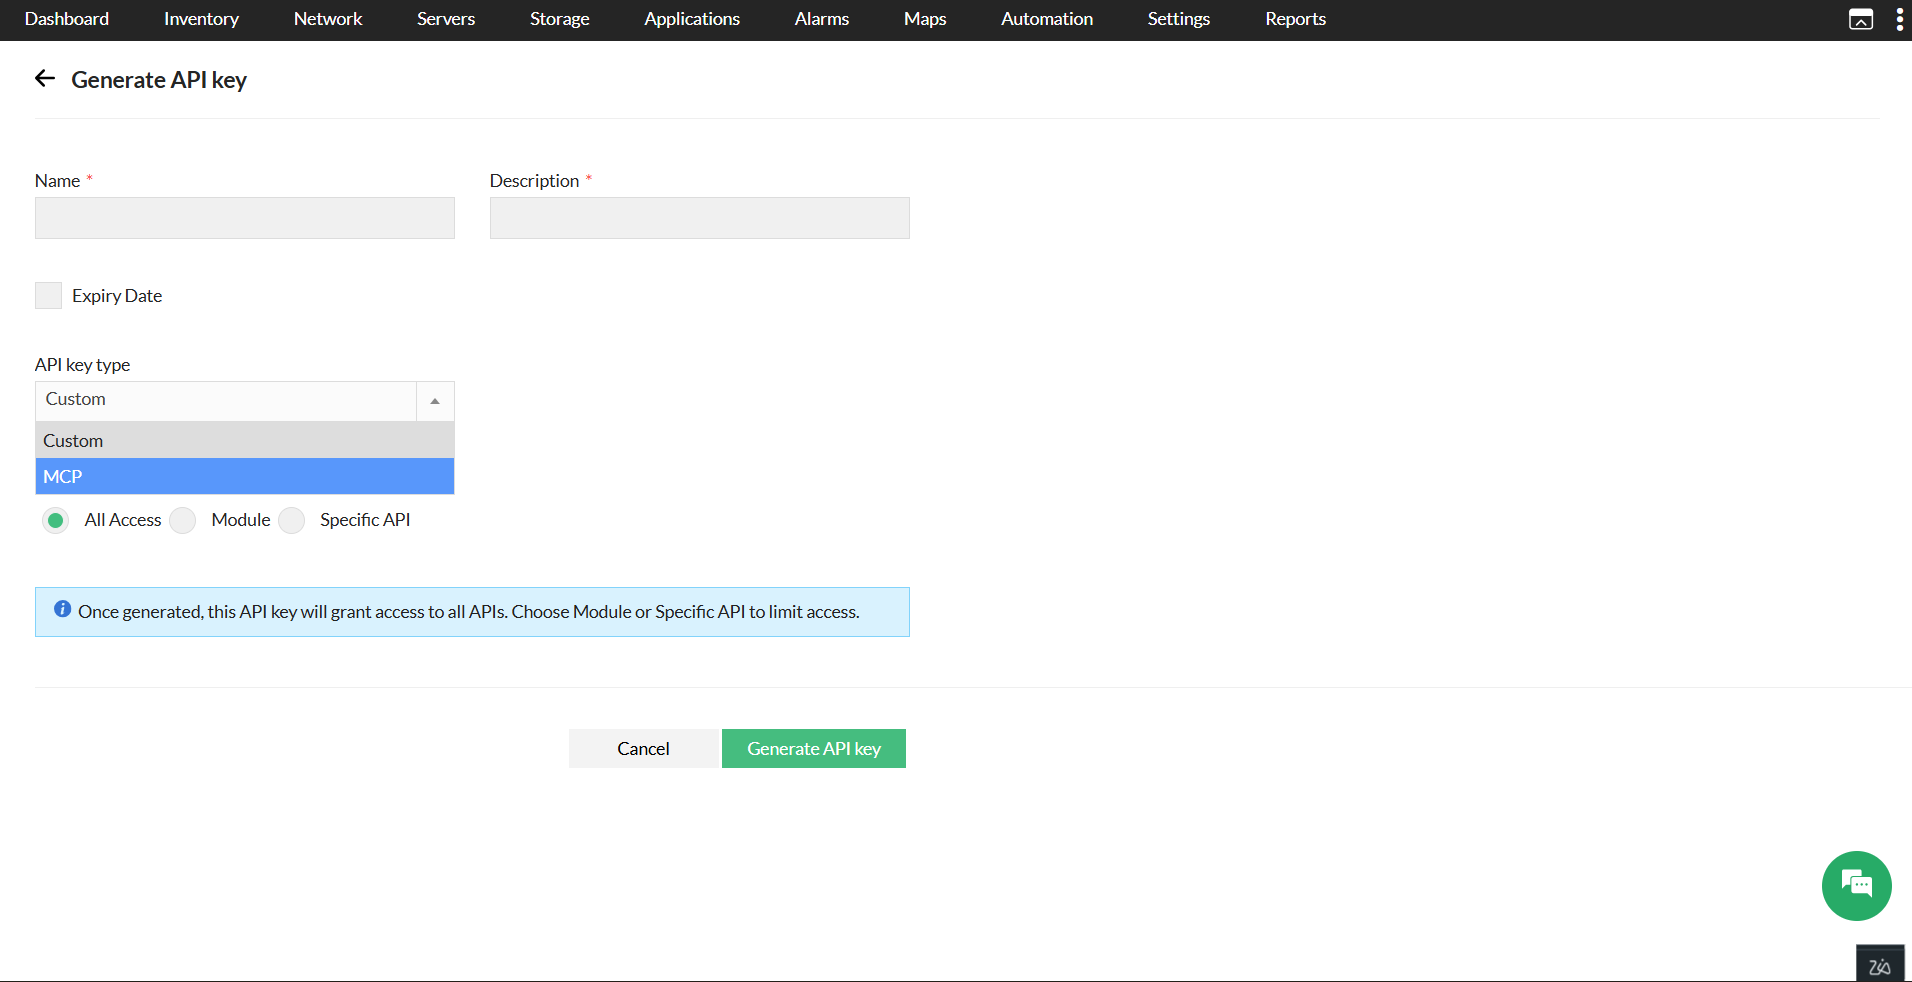
For versions 12.8.721 and above, follow the steps below to generate the MCP API key, after enabling access.
- Go to Quick Links → API Key Management.
- Click Generate API Key.
- In the Generate API Key page, fill in the required details and set the API Key Type to MCP.
- The API key will be generated. Click the Copy & Close icon to copy the API key.
- Use this key when configuring the MCP client.
- To regenerate the key, go to the API Key Management page and click the refresh icon for the corresponding MCP API key to generate a new key.
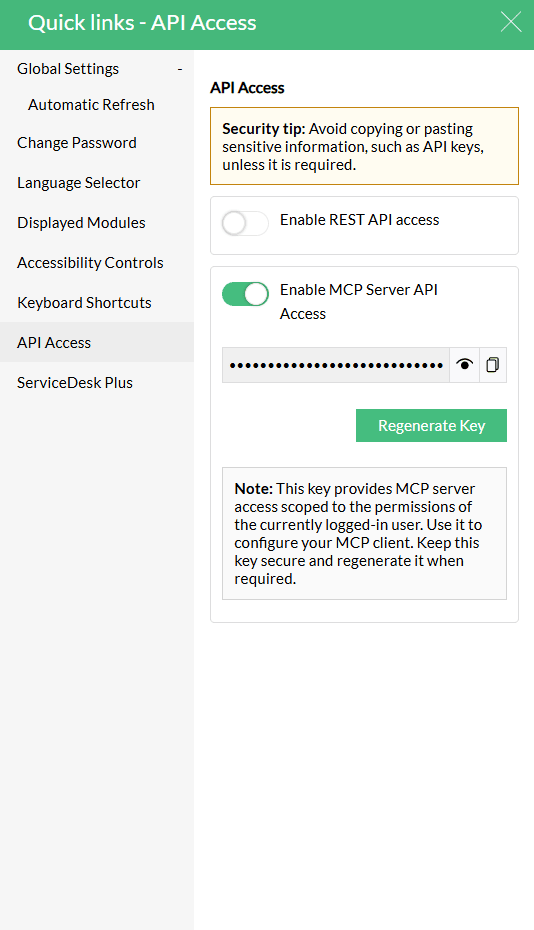
For versions below 12.8.721, follow the steps below to generate the MCP API key, after enabling access.
- Go to Quick Settings → API Access.
- Locate Enable MCP Server API Access.
- Enable the toggle if not already enabled.
- Click the Copy icon to copy the API key.
- Use this key when configuring the MCP client.
- Click Regenerate Key if you want to generate a new key.
Supported MCP Tool Categories
The OpManager MCP Server supports a range of tools grouped into categories based on what they help you accomplish. Use this section to understand what each category covers and when to use it.
The following categories of tools are available:
Alarm retrieval
Tools in this category help you fetch active alarms, incidents, alarm properties, related context, and incident metrics from OpManager.
Use cases
- Summarize the most critical active alarms in the environment
- Retrieve alarm details for a specific device or resource
- Review alarm conditions before taking corrective action
- Compare current alarms across monitored segments
- Review response and resolution times for recent alarm incidents
- Identify alarms with frequent flapping behavior
- Compare how alarms are being handled across teams or sites
- Analyze alarm trends during post-incident reviews
Mapped tools
GetAlarmsAndIncidentsGetAlarmDetailsGetAlarmIncidentMetrics
Alarm actions
Tools in this category let you perform alarm actions directly from the MCP session, including acknowledging, clearing, and adding notes to alarms. Some actions may require confirmation depending on your MCP server configuration.
Use cases
- Acknowledge a set of alarms during incident triage
- Clear resolved alarms after validation
- Remove an acknowledgement when reassigning an alarm to another team
- Execute alarm lifecycle actions from an AI-assisted workflow
- Add troubleshooting findings to an active alarm
- Review prior operator notes before continuing investigation
- Update remediation status for shift handoffs
- Keep a record of actions taken on an alarm for handoff or review
Mapped tools
AcknowledgeAlarmsUnacknowledgeAlarmsClearAlarmsAddAlarmNotesGetAlarmNotesUpdateAlarmNotes
Device inventory, insights, and filtering
Tools in this category help you retrieve device inventories, detailed device summaries, and filter options from OpManager.
Use cases
- List all devices in the monitored environment
- Retrieve devices by type, such as switches, routers, or servers
- Build inventory summaries for AI-assisted health reviews
- Verify that all expected devices are being monitored
- Get a summary for a specific monitored device
- Identify available filters before querying a subset of devices
- Build targeted queries for device groups
- Summarize device health and operational status
Mapped tools
ListDevicesGetDeviceSummaryGetDeviceFilterOptions
Topology and relationship analysis
Tools in this category help you retrieve virtualization hierarchies and relationship data between monitored devices and infrastructure elements.
Use cases
- Retrieve a vCenter -> Cluster -> Host -> VM hierarchy
- Identify impacted virtual machines under a host or cluster issue
- Review virtual infrastructure organization before remediation
- Get a summary of how virtualized resources are organized and connected
- Identify upstream and downstream dependencies for a network issue
- Retrieve relationship data for impact analysis
- Correlate affected devices during a network event
- Identify related devices that may have contributed to an issue
Mapped tools
GetVirtualizationInfrastructureTopologyGetDeviceRelationshipData
Reporting and report discovery
Tools in this category help you discover available reports, retrieve report configuration options, and access preconfigured report data.
Use cases
- List all available preconfigured reports
- Discover valid filters before running a report
- Retrieve historical report data for analysis
- Generate AI-assisted summaries from existing OpManager reports
Mapped tools
GetReportConfigurationOptionsGetAvailableReportsListGetReportData
Performance monitor discovery and metrics analysis
Tools in this category help you discover available performance monitors and retrieve performance metrics and KPI data for a device.
Use cases
- Discover which performance monitors are available for a device
- Identify valid metrics before building performance queries
- Retrieve performance data to answer questions about device health
- Retrieve KPI data to identify performance trends over time
Mapped tools
GetAvailablePerformanceMonitorsGetPerformanceMetricsAndKPIs
Enterprise probe management
Tools in this category help you retrieve probe details in distributed OpManager deployments where data needs to be reviewed or compared across multiple probes.
Use cases
- List all probes configured in OpManager Central
- Compare alarms or inventory across probes
- Validate probe availability before multi-probe queries
- Support enterprise-wide summaries in distributed deployments
Mapped tools
ListOpManagerProbes
Flow Analysis inventory
Tools in this category help you discover which devices, interfaces, and groups are available in Flow Analysis before running traffic queries.
Use cases
- Discover which devices and interfaces are available in Flow Analysis
- Check available interface groups and SSID groups before running traffic queries
- Identify interfaces that are nearing full capacity
Mapped tools
ListFlowAnalysisDevicesListFlowAnalysisInterfacesListFlowAnalysisIPGroupsListFlowAnalysisInterfaceGroupsListFlowAnalysisWLCControllersListFlowAnalysisAccessPointsListFlowAnalysisAccessPointGroupsListFlowAnalysisSSIDGroups
Flow Analysis reports
Tools in this category help you retrieve traffic report data from Flow Analysis devices, including top talker data, application traffic, and conversation-level details.
Use cases
- Retrieve top talker data for a specific device or interface
- Fetch traffic data filtered by application, source, destination, or DSCP
- Get conversation-level traffic details for a specific flow
- Pull historical traffic data for AI-assisted summarization
Mapped tools
ListFlowAnalysisTopNDataGetFlowAnalysisTrafficDataGetFlowAnalysisApplicationDataGetFlowAnalysisSourceDataGetFlowAnalysisDestinationDataGetFlowAnalysisDSCPDataGetFlowAnalysisASDataGetFlowAnalysisASGroupDataGetFlowAnalysisConversationDataGetFlowAnalysisIndividualGraphDataGetFlowAnalysisSearchReport
Flow Analysis wireless reports
Tools in this category help you retrieve Flow Analysis data from wireless devices, including top talker data, SSID traffic, and wireless conversation details.
Use cases
- Identify top talkers consuming wireless bandwidth
- Investigate congested access points by SSID or traffic criteria
- Pull wireless traffic history for AI-assisted reporting
Mapped tools
ListFlowAnalysisWLCTopNDataGetFlowAnalysisWirelessDataGetFlowAnalysisWirelessSearchReport