Organization Map
An organization map provides you with a detailed visual representation of your entire network architecture. Organization map is available from the build 12.8.458 version. All the devices, their dependencies, applications, and network topologies are mapped together automatically to construct the organization map. Additionally, all discovered entities (managed or unmanaged) will get added to the organization map.
To view the organization map, go to Map -> Organziation Map(Beta)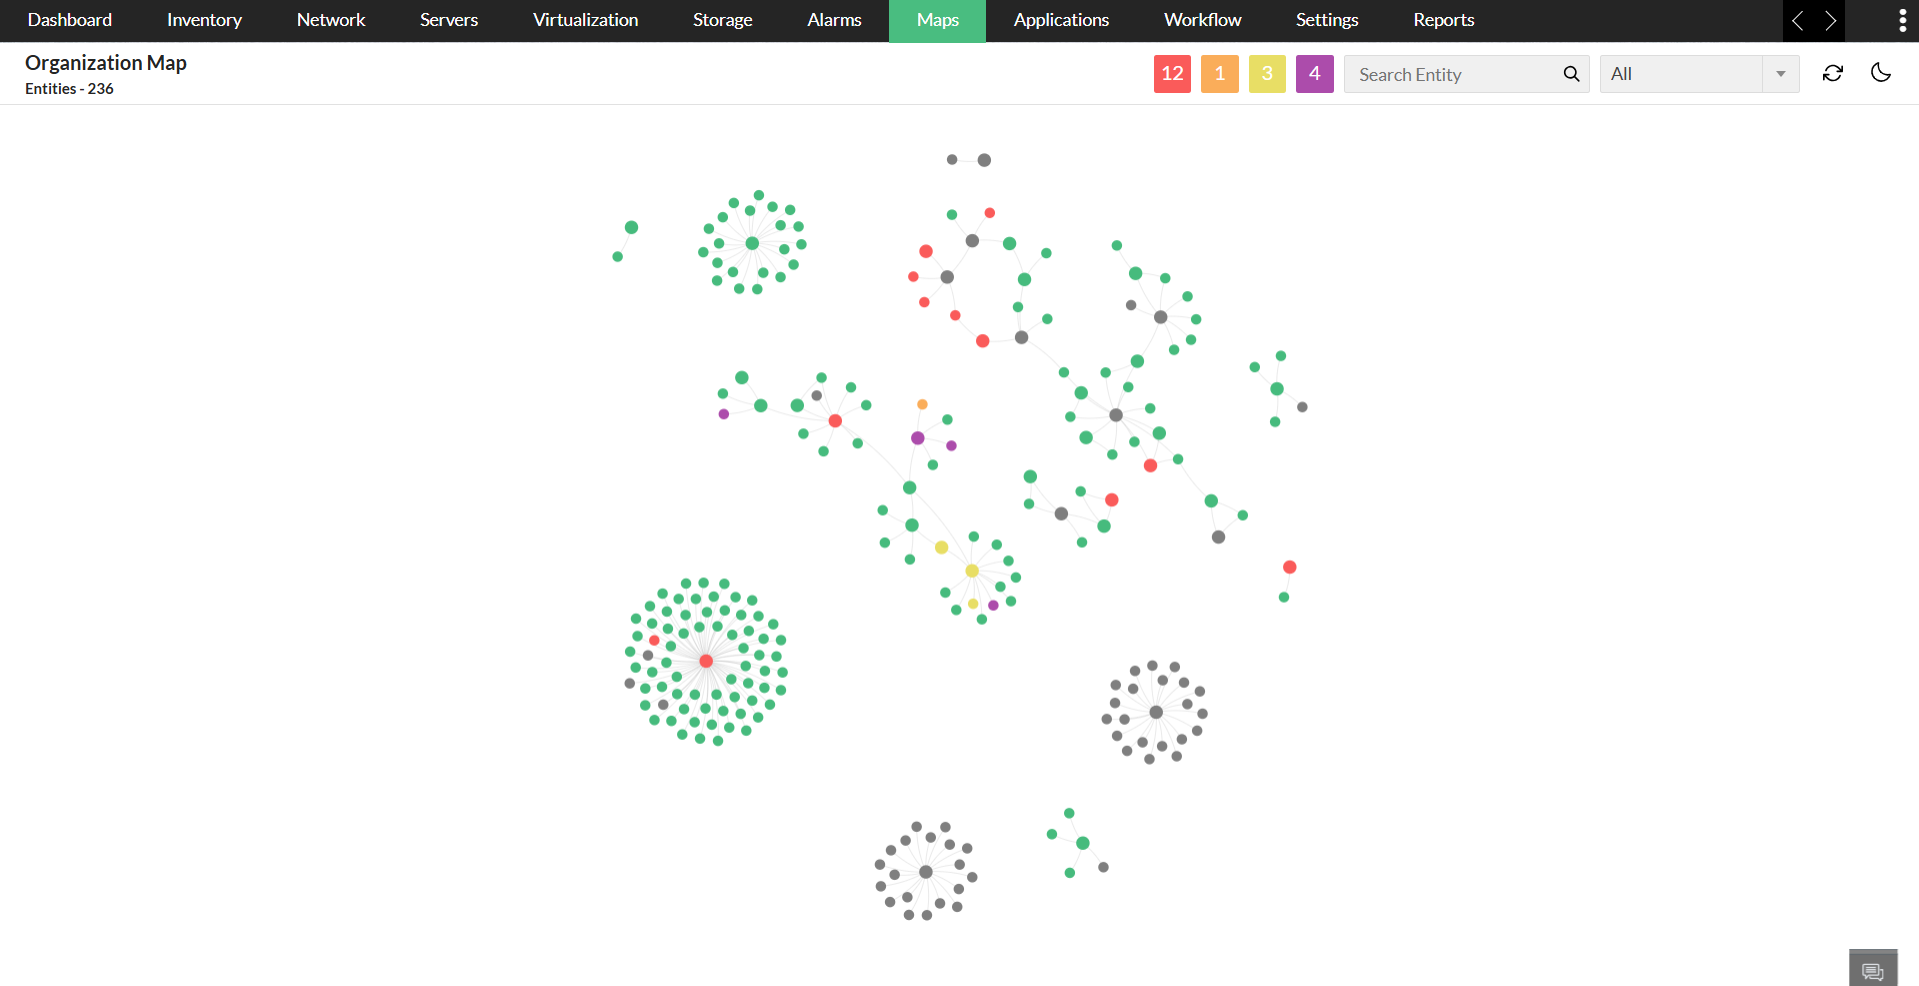
What are the components included in Organization Map?
Organization map enables you to know the hierarchical structure and health of every node present in the network. In the Map, the summary of each device, their connections, and severities are provided.
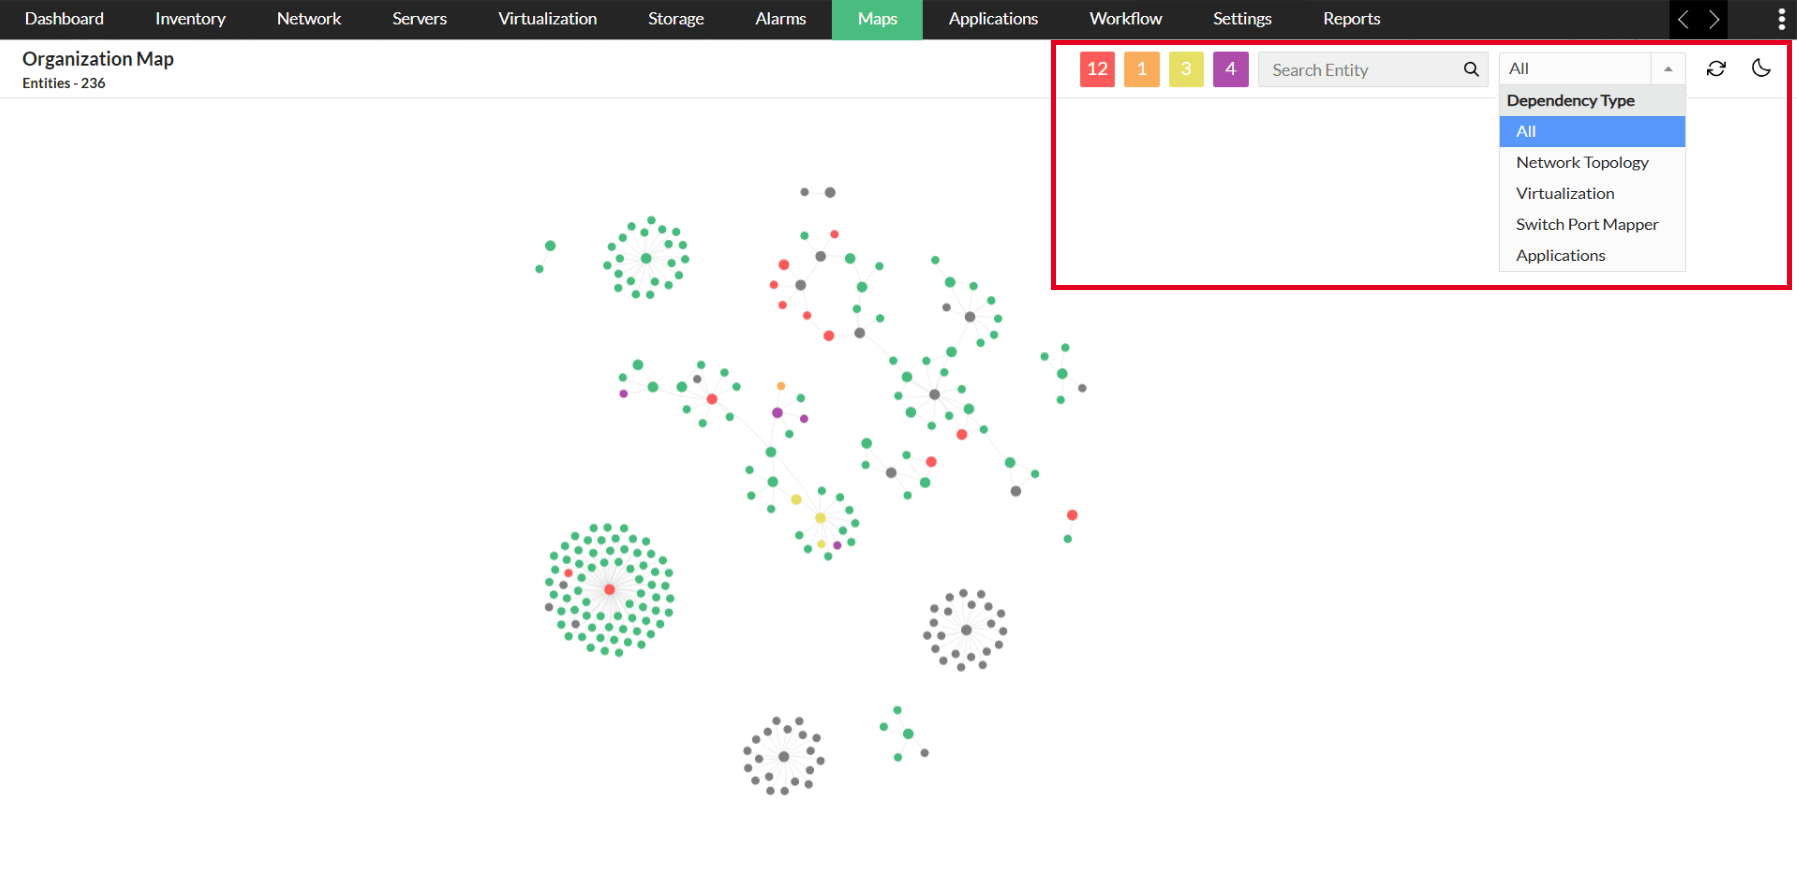
- Dependency Type: By default, all entities are displayed together. However, you can use the filter option to view them based on your requirement.
- Network Topology: Once you've created a Layer 2 map, OpManager will automatically use it to identify the devices connected to seed routers and display the core router along with the connected devices.
- Virtualization:OpManager uses the Virtualization module to generate a map of your virtual environment, which includes your virtual machines, hosts, and servers.
- Switch Port Mapper: If you have the SPM module enabled, the Organization Map will display the port and switch details of the monitored devices.
- Applications: To view applications on the map, you need to install and enable the Application Manager plug-in. OpManager will then use ADDM to identify the applications running on your servers and VMs, and use that data to generate the map.
- Meraki Topology: Displays dependencies discovered from Cisco Meraki environments. OpManager fetches topology data from the Meraki controller and maps relationships between Meraki-managed devices such as switches, access points, and security appliances, reflecting the controller-defined network structure.
- ACI Topology: Displays dependencies within Cisco ACI environments. OpManager integrates with the APIC controller to identify relationships between ACI components such as leaf switches, spine switches, and APICs, and visualizes how fabric elements are interconnected.
- SD-WAN Topology: Displays dependencies in SD-WAN environments based on controller-discovered topology. OpManager maps relationships between branch devices, edge routers, hubs, and WAN links to provide a clear view of overlay connectivity and site-to-site communication paths.
- WLC Topology: Displays dependencies between Wireless LAN Controllers and access points. OpManager identifies which access points are managed by each controller and visualizes the controller-to-AP relationships to help monitor wireless infrastructure health.
- Stack Topology: Displays dependencies between stacked devices. OpManager identifies stack members and their interconnections and represents them as a single logical entity while retaining visibility into individual stack components.
- Re-build Map: This option will enable you to refresh the map manually, once clicked OpManager will rebuild the map, any changes will be reflected on the map.
- Severity: Each severity level is shown in a colored box along with the total number of nodes. You can click on any box to view the nodes for that specific severity.
- Search Entity: A search bar to find entities based on the type, category, and device name, helping you quickly navigate to the right module and accelerate troubleshooting.
- Light/Dark mode: You can switch the Organization map's theme according to your preference.
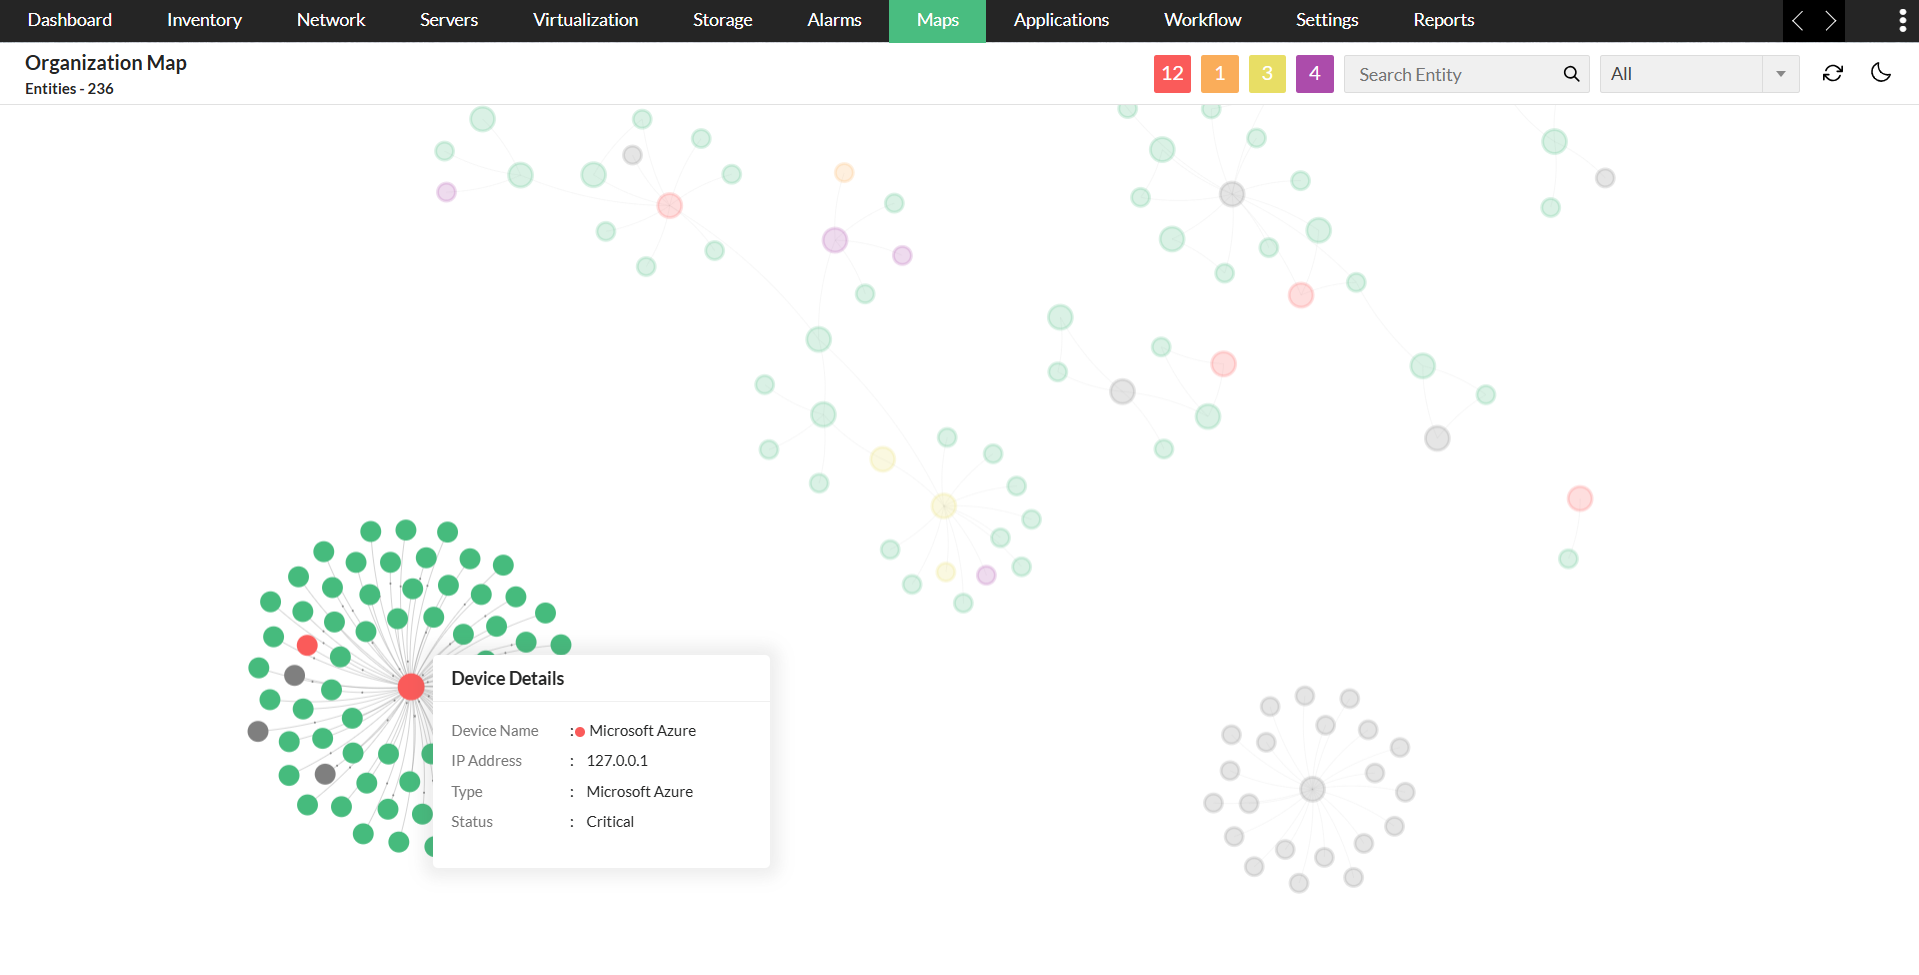
Device Details from the Map
- Device Summary: By hovering over a node, a tooltip with the device details appears.
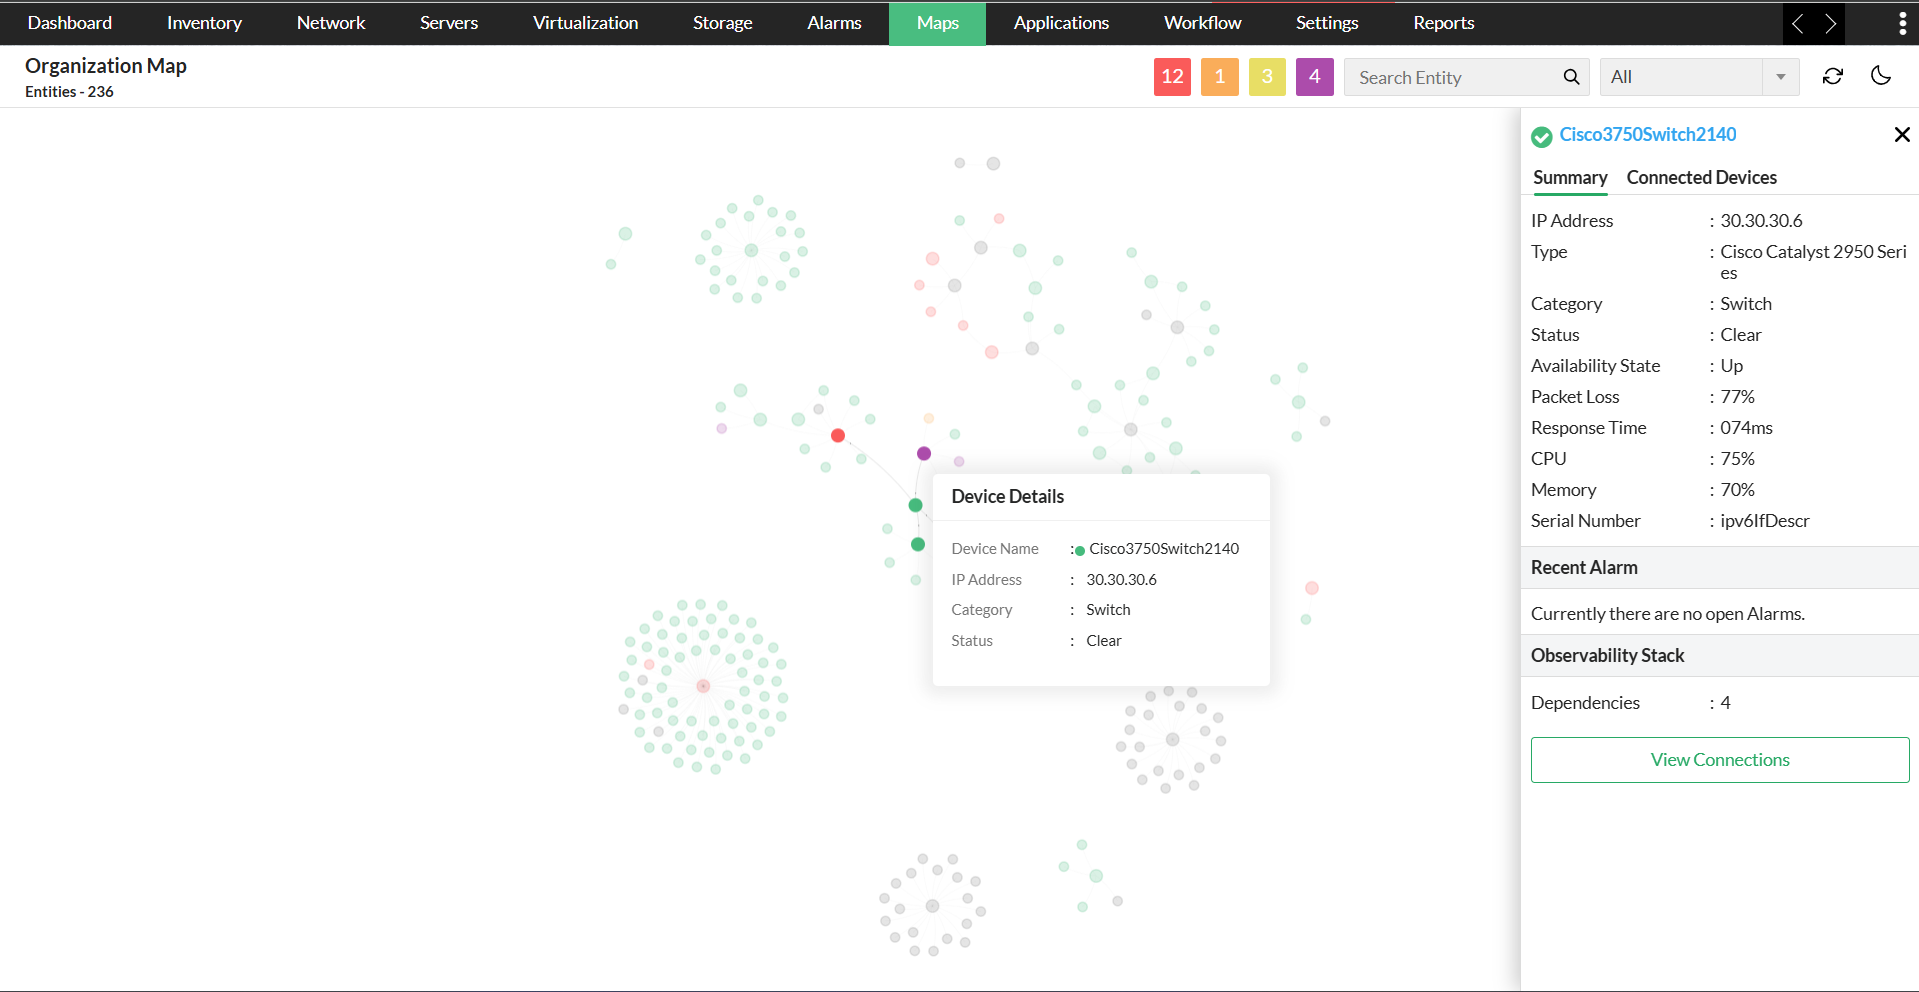
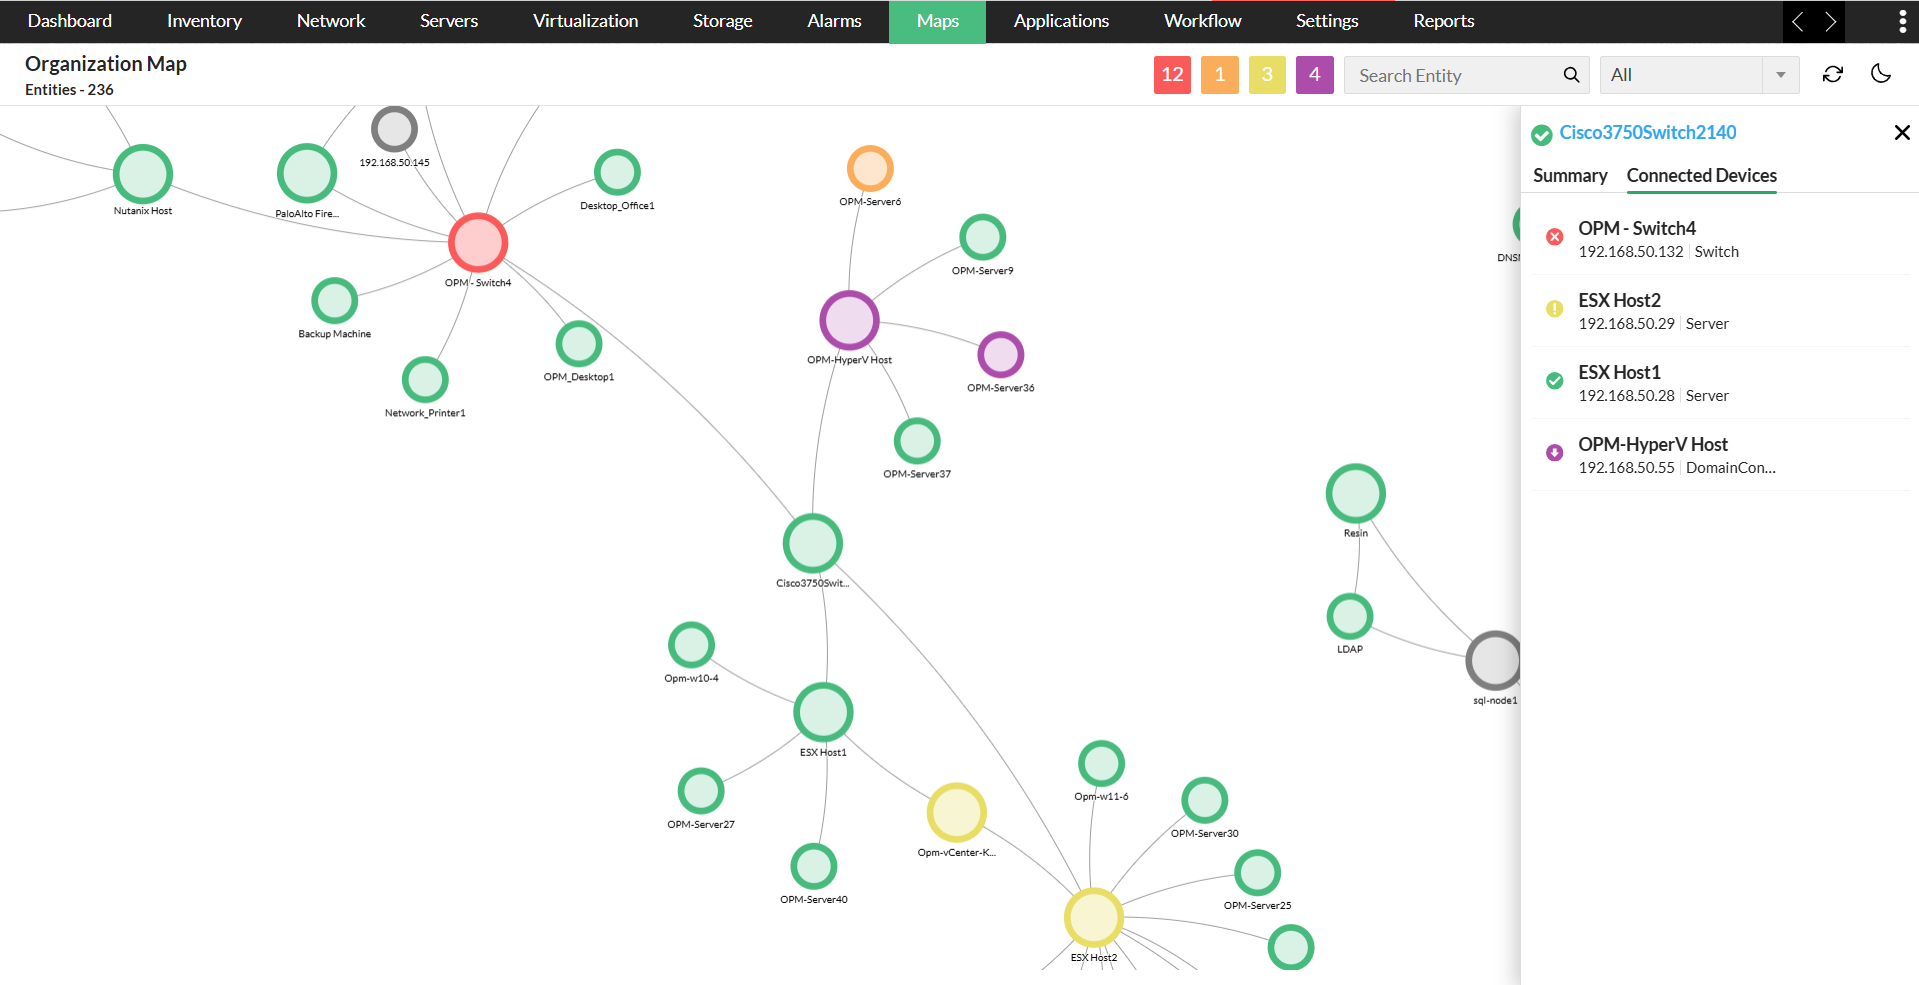
- Click on a node, and the summary of the node will open in a panel on the right.
- The node summary panel will be titled with the node’s name and will display details such as IP address, type, category, status, availability state, packet loss, response time, CPU usage, memory, and serial number.
- Recent Alarms: Any recent alarms triggered in an entity will be notified in the panel.
How to view the dependencies of a device?
- Observability Stack: You can view the total number of dependencies for each node. In the right panel, below Recent Alarms, the Observability Stack will be provided.
- Click on View Connections to see the device and its dependencies on the map.
- In the panel, under connected devices, if you click on any device listed, it will direct you to the device snapshot page, giving a complete view of the device properties.
Note:The map will be created within one hour automatically after OpManager's initial installation, and subsequent refresh occurs every six hours.