OpManager offers REST APIs for adding and fetching data from OpManager. Using these APIs, you can integrate OpManager with 3rd party IT management/service desk software.
Note: This document provides a list of REST
APIs used to send OpManager data to external sources.
To
learn more about ingesting data from external websitesor
third-party tools into OpManager, click here.
How OpManager REST APIs work?
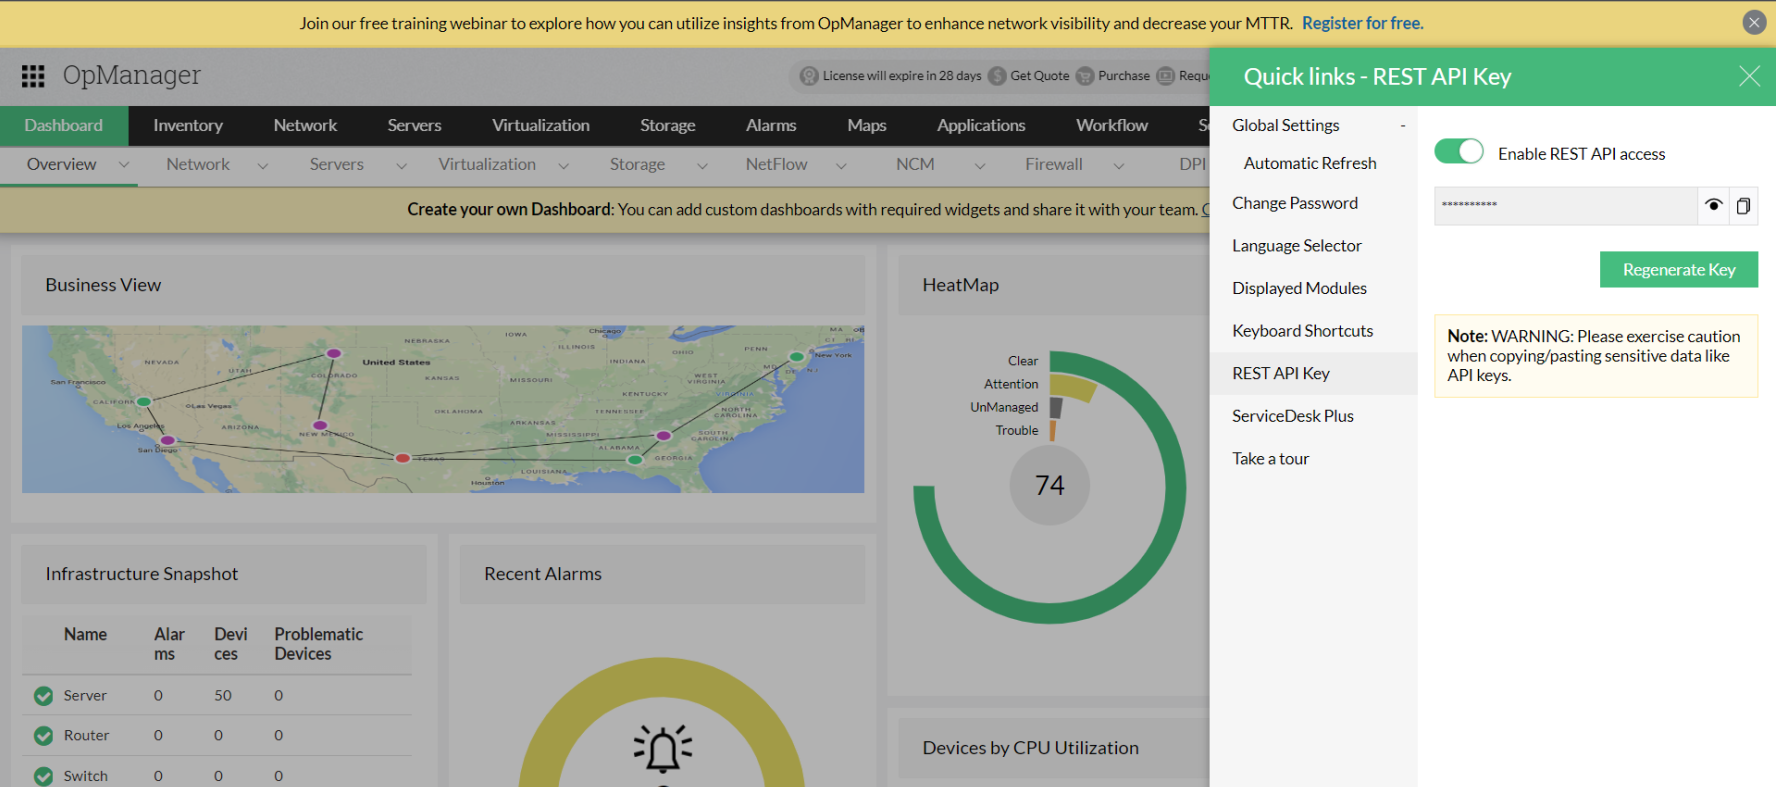
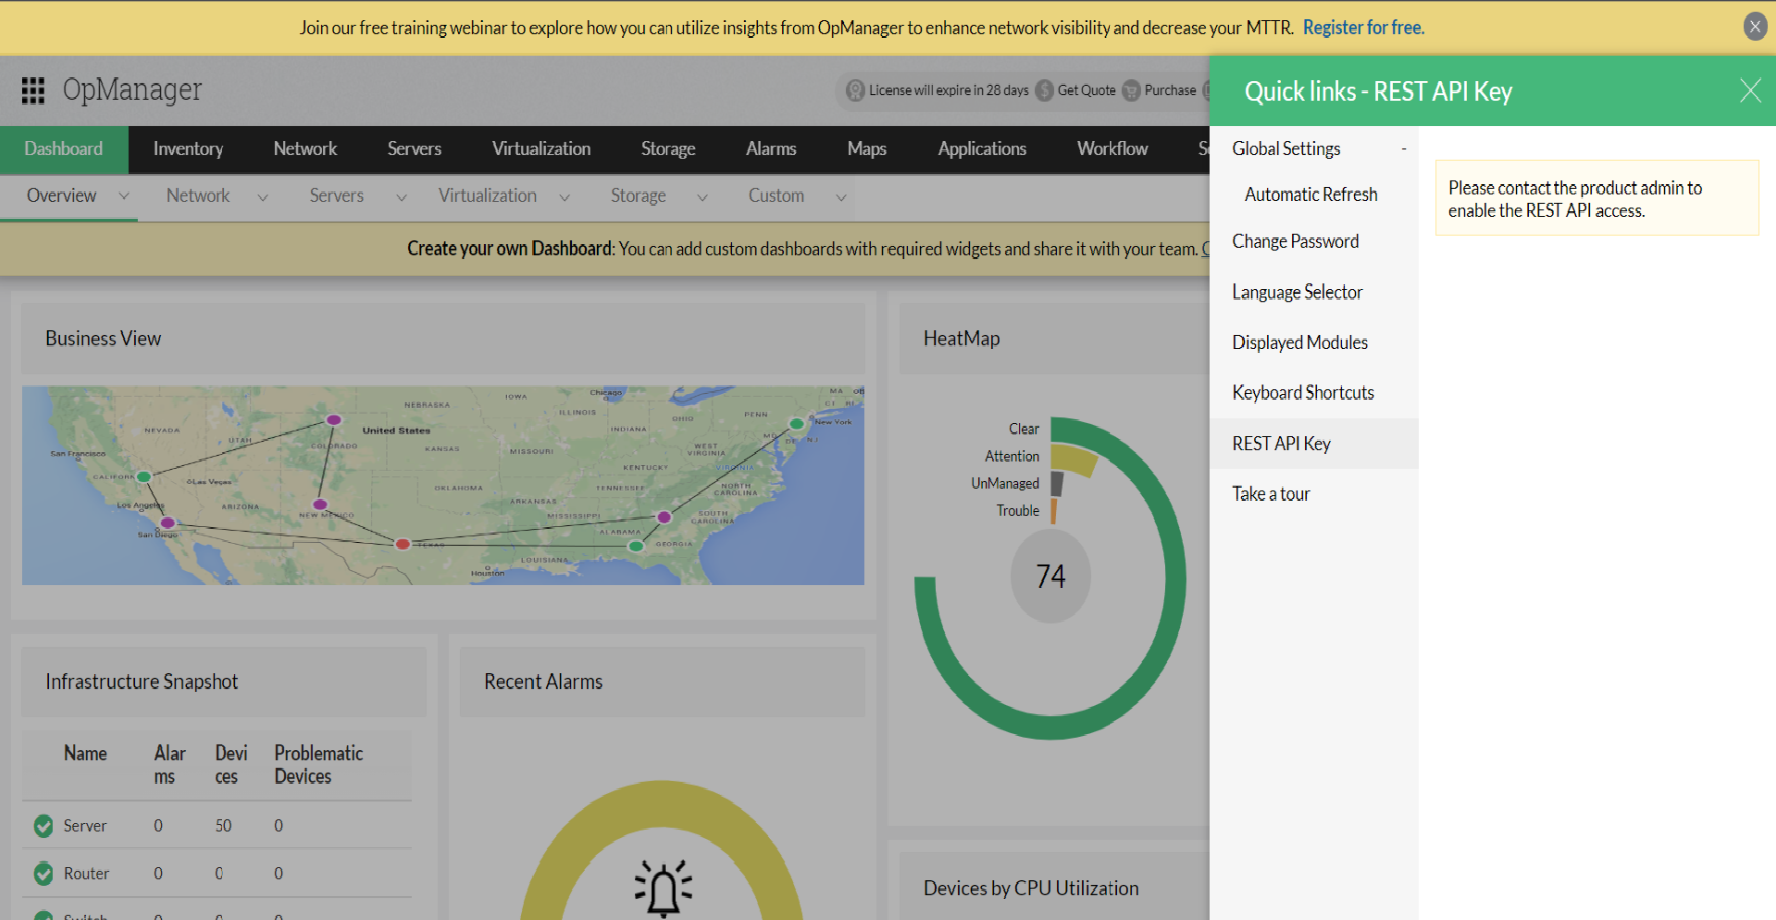
The APIs work with an API key. The API key is unique for each OpManager account and is mandatory for all API requests. Learn how to enable or disable Rest API keys
How to view an API Key?
To view or copy an API key, go to Quick links > Rest API Key option in OpManager web client.(The quick link option is the Gear icon on the top right corner)
How to send an apiKey?
The functionality of request parameter-based apiKey authentication has been deprecated. Before version, 128100, the apiKey can be sent via the request parameter. From version 128100, the apiKey can now be sent either in the request header or as a request parameter.
Note: The support for request parameter based apiKey authentication will be ended soon. The following list of URLs should be called with apiKey only via the request header. ApiKey authentication based on request parameters will not work for these URLs.
A Sample configuration with header: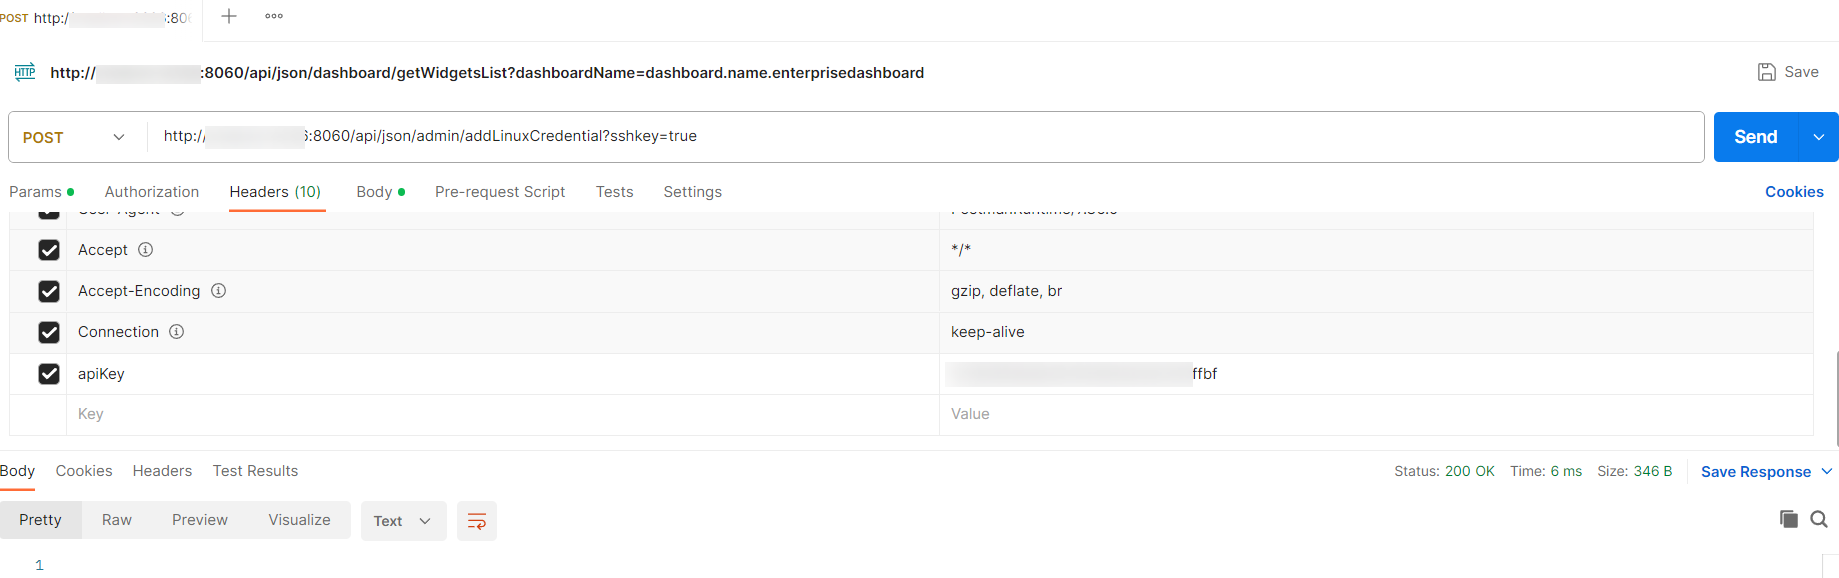
Enable/Disable Rest API access
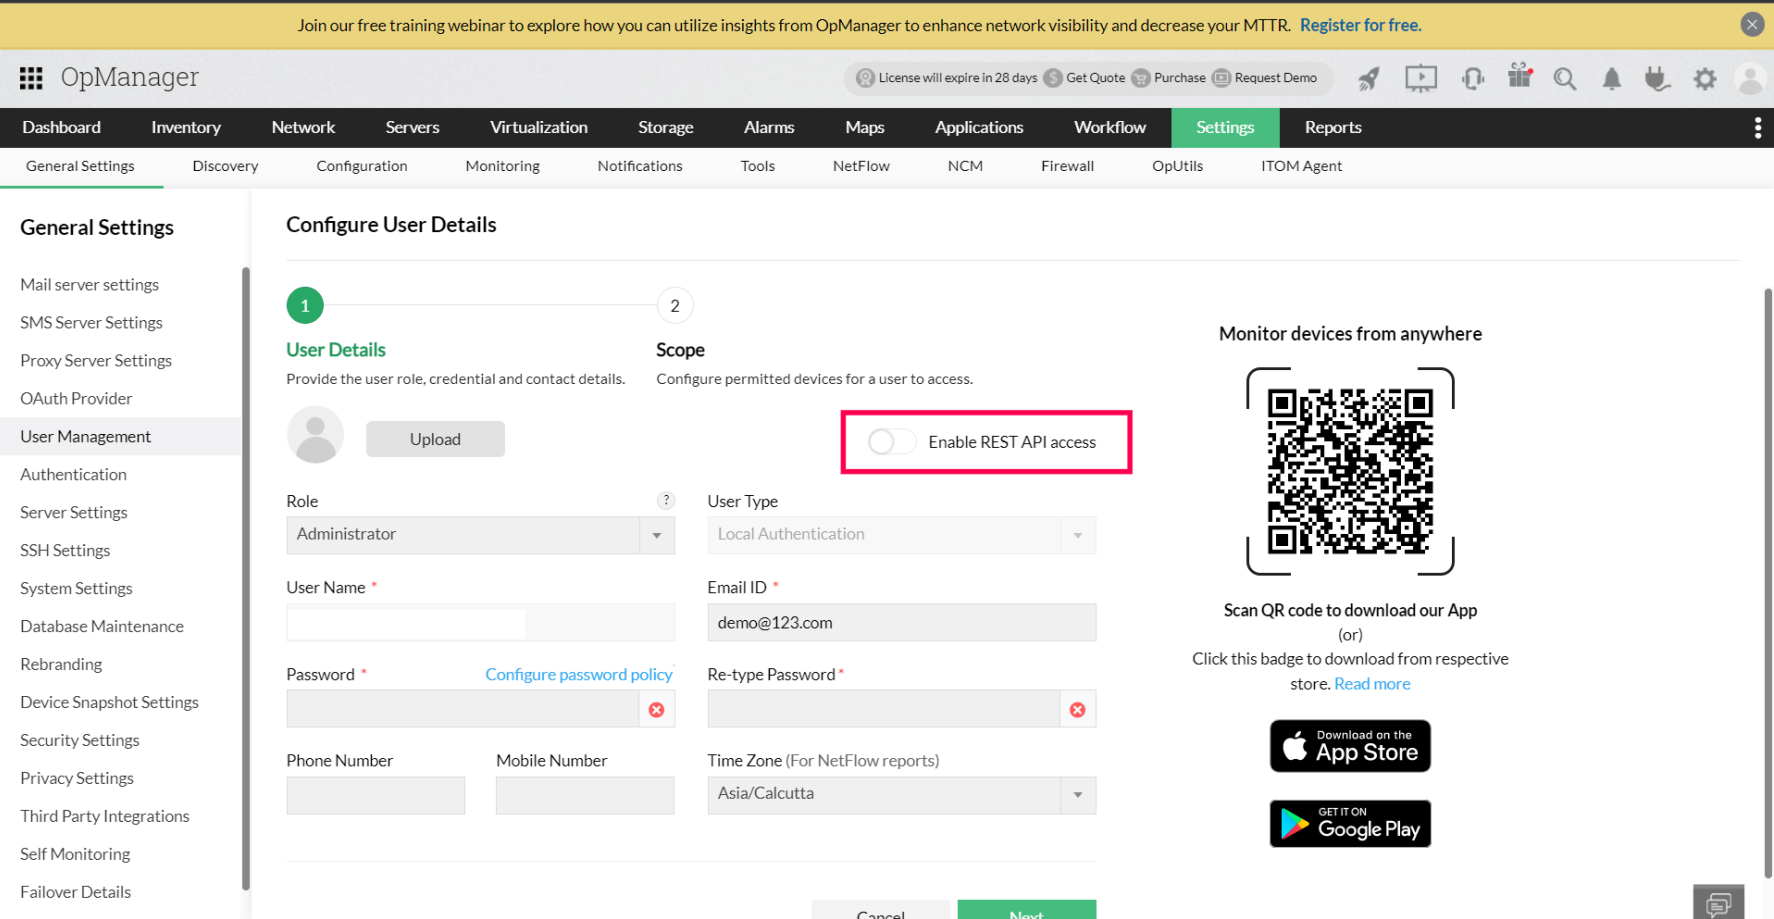
Enabling or disabling Rest API access differs based on the version of OpManager you are using. Refer to the relevant section below.
API Key Management
From version 12.8.721, the API Key Management feature has been updated with a dedicated management interface.
Accessing API Key Management
API Key Management can be accessed via Quick Links → API Key Management. This opens the API Key Management page, which lists all existing API keys along with their Name, API Key, Description, Status, API Key Type, Created By, Expires On, and Access toggle.
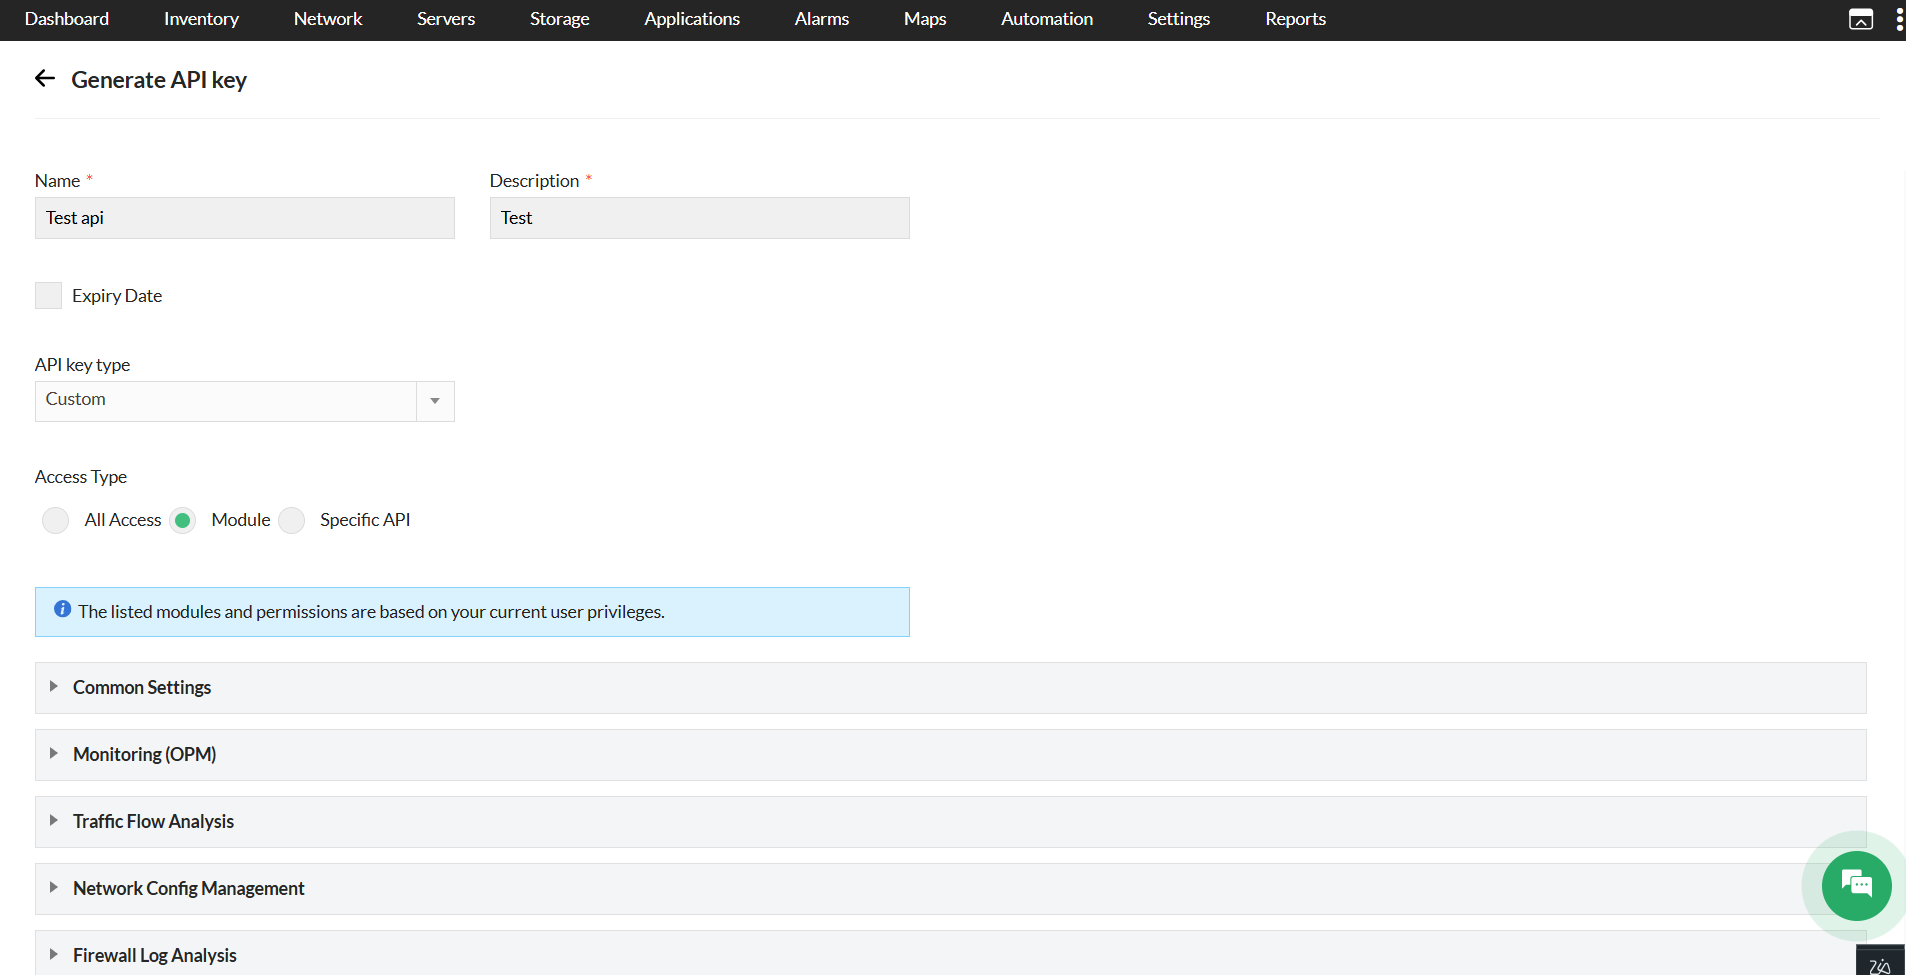
Generating an API Key
To generate a new API key, click the Generate API key button on the top right of the API Key Management page. Fill in the following details:
- Name – A label for the API key.
- Description – A brief description of its purpose.
- Expiry Date – Check the box to set an expiry date; leave unchecked for a key that never expires.
- API Key Type – Choose between Custom or MCP.
- Access Type – Select one of the
following:
- All Access – The key grants access to all APIs available to the user. Once generated, this API key will grant access to all APIs. Choose Module or Specific API to limit access.
- Module – Restricts access based
on selected modules. When this option is selected, a
list of modules is displayed grouped by category (e.g.,
Common Settings), with permission levels that can be set
individually for each module:
- Read/Write – Allows both read and write operations on the module.
- Read – Allows read-only access to the module.
- No Access – Blocks all
access to the module. This is the default for
all modules.
Kindly note that the listed modules and permissions are based on your current user privileges.
- Specific API – Restricts the key
to individually selected API endpoints. When selected, a
searchable list of available API endpoints is displayed
(e.g.,
v1/ncmsettings/getSysLogBlockedHosts,v1/nfadevice/getNFAV2TabList). You can search for specific endpoints or use Select All to include all available APIs.