Silver Peak SD-WAN Monitoring in OpManager
OpManager's SD-WAN monitoring feature provides comprehensive visibility into the health, availability, and performance of your Silver Peak SD-WAN infrastructure. You can monitor controllers, edge devices, and tunnels in real time, helping ensure optimal network performance and uptime.
This guide covers:
- Discovering Silver Peak SD-WAN devices
- Viewing the SD-WAN snapshot page
- Monitoring SD-WAN devices
- Managing SD-WAN tunnels
- Managing WAN Links
- Decommissioning SD-WAN devices
- Rediscovering SD-WAN devices
- Generating advanced reports
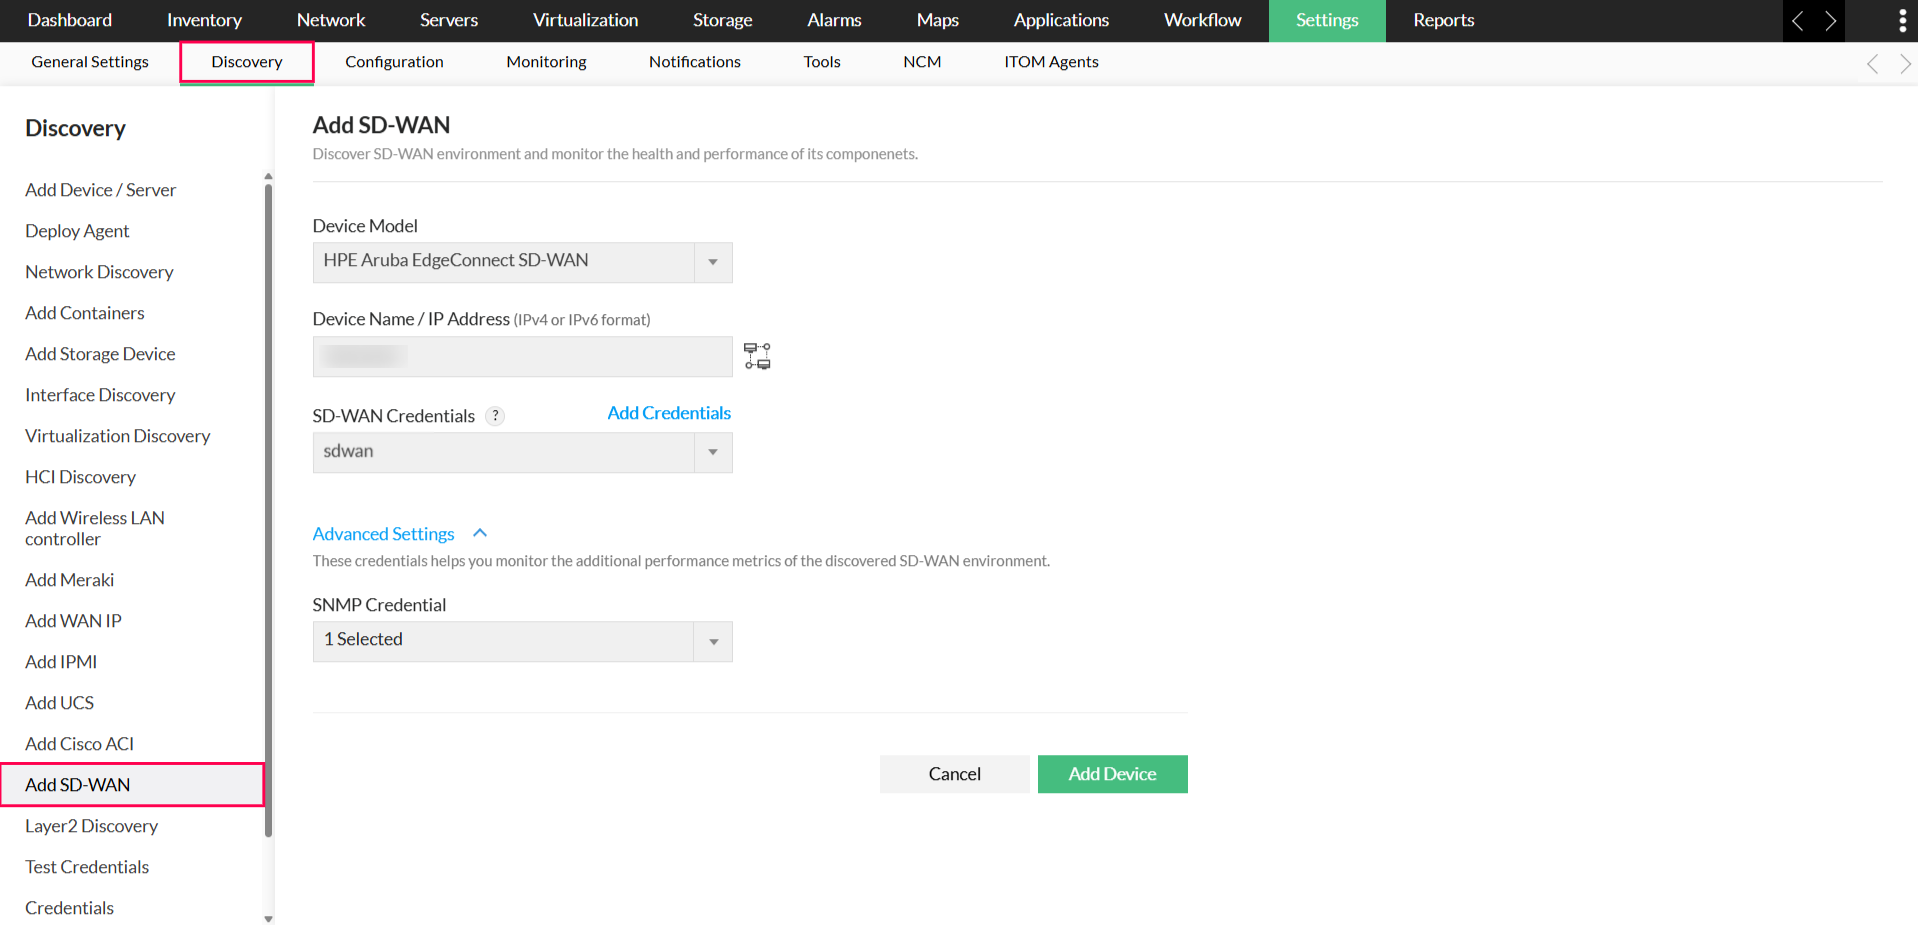
Discovering Silver Peak SD-WAN devices
To add and monitor your Silver Peak SD-WAN devices in OpManager:
- Navigate to Settings → Discovery → Add SD-WAN.
- From the list, select the Silver Peak SD-WAN model.
- Enter the IP address or hostname of the SD-WAN controller.
- Select the appropriate credentials from the drop-down or click Add Credentials to create a new one.
- Under Advanced Settings (Optional), configure authentication details for child devices.
- Click Discover to initiate the SD-WAN discovery process.
Once completed, OpManager automatically adds the controller, edge devices, tunnels and WAN links to its inventory for continuous monitoring.
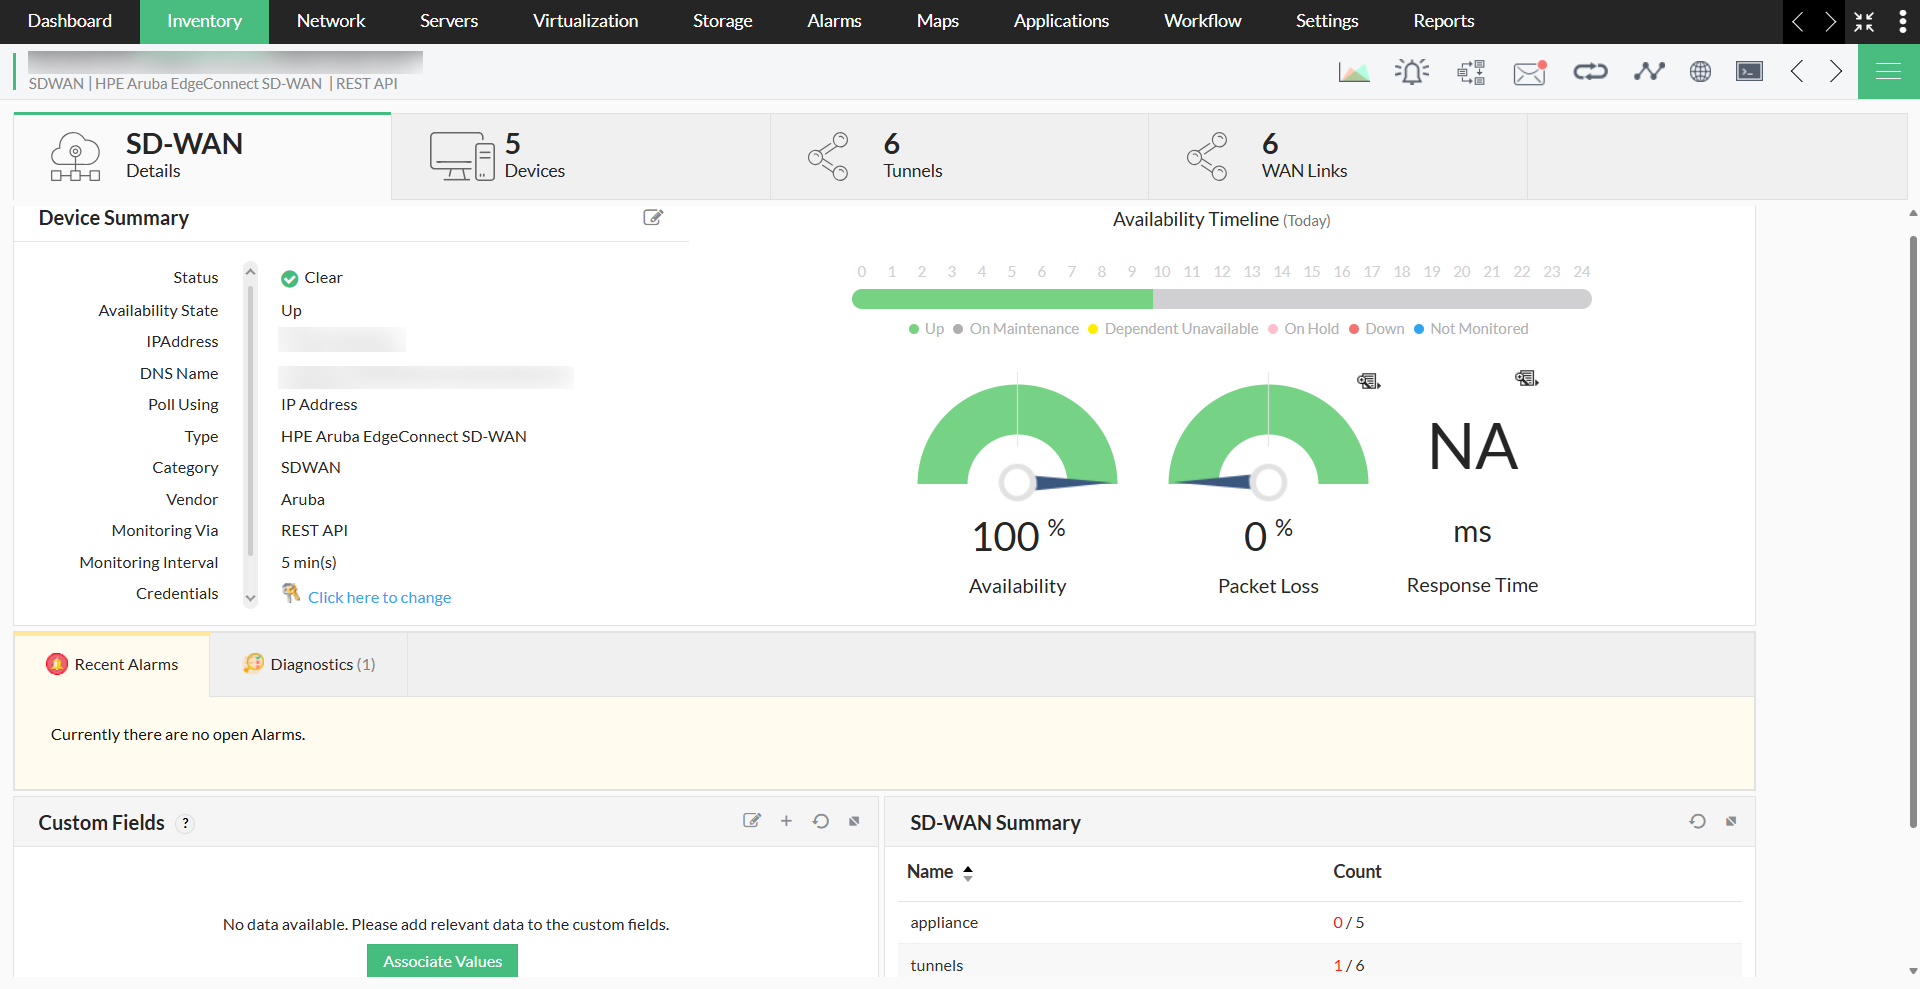
Viewing the SD-WAN snapshot page
The snapshot page provides a centralized view of the discovered Silver Peak SD-WAN device and its performance metrics.
To access the snapshot page:
- Navigate to Inventory or Network.
- Select the desired SD-WAN device.
The snapshot page displays:
- Basic Device Details - Information such as model, serial number, and IP address.
- Status & Availability - Real-time device state and uptime data.
- SD-WAN Summary - High-level overview of device performance.
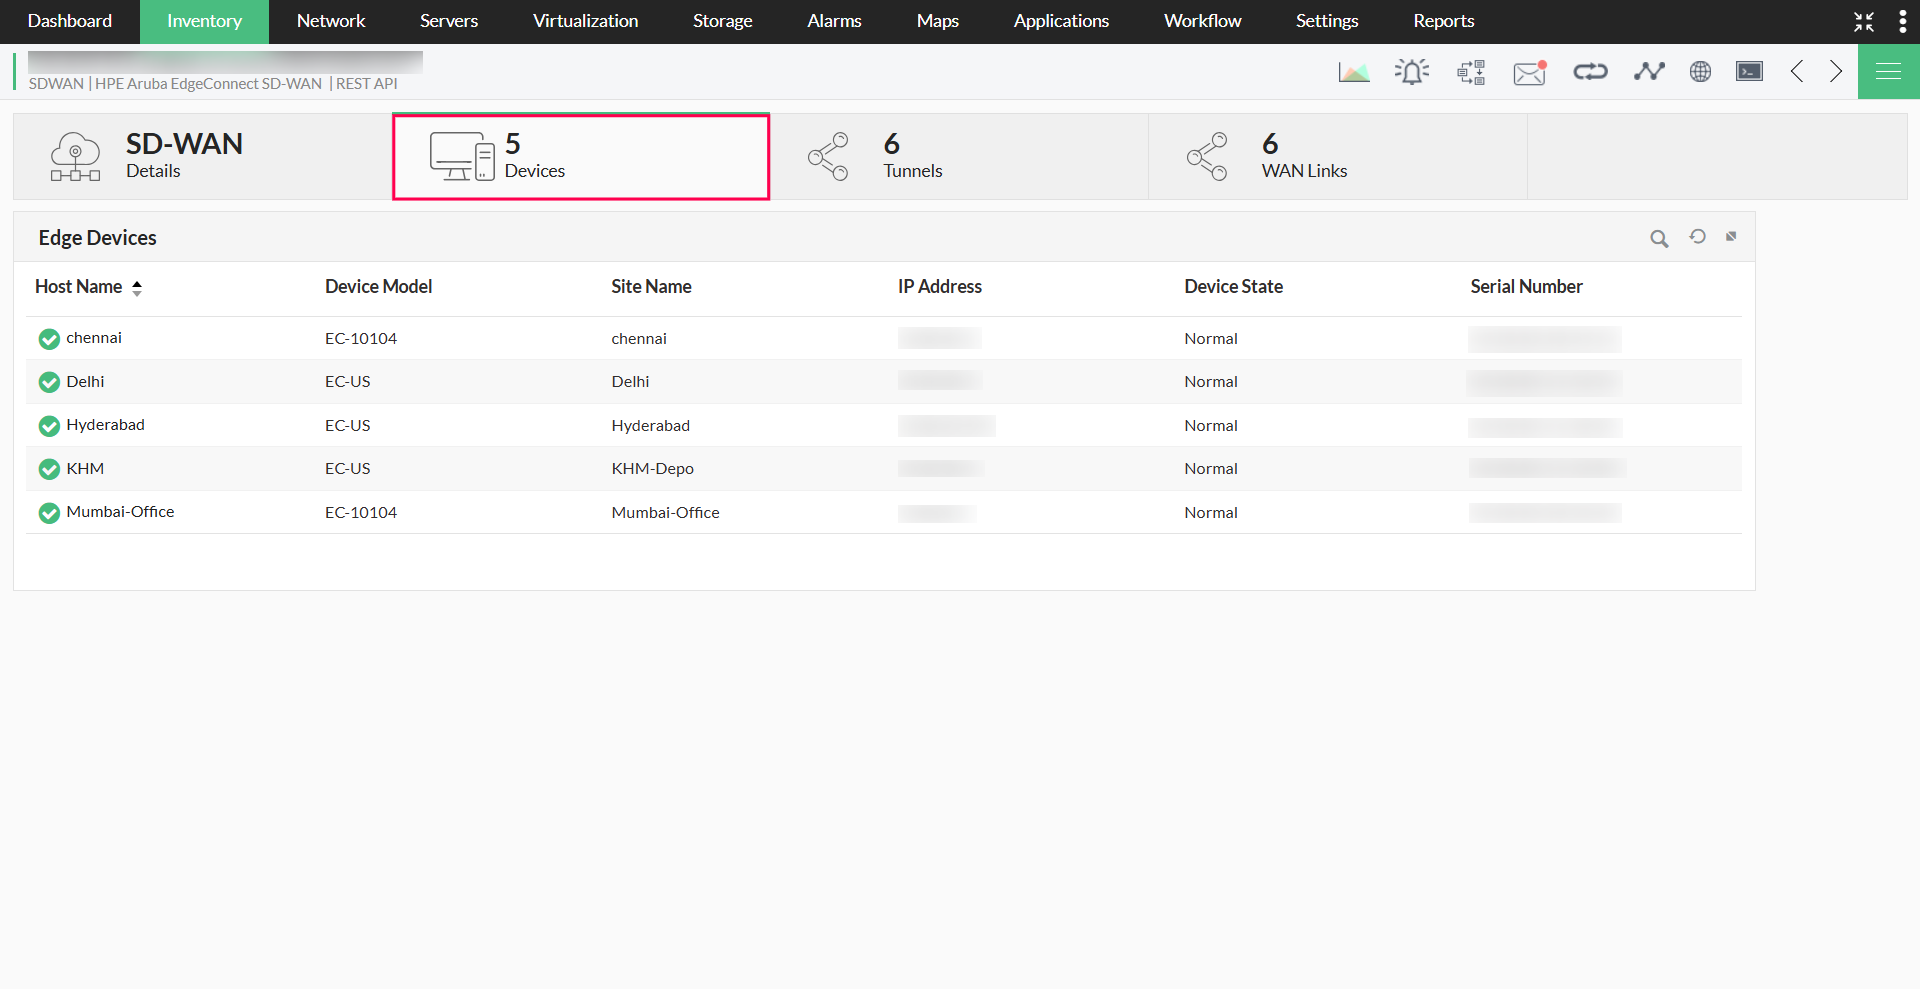
Monitoring SD-WAN devices
All discovered controllers and edge devices are listed in the Devices tab of the snapshot page.
Key metrics for controllers and edge devices:
- Host Name - Name of the controller or edge device.
- Device Model - Hardware or software version.
- Site Name - Associated SD-WAN site for the device.
- IP Address - Unique network address of the device.
- Device State - Operational status (e.g., Active, Inactive, Down).
- Serial Number - Unique manufacturer identifier.
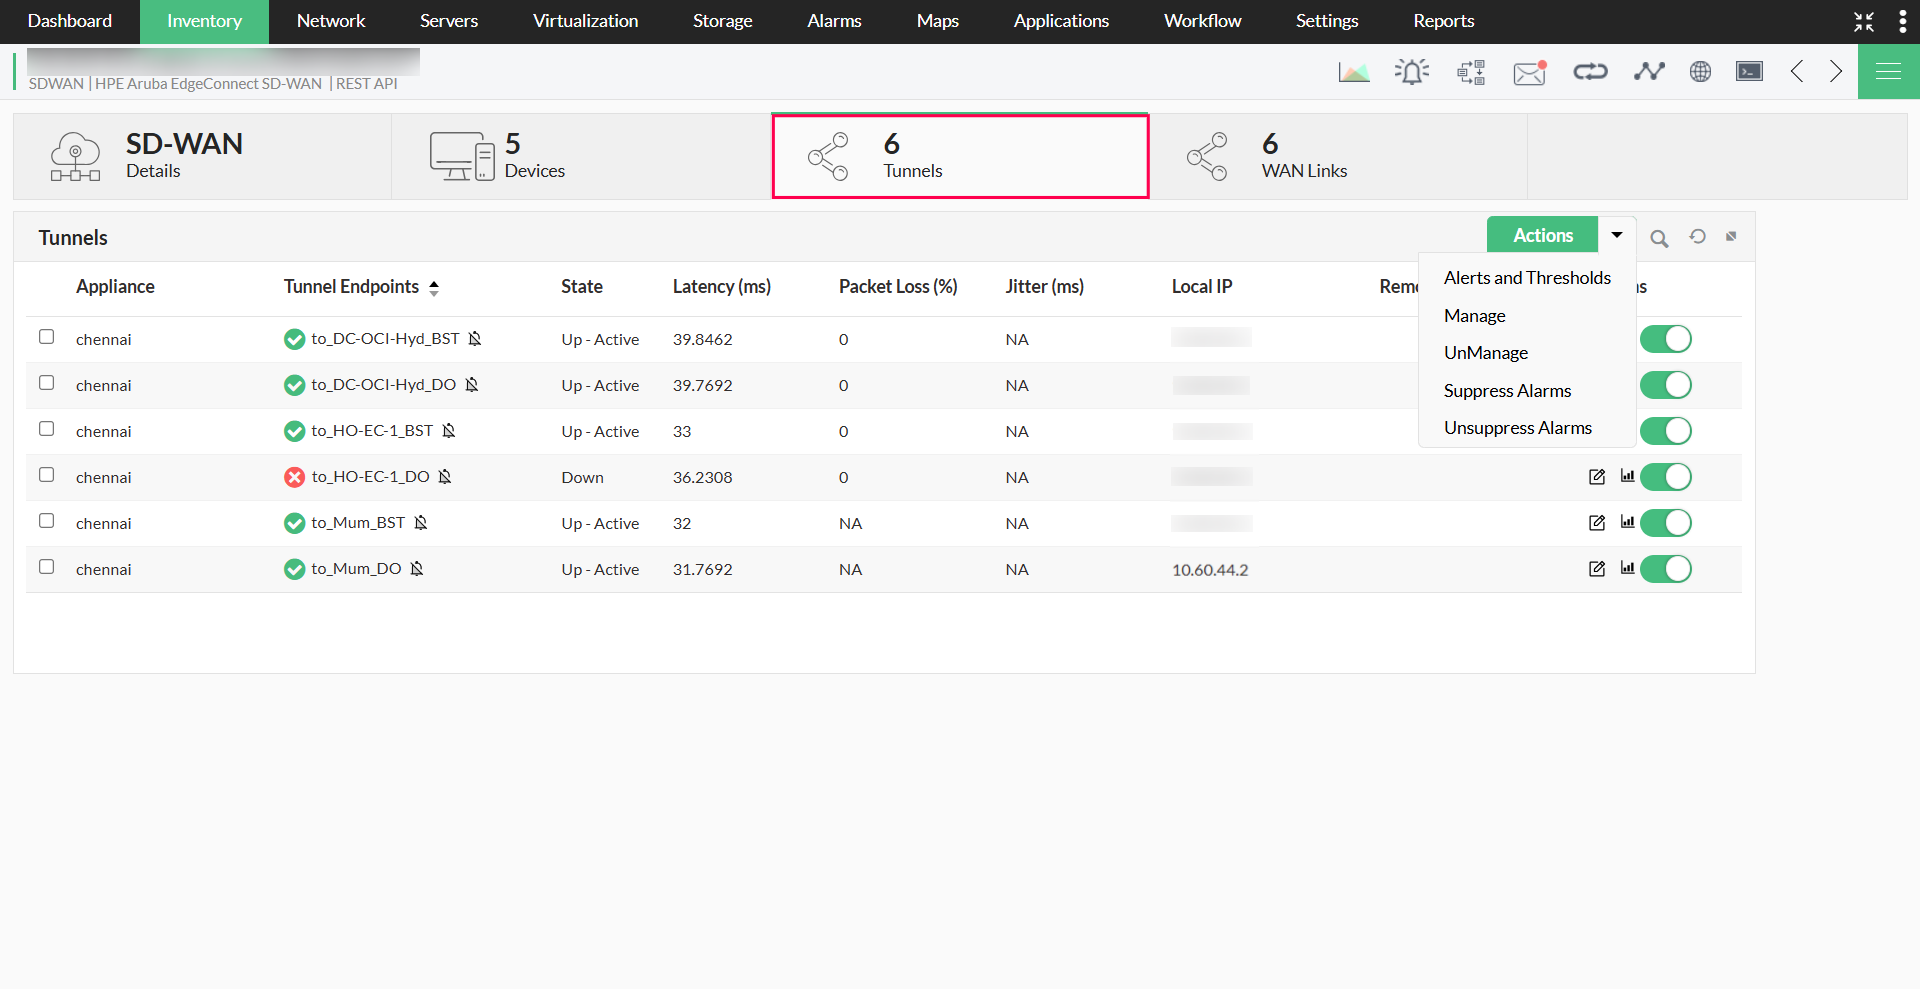
Managing SD-WAN tunnels
Tunnels are secure virtual links that carry data between SD-WAN devices. Monitoring tunnel performance ensures reliable and optimized data transmission.
Performing tunnel actions:
Using the Actions button at the top-right of the Tunnels tab, you can:
- Set performance thresholds and alert rules for key tunnel metrics.
- Manage or unmanage tunnel endpoints in bulk.
- Suppress or unsuppress alarms.
- Edit thresholds and view tunnel-specific performance graphs.
Viewing tunnel details:
Navigate to the Tunnels tab from the SD-WAN snapshot page. The Tunnels section displays the following key metrics:
- Appliance - The SD-WAN device hosting the tunnel’s local endpoint.
- Tunnel Endpoints - The source and destination devices connected by the tunnel.
- Health Status - The current operational health of the tunnel.
- State - The activity status of the tunnel (Active, Inactive, or Degraded).
- Latency (ms) - The transmission delay across the tunnel, measured in milliseconds.
- Packet Loss (%) - The percentage of packets lost during transmission.
- Jitter (ms) - The variation in latency across the tunnel.
- Local IP - The IP address of the tunnel’s local endpoint.
- Remote IP - The IP address of the tunnel’s remote endpoint.
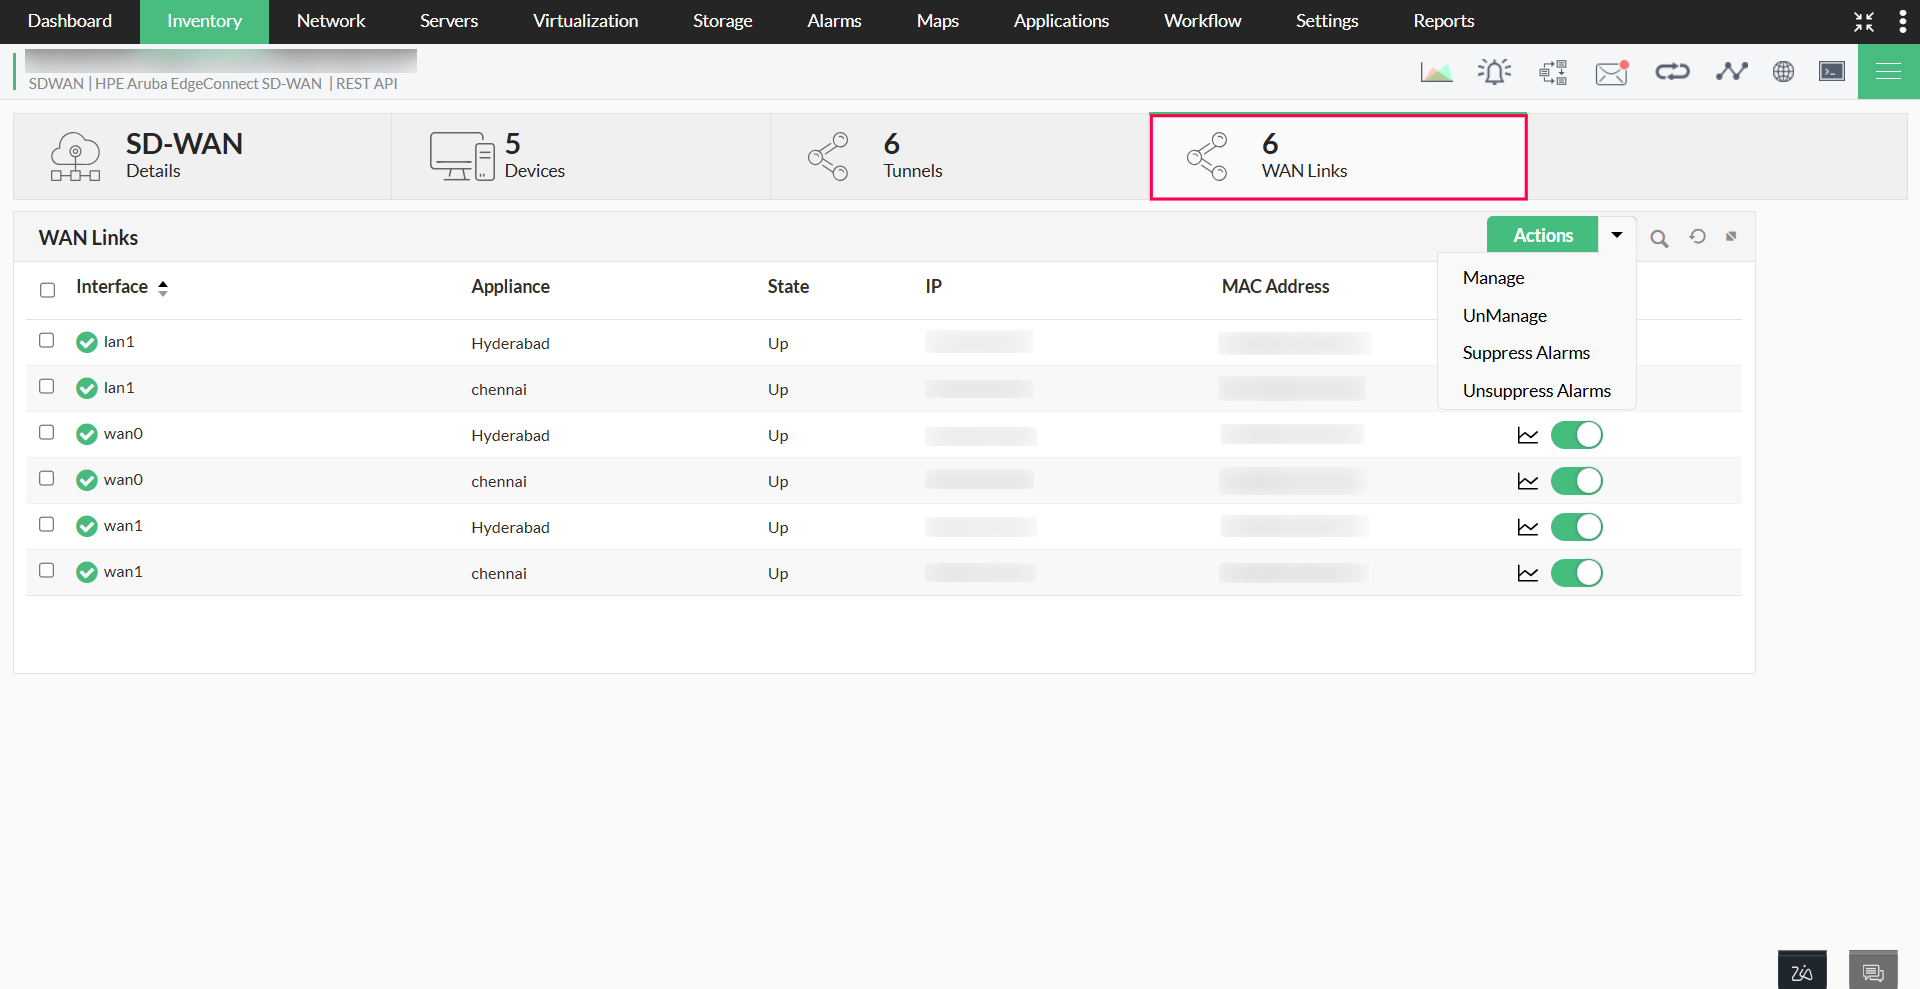
Managing WAN Links
WAN links represent the physical or virtual network connections that link SD-WAN appliances to the wider network. Monitoring these links helps ensure stable connectivity and optimal performance across your SD-WAN deployment.
Performing WAN link actions:
Using the Actions button at the top-right of the WAN Links tab, you can:
- Manage or unmanage WAN links in bulk.
- Suppress or unsuppress alarms to control notifications.
Viewing WAN link details:
Navigate to the WAN Links tab from the device snapshot page. The WAN Links section displays the following key metrics:
- Interface - The name of the WAN interface (e.g., wan0, lan1).
- Appliance - The SD-WAN device associated with the WAN link.
- State - The operational status of the WAN link (Up or Down).
- IP Address - The IP address assigned to the WAN interface.
- MAC Address - The MAC address of the WAN interface.
Decommissioning SD-WAN devices
When a Silver Peak SD-WAN device is no longer in use or has reached its End of Life (EOL):
- Mark the device as Unmanaged in OpManager.
- A decommissioning alert will be triggered, notifying administrators of its status change.
This ensures your network inventory remains accurate and up-to-date.
Note: When a device is deleted from OpManager, all its associated tunnels will be deleted as well.
Rediscovering SD-WAN
Rediscovery updates device details when there are hardware changes, interface updates, or configuration adjustments. To rediscover a Silver Peak SD-WAN device:
- Open the device snapshot page.
- Click the menu icon (top-right corner) and select Rediscover Device.
- Choose an existing credential or add a new one.
- Click Rediscover Now.
OpManager will refresh the device’s data and update its inventory records.
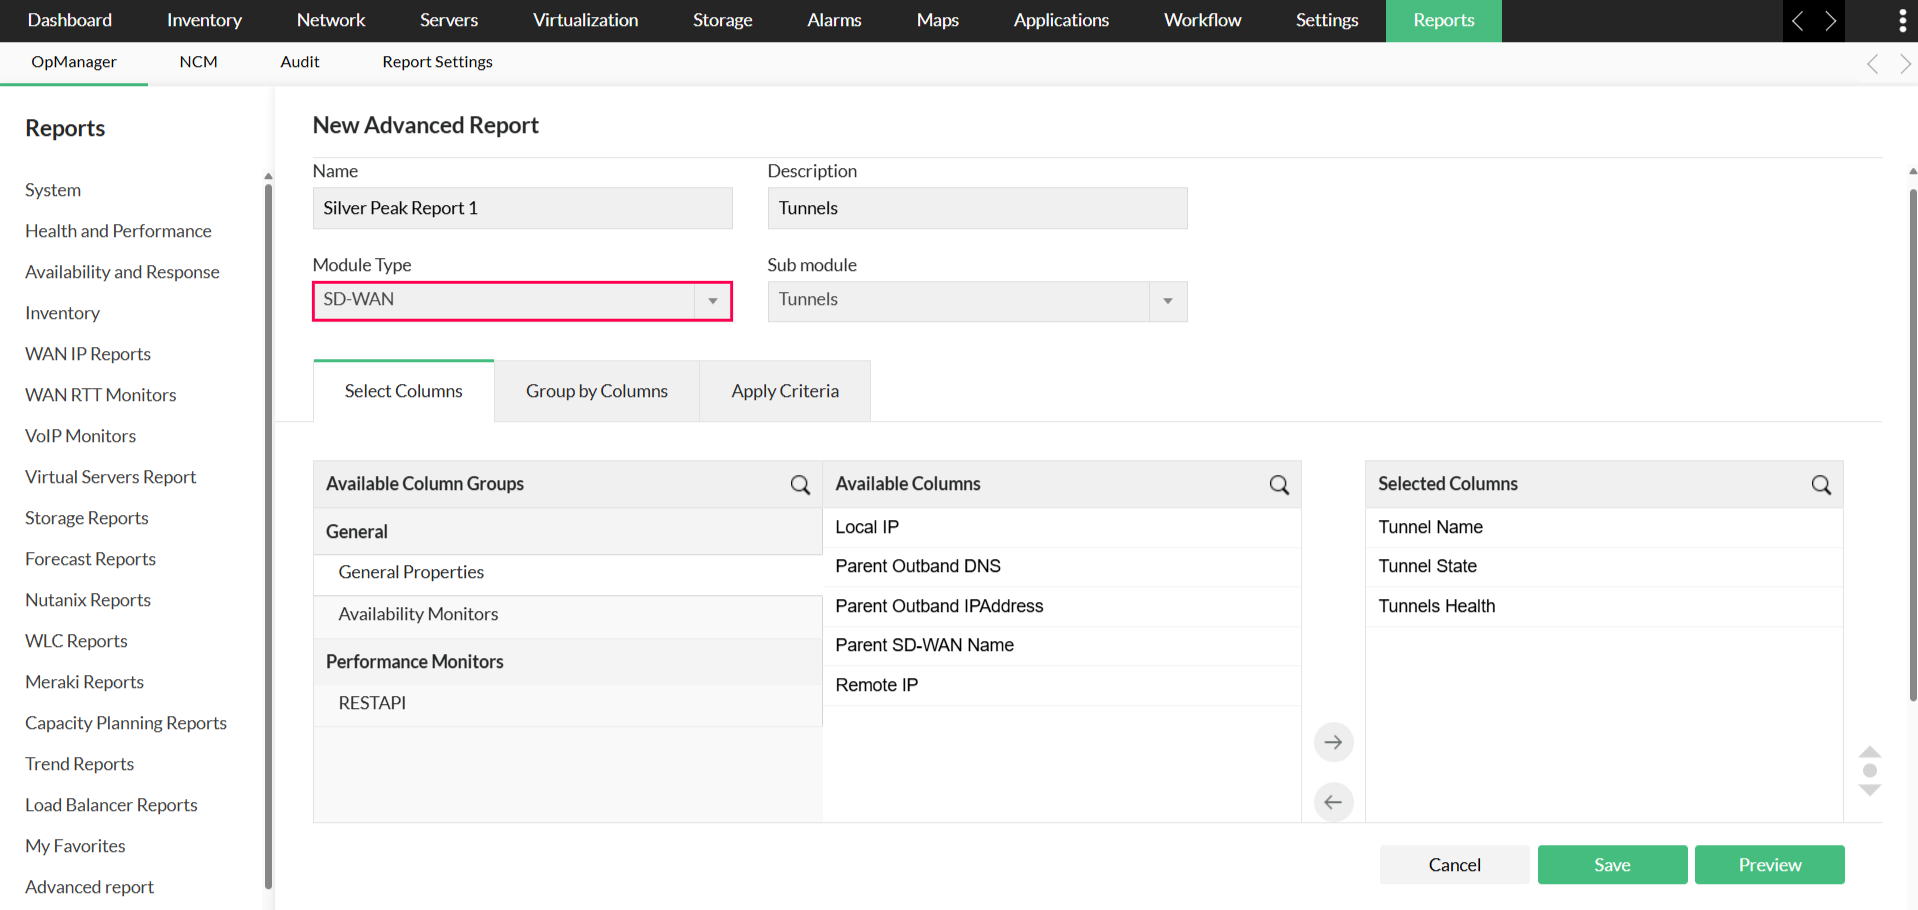
Generating advanced reports
OpManager’s Advanced Report allows you to create custom reports with SD-WAN performance data. To create an advanced SD-WAN report:
- Go to Reports → OpManager → Advanced Report.
- Click Create New Report (top-right corner).
- Select SD-WAN as the Module Type.
- Add filters, performance monitors, and grouping options.
- Save and generate the report.
Click here for detailed steps on creating an advanced report in OpManager.