Storage Reports
OpManager helps you get crucial insights on the performance of your network storage using intuitive reports. Reports help you with both real-time monitoring and historical stat analysis of your network.
Storage reports are available under Reports → Storage Reports.
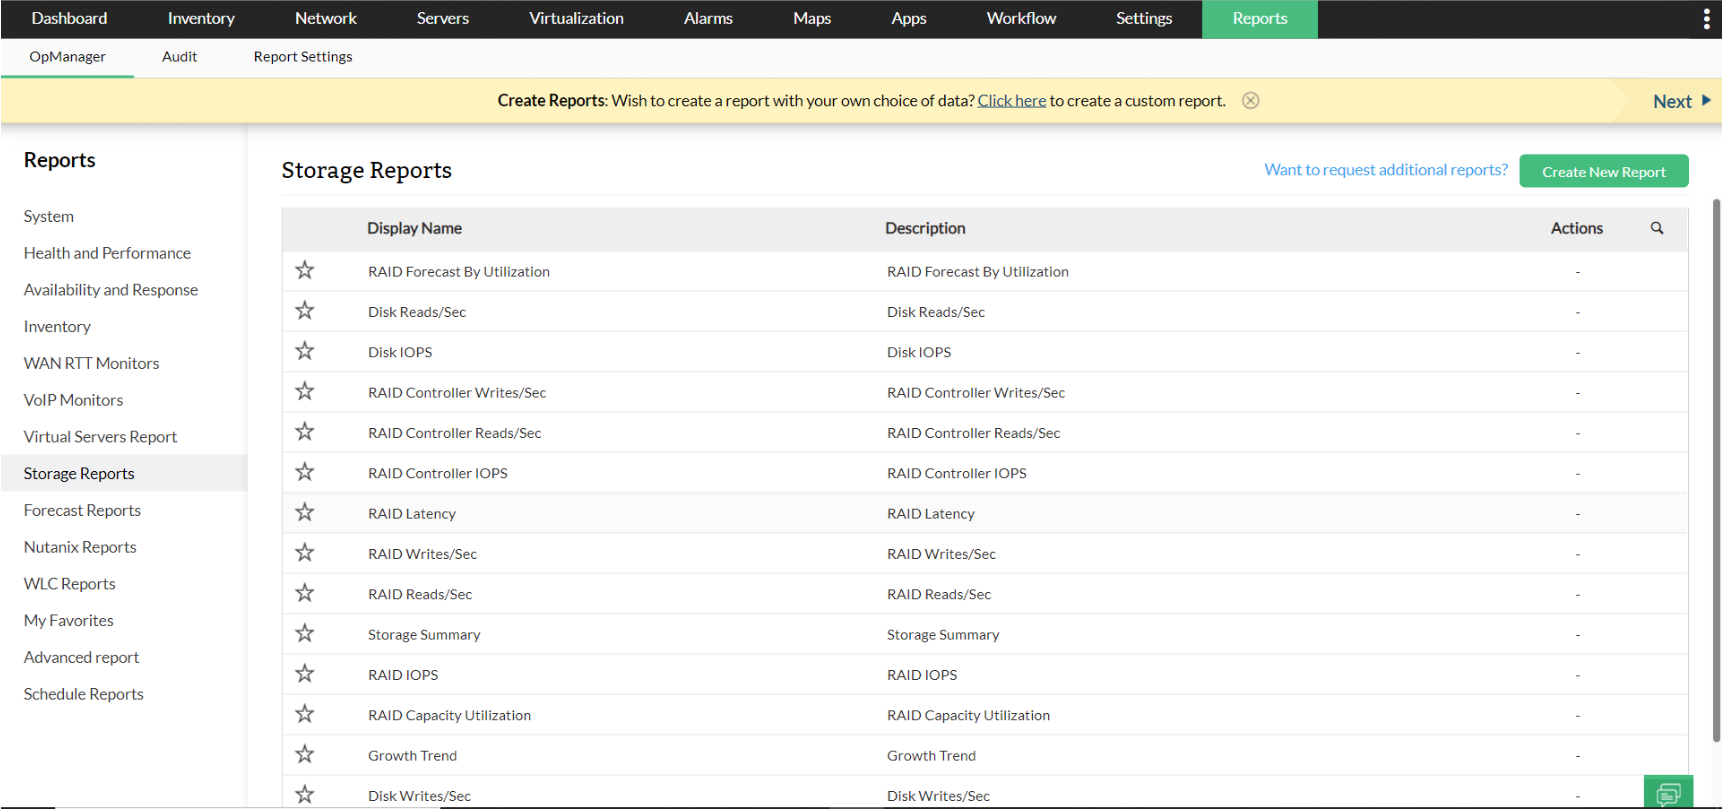
Following are the storage reports available in OpManager.
| Report Name | Description | Available Columns | Available Filters |
|---|---|---|---|
| Growth Trend | This report analyzes the growth pattern of storage utilization over time for various monitored storage devices. It provides a comparative view of the storage usage at the start and end of a defined period, enabling identification of devices experiencing significant growth or decline. The report also projects future utilization based on current trends, helping in capacity planning and proactive resource management. | Device Name, Monitor Name, Start Utilization (Min/Max/Avg), End Utilization (Min/Max/Avg), Growth Rate (%), Growth Rate per Day, Future Utilization (Avg) | Period, Time Window / Business Hour |
| Disk Writes/Sec | This report presents the rate of disk write operations per second for monitored storage devices. It helps assess the write performance and workload of various storage components by showing the minimum, maximum, and average write rates. | Storage Device, Component, Minimum Writes/Sec, Maximum Writes/Sec, Average Writes/Sec | Period, Time Window / Business Hour |
| Disk Reads/Sec | This report highlights the rate of disk read operations per second across various storage devices. It provides insight into how intensively each device is being accessed for reading data. | Storage Device, Component, Minimum Reads/Sec, Maximum Reads/Sec, Average Reads/Sec | Period, Time Window / Business Hour |
| Disk IOPS | This report provides information on the Input/Output Operations Per Second (IOPS) for various storage devices. IOPS is a key metric in evaluating the responsiveness and performance of storage systems. | Storage Device, Component, Minimum IOPS, Maximum IOPS, Average IOPS | Period, Time Window / Business Hour |
| RAID Controller Writes/Sec | This report monitors the write operations per second at the RAID controller level, helping assess how efficiently it handles write requests across connected storage devices. | Storage Device, Component, Minimum Writes/Sec, Maximum Writes/Sec, Average Writes/Sec | Period, Time Window / Business Hour |
| RAID Controller Reads/Sec | This report tracks the read operations per second at the RAID controller level, offering insights into the performance of handling read requests from storage devices. | Storage Device, Component, Minimum Reads/Sec, Maximum Reads/Sec, Average Reads/Sec | Period, Time Window / Business Hour |
| RAID Controller IOPS | This report monitors IOPS at the RAID controller level, helping evaluate its performance in handling read/write operations per second. | Storage Device, Component, Minimum IOPS, Maximum IOPS, Average IOPS | Period, Time Window / Business Hour |
| RAID Latency | This report measures the latency for read and write operations at the RAID controller level, tracking response times to I/O requests. | Storage Device, Component, Minimum Latency, Maximum Latency, Average Latency | Period, Time Window / Business Hour |
| RAID Writes/Sec | This report tracks the write operations per second at the RAID controller level, helping assess write performance and efficiency. | Storage Device, Component, Minimum Writes/Sec, Maximum Writes/Sec, Average Writes/Sec | Period, Time Window / Business Hour |
| RAID Reads/Sec | This report tracks the read operations per second at the RAID controller level to evaluate performance under read-intensive workloads. | Storage Device, Component, Minimum Reads/Sec, Maximum Reads/Sec, Average Reads/Sec | Period, Time Window / Business Hour |
| RAID IOPS | This report tracks IOPS at the RAID controller level, helping assess the storage system’s responsiveness under varying loads. | Storage Device, Component, Minimum IOPS, Maximum IOPS, Average IOPS | Period, Time Window / Business Hour |
| RAID Capacity Utilization | This report tracks capacity utilization of RAID storage devices, identifying those nearing or under-utilizing their capacity. | Storage Device, Component, Minimum Capacity Utilization, Maximum Capacity Utilization, Average Capacity Utilization | Period, Time Window / Business Hour |
| Storage Summary | This report provides an overview of the storage infrastructure, including details on ports, drives, disk usage, and RAID systems. It summarizes operational, unused, and problematic hardware for better resource optimization. | Switch Summary: Operational, unused, problematic, and connected ports Library Summary: Total, operational, and problematic drives Disk Summary: Total disks, online/offline, spare disks RAID Summary: Drives, system capacity, config capacity, used, and free capacity | None |
Want to request additional reports? Click here.
To know more about the Available Filters in various reports of OpManager, Click here.