Different Types of Views
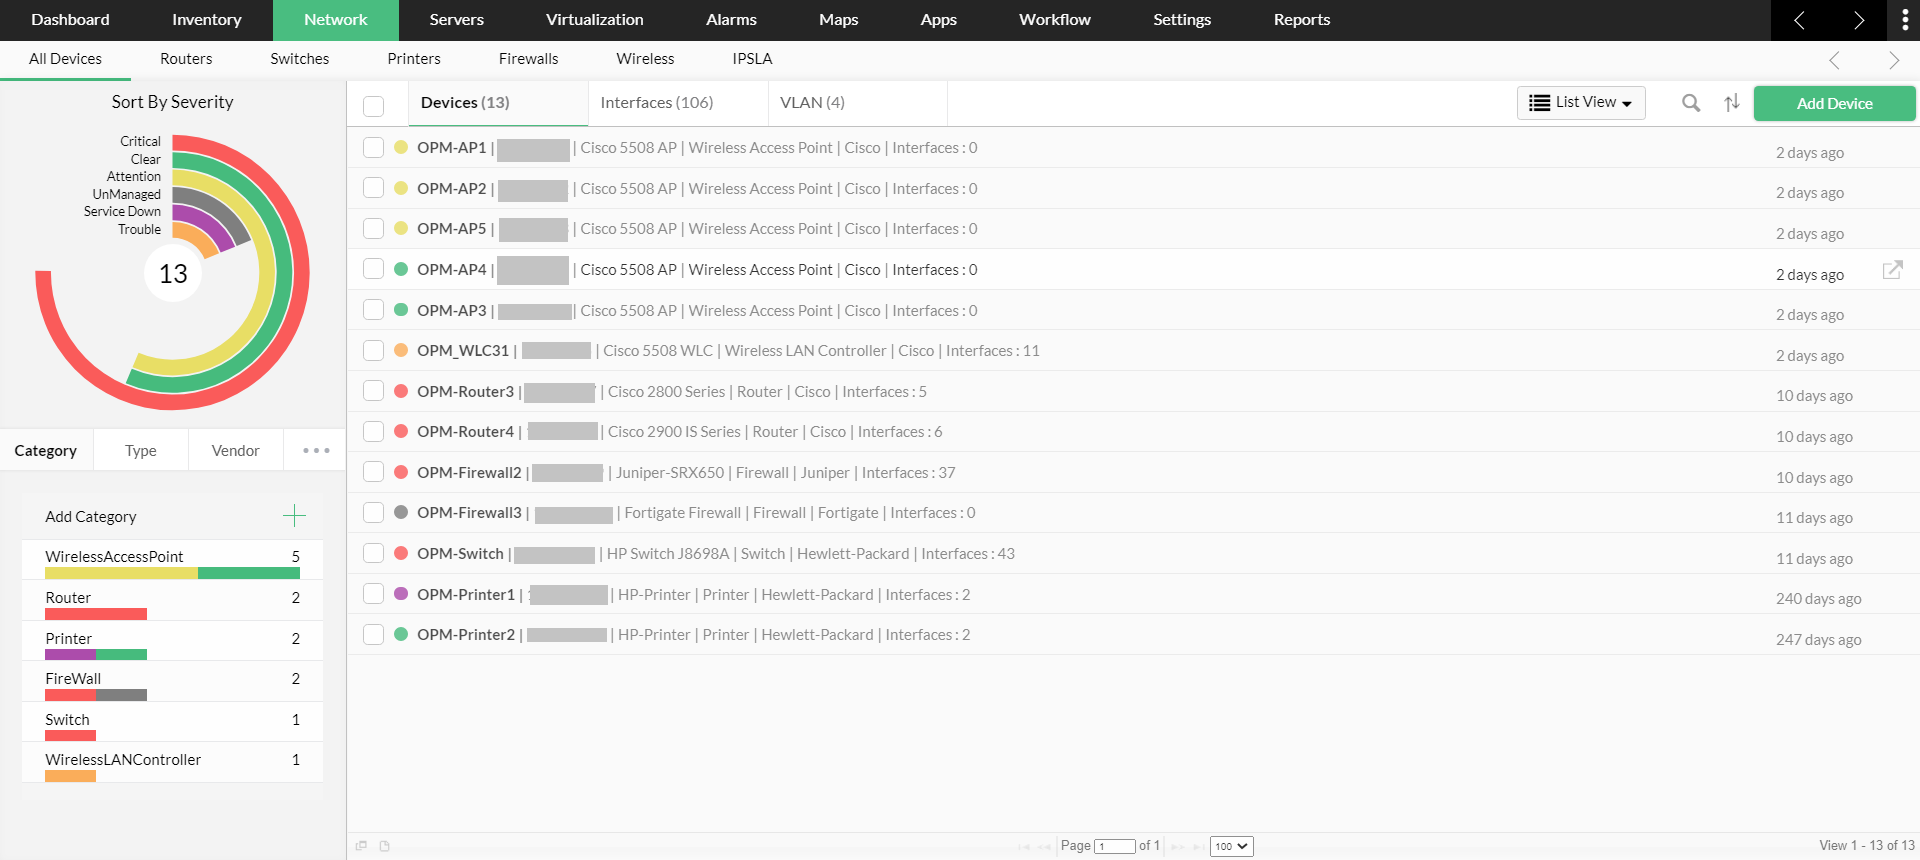
OpManager helps you visualize your entire network health in real-time with the help of built-in views. This can be accessed from Network -> All Devices. There are five different set of views available in OpManager,
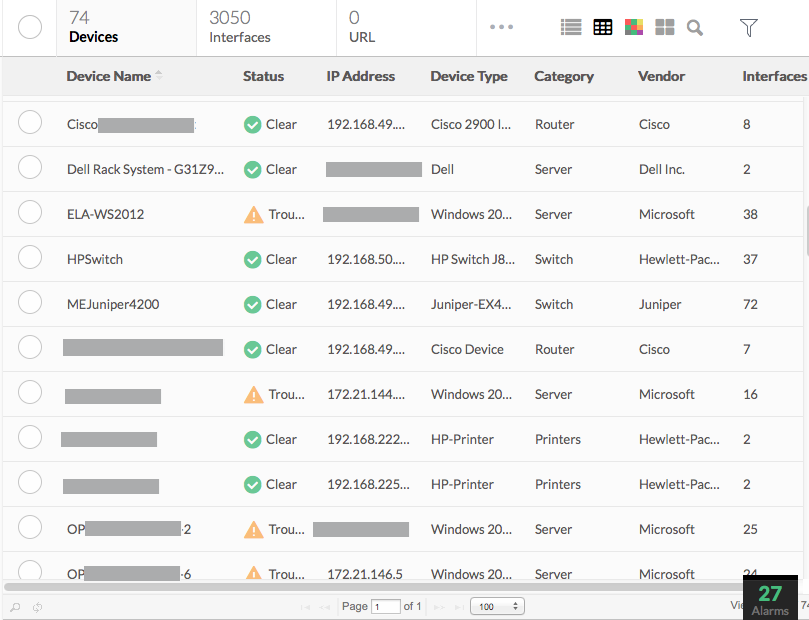
Table View
This view is similar to that of an Inventory. You can find details such as the device name, its availability status, the interfaces associated, type, vendor, etc.
List View
Lists the devices in your network with basic information such as IP address, name and type.
Heat Map View
Helps you visualize your network health with the help of color codes to communicate the severity of the monitored device.

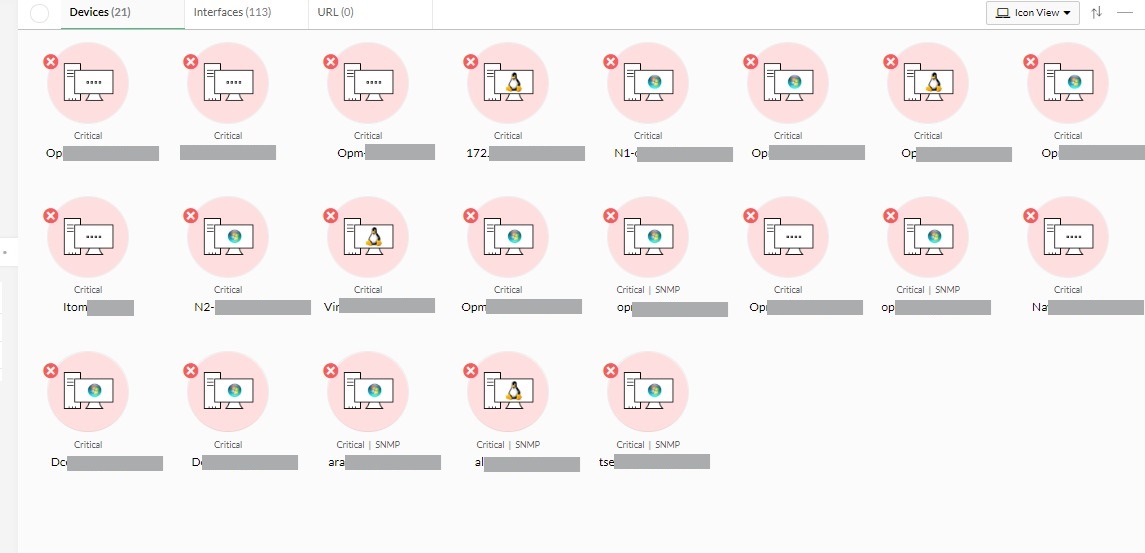
Icon View
The devices in your network will be displayed in the form of icons with the respective device name and its availability status.
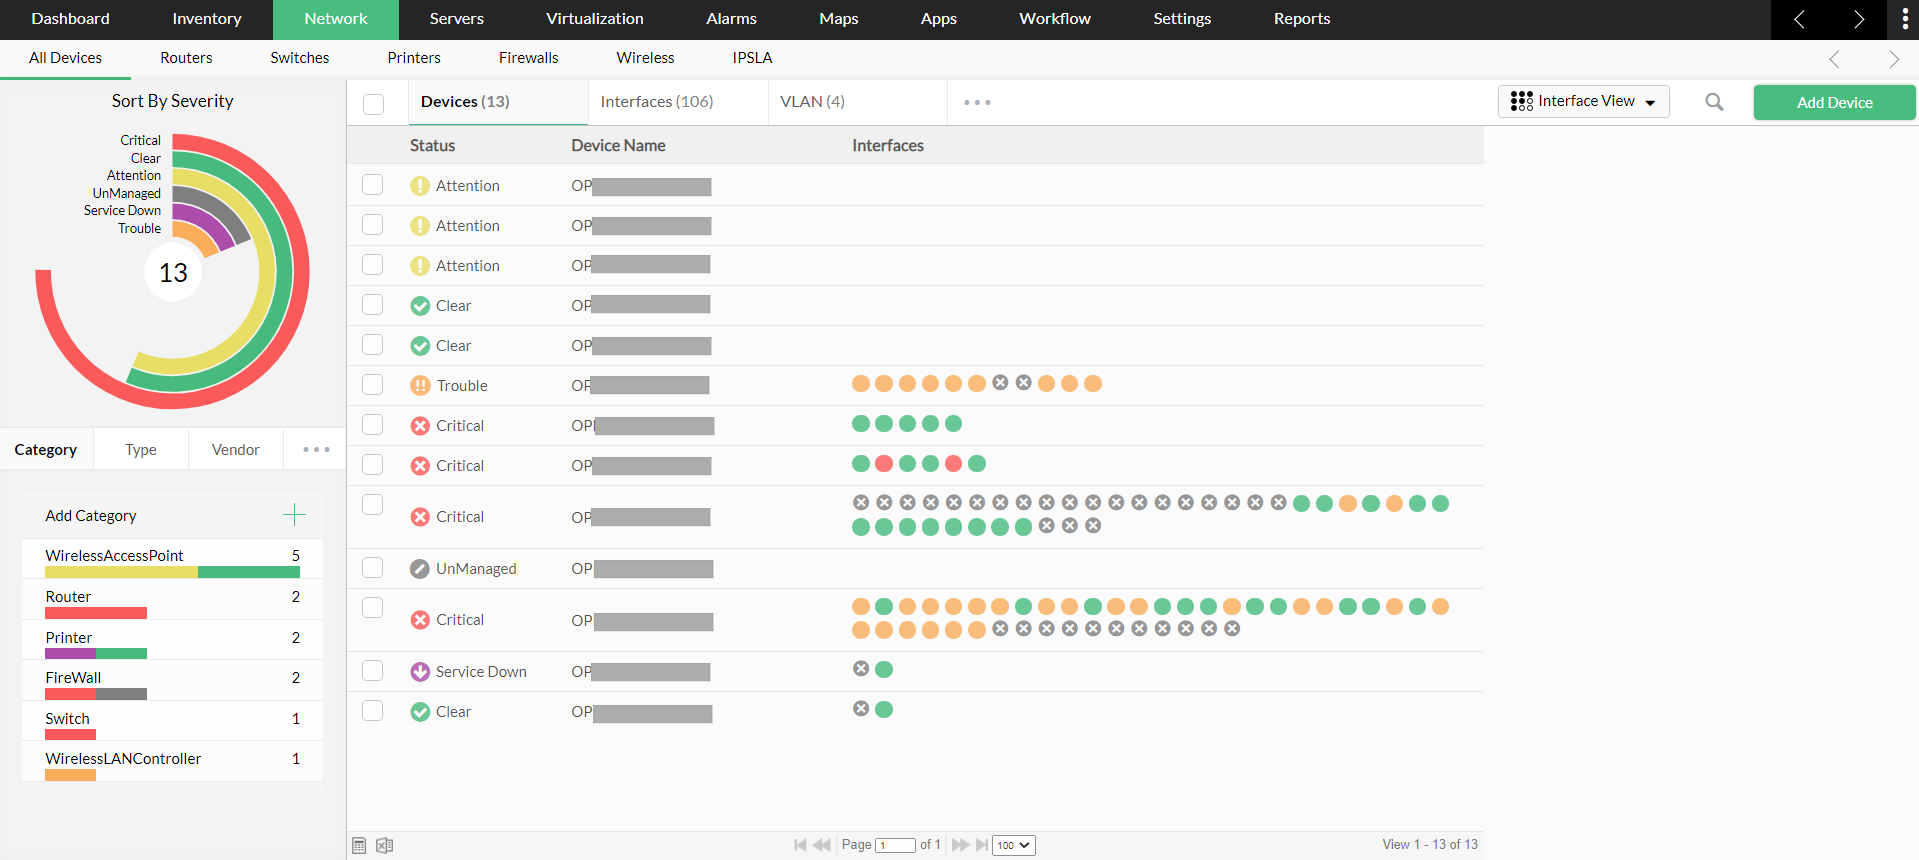
Interface View
This view lists devices with the associated interfaces in the form of colour codes. These color codes represent the current status of the interface.
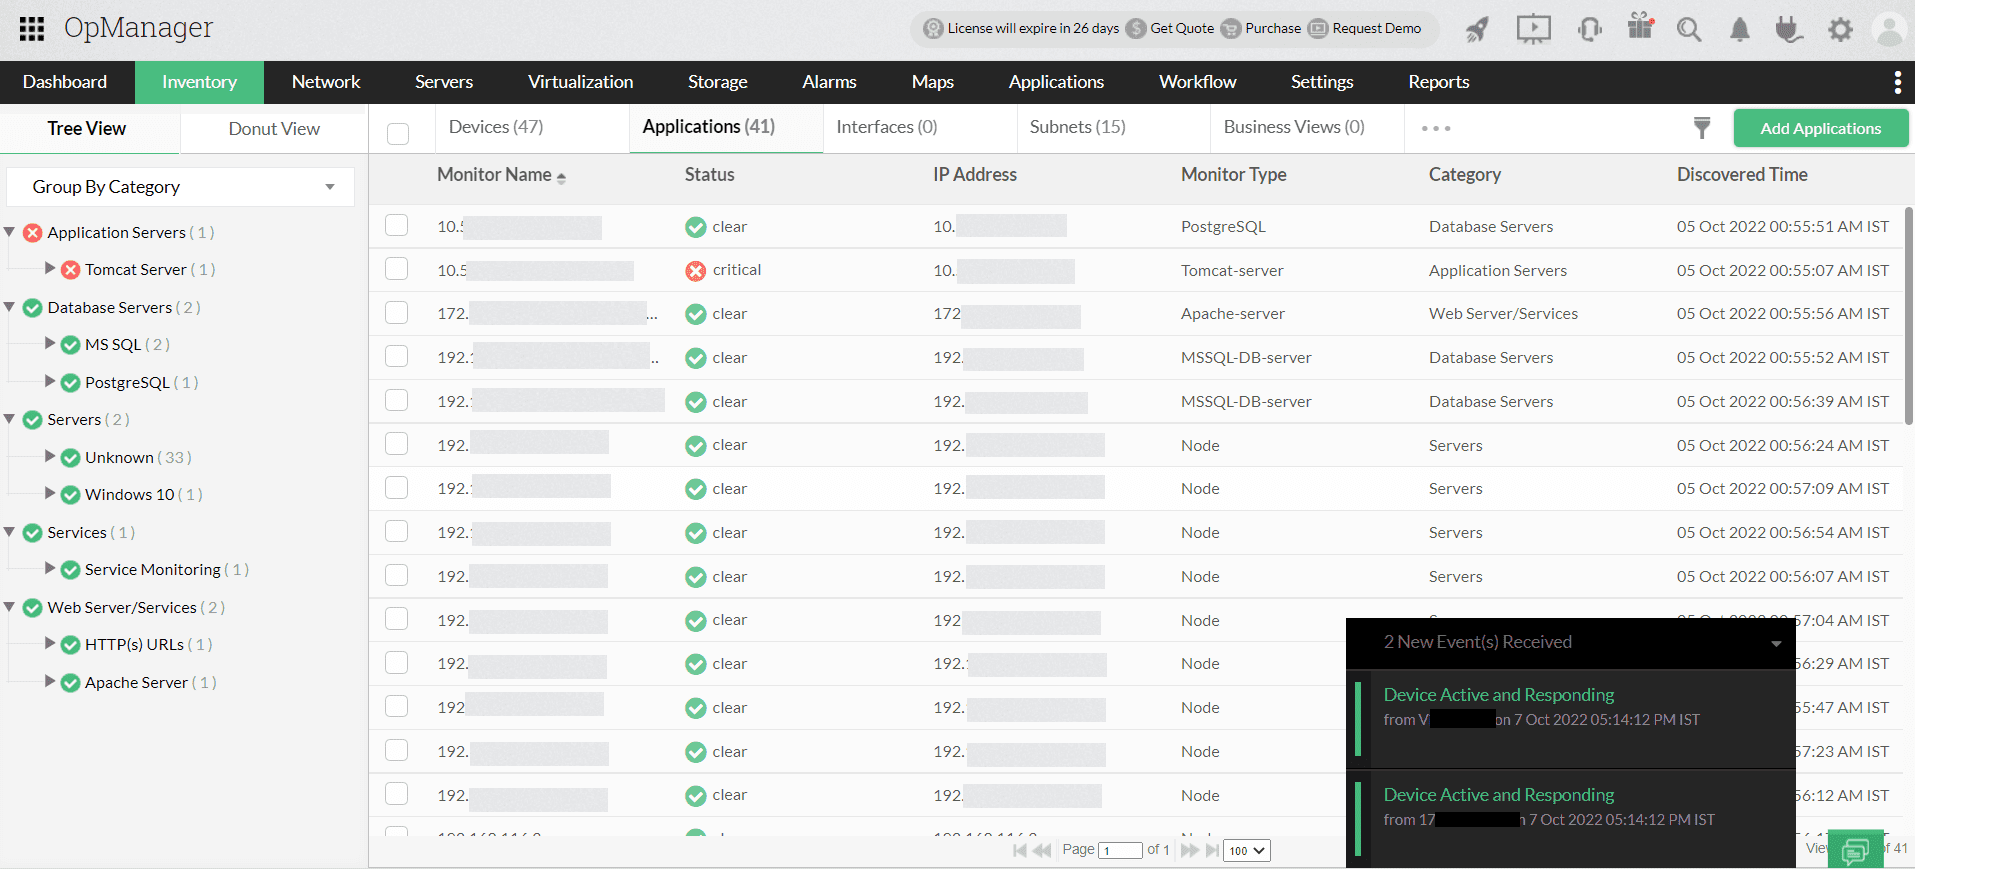
Applications Tab View
This tab provides useful insights on the list of applications monitored using the APM plugin along with additional details such as availability status, category, discovered time, etc.
