Viewing Active Processes
OpManager provides you the information on the processes that are currently running on the managed device. For this, OpManager uses the protocol of the default credential of that device (WMI / CLI / SNMP).
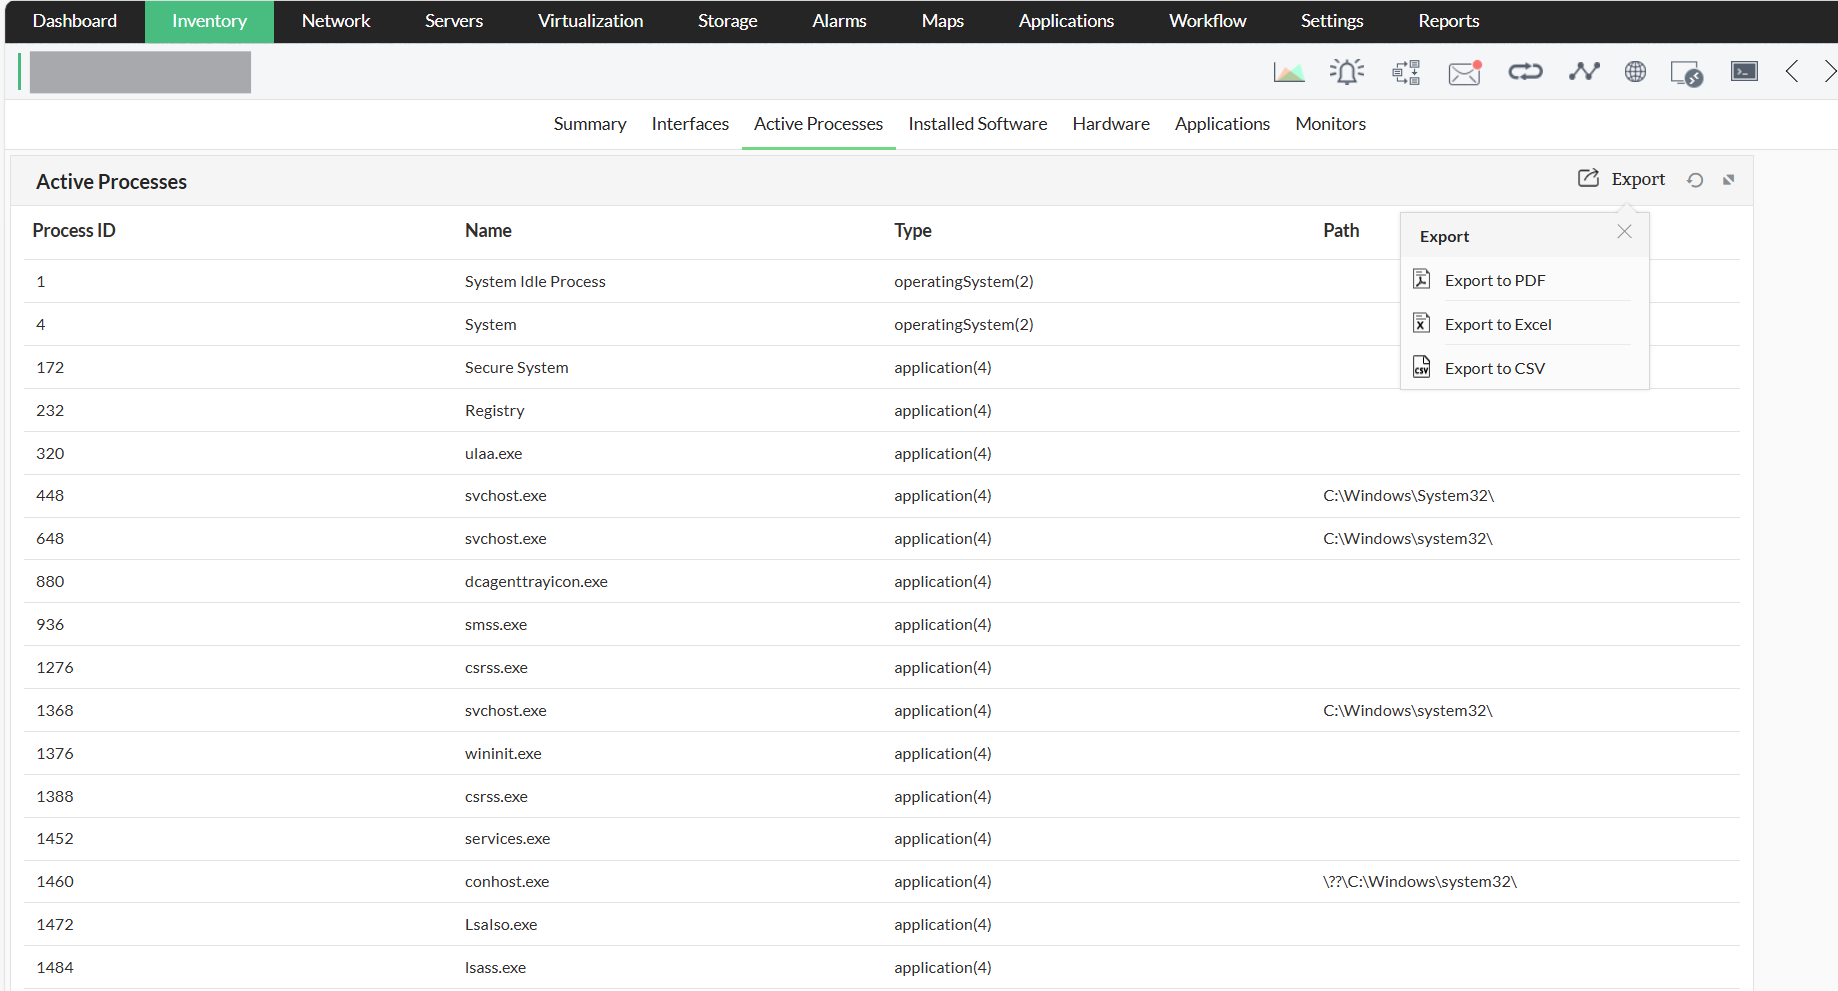
To view the details, navigate to Inventory → Devices and click on a device to open its snapshot page. You can now view all the processes that are currently running on the device from the Active Processes tab. You can also export the list of active processes to PDF, Excel and CSV files.
- When multiple types of credential profiles are associated, OpManager follows this priority to fetch the active processes: WMI/CLI > SNMP
- Example 1: If a device has both SNMP and WMI credentials associated with it, OpManager will first attempt to fetch the processes via WMI. If that fails, the processes will be fetched via SNMP.
- Example 2: If a device has both SNMP and CLI credentials associated with it, OpManager will first attempt to fetch the processes via CLI. If that fails, the processes will be fetched via SNMP.
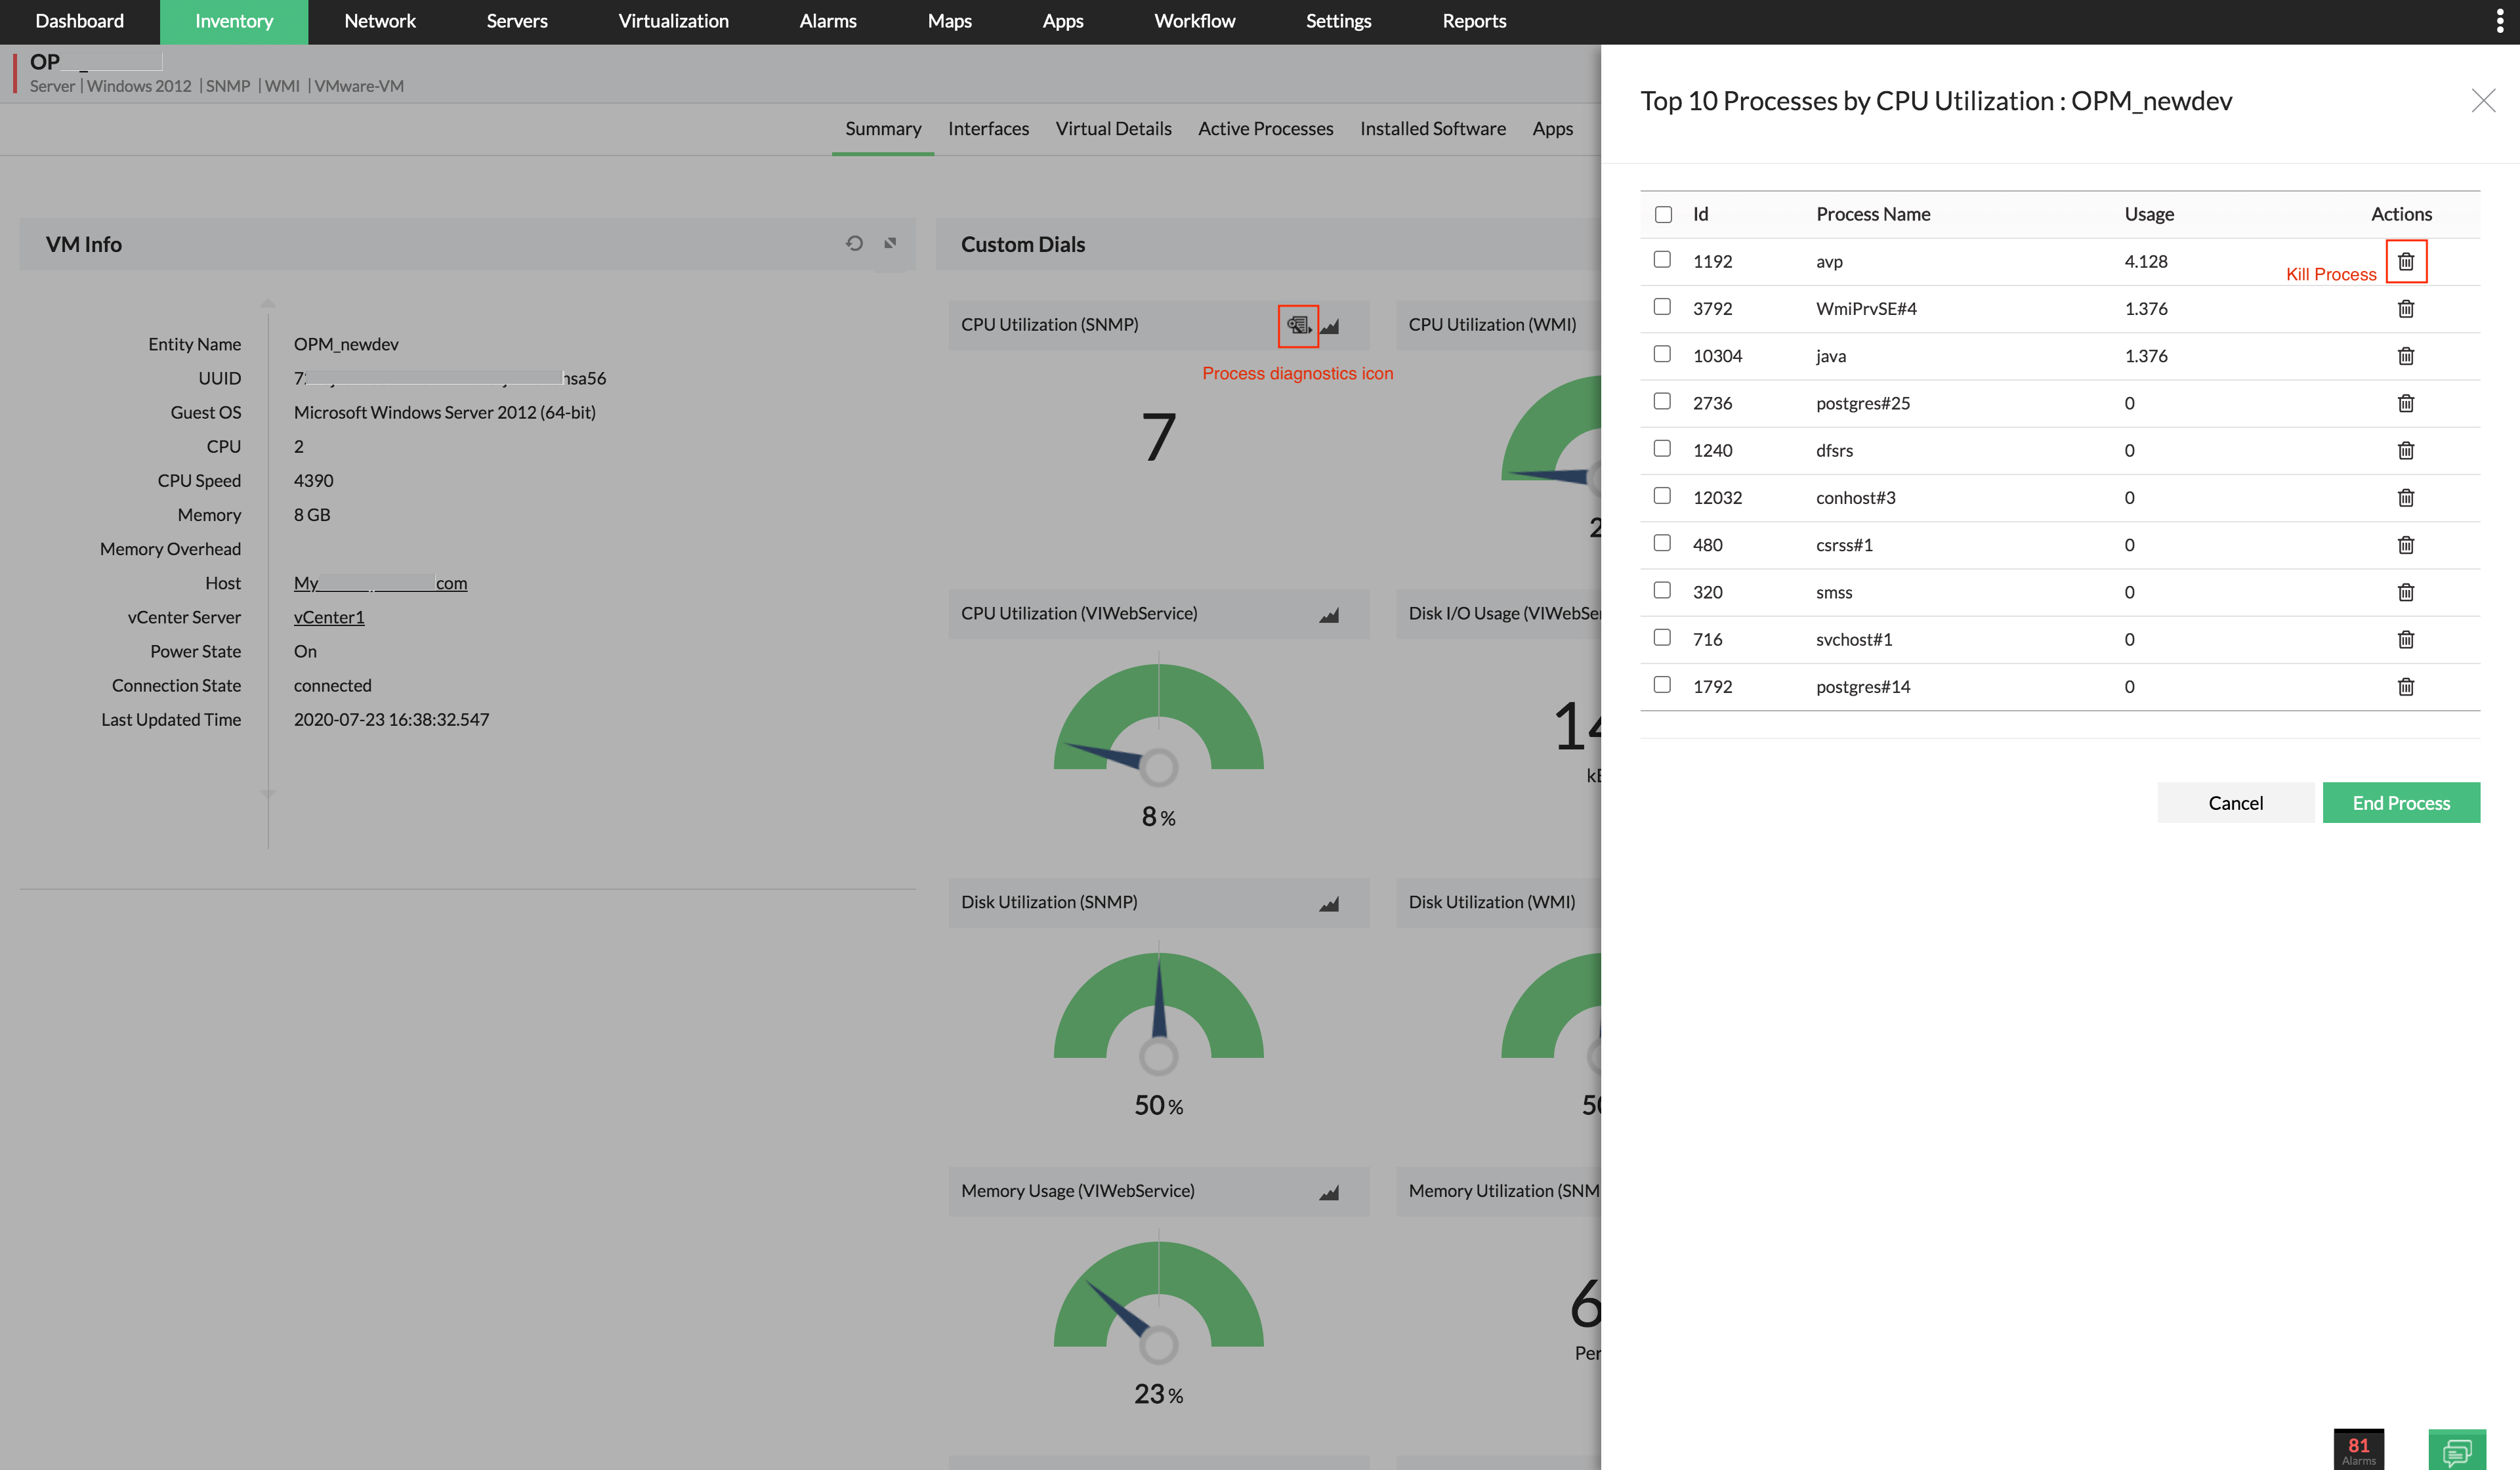
Also, if you have enabled Custom Dials for your devices, you can view the top 10 processes of a device by clicking on the Process Diagnostics icon on the top-right corner of the dial. From there, you can choose to end processes that are consuming a lot of resources by simply clicking on the Kill Process (bin) icon. (Top 10 processes available only for CPU utilization and memory utilization dials)