Virtual Server Reports
OpManager's Virtual server monitoring supports Citrix Xen Sever systems, Microsoft HyperV and VMware virtual environments containing Hosts and VMs. OpManager provides the monitoring data in comprehensive virtual server reports, offering insights into resource allocation, performance, and health of virtualized environments. These reports enable administrators to optimize resource usage, identify bottlenecks, and ensure smooth operations in virtualized infrastructures.
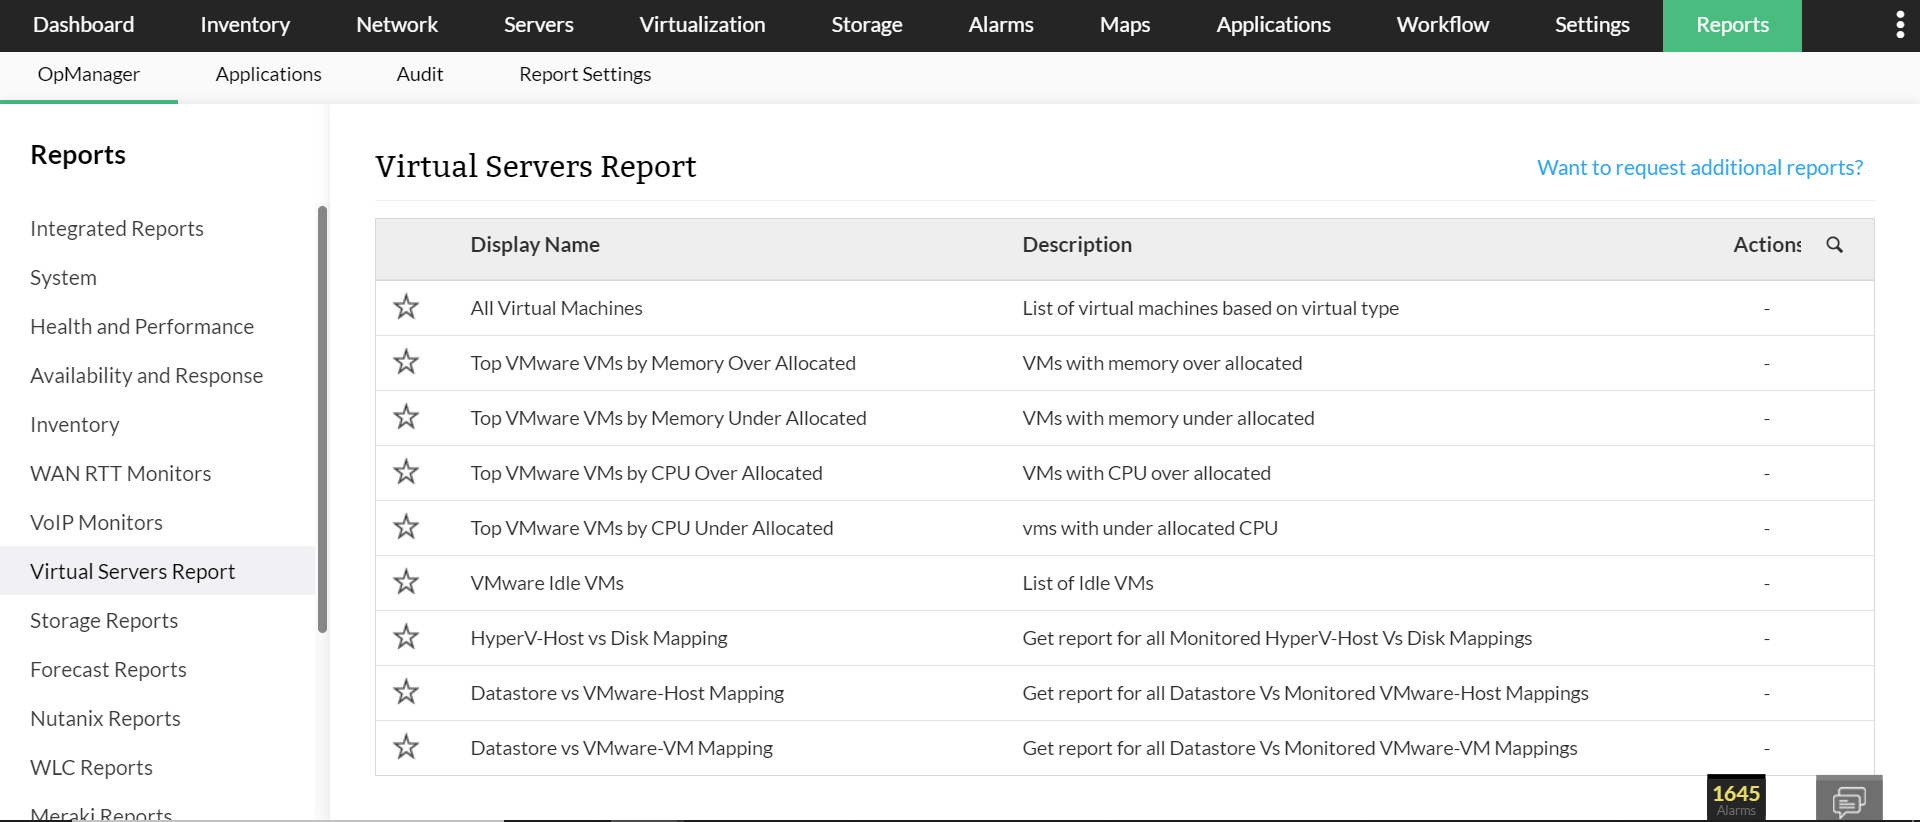
Virtual server reports in OpManager provide monitoring information of only the virtual machines and hosts and give a comprehensive view of metrics up to a granular level. Following are the default virtual server reports that are available in OpManager.
Available Virtual Server Reports
Below are the default Virtual Server Reports available in OpManager:
| Report Name | Description | Available Columns | Available Filters |
|---|---|---|---|
| All Virtual Machines | Provides an overview of all virtual machines (VMs) within the network, including power status, vCPU count, total memory, and host machine. Helps manage and monitor VM performance and resource allocation. | Device Name, IP Address, Power Status, Number of vCPUs, Total Memory (in GB), Host Name | Filter by |
| VMware VMs by Memory Over Allocated | Highlights VMs over-allocated in memory, showing usage percentage and memory adjustment recommendations to optimize resource utilization and avoid host performance issues. | Device Name, IP Address, Memory (%), Memory Recommendation | Period, View Records |
| Top VMware VMs by Memory Under Allocated | Identifies VMs with memory usage exceeding allocation, indicating under-allocation. Provides usage percentage and recommendations to ensure optimal performance. | Device Name, IP Address, Memory (%), Memory Recommendation | Period, View Records |
| Top VMware VMs by CPU Over Allocated | Lists VMs with excessive CPU allocation, showing utilization and offering CPU adjustment suggestions to optimize overall CPU resource use. | Device Name, IP Address, CPU (%), CPU Recommendation | Period, View Records |
| Top VMware VMs by CPU Under Allocated | Identifies VMs heavily utilizing their allocated CPU, suggesting an increase in CPU resources to maintain performance under load. | Device Name, IP Address, CPU (%), CPU Recommendation | Period, View Records |
| HyperV-Host vs Disk Mapping | Displays disk usage details for Hyper-V hosts, including disk names, total capacity, and free space to support efficient storage management. | Disk Name, Capacity (MB), Free Space (MB) | - |
| Datastore vs VMware-Host Mapping | Shows mapping between VMware datastores and their respective hosts along with storage capacities, aiding in storage resource planning. | Host Name, Capacity (MB) | - |
| Datastore vs VMware-VM Mapping | Provides mapping of VMware datastores to hosted VMs, including VM name, power status, and allocated memory to optimize storage distribution. | VM Name, Power Status, Memory (MB) | - |
To know more about the Available Filters in various reports of OpManager, Click here.