# Monitoring and Management of RAIDs in OpManager
## Heterogeneous management tool for storage area networks
ManageEngine® OpManager's advanced [storage monitoring](https://www.manageengine.com/network-monitoring/storage-monitoring.html) solution uses SNMP / CLI / SMI-S / vendor-specific APIs to discover the RAIDs in your business or [data center](https://www.manageengine.com/network-monitoring/data-center-networking.html) network environment. OpManager [supports a wide range of vendors](https://www.manageengine.com/network-monitoring/help/supported-storage-devices.html) and makes RAID management easy by consolidating all the information in a single window. Complete set of asset, capacity, performance, and configuration information of the RAID and its components are discovered and represented in the OpManager client.

Learn how to gain better visibility into the performance of your RAID devices using OpManager.
[Register for a personalized demo now!](https://www.manageengine.com/network-monitoring/demo-form.html?ftr-sraidm)
### Features supported
| Physical Assets | Logical Assets | Monitors | Report Details |
|---|---|---|---|
| - Controller
- Controller Fabric Ports
- Disk Drives
- Interconnect Details | - LUNs
- Volumes
- Raid Groups
- Virtual Disk Groups
- Partitions
- Volume Groups | - Controller status
- Controller port status
- Disk Drive status
- Volume status
- Disk Group status
- LUN status | - Raid Capacity summary
- Availability Trends
- Top N Availability
- Array statistics
- LUN statistics
- Disk Drive statistics
- VDisk statistics
- Top N Performance
- Location summary |
The above table lists the features supported by OpManager for storage devices. This is a non-exhaustive list. A complete and comprehensive list of vendor specific supported features are provided in [inventory page details](https://www.manageengine.com/network-monitoring/help/inventory-page-data.html) and [supported performance monitors](https://www.manageengine.com/network-monitoring/help/storage-performance-monitors.html).
**Asset Management**
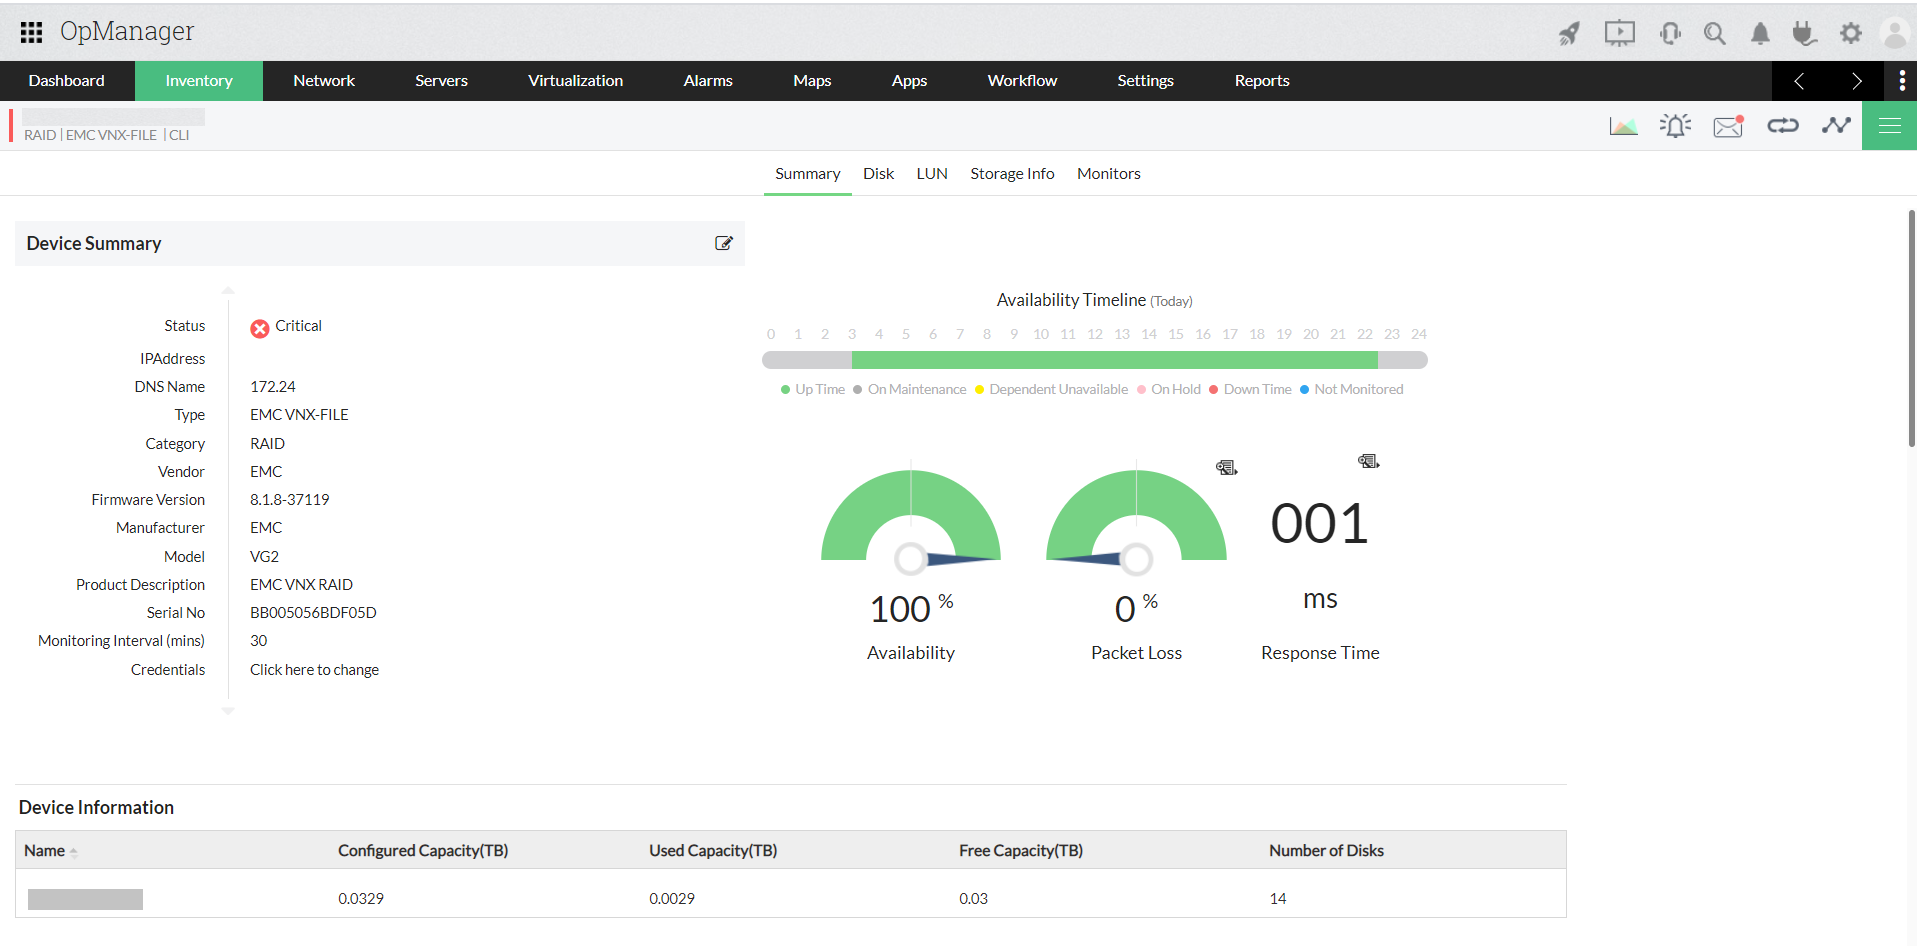
- Up-to-date device summary
- Administrators can key in details such as device location, vendor details, and technical support info.
- Comprehensive physical and logical asset details in RAIDs
- Device level problem report filing and maintenance
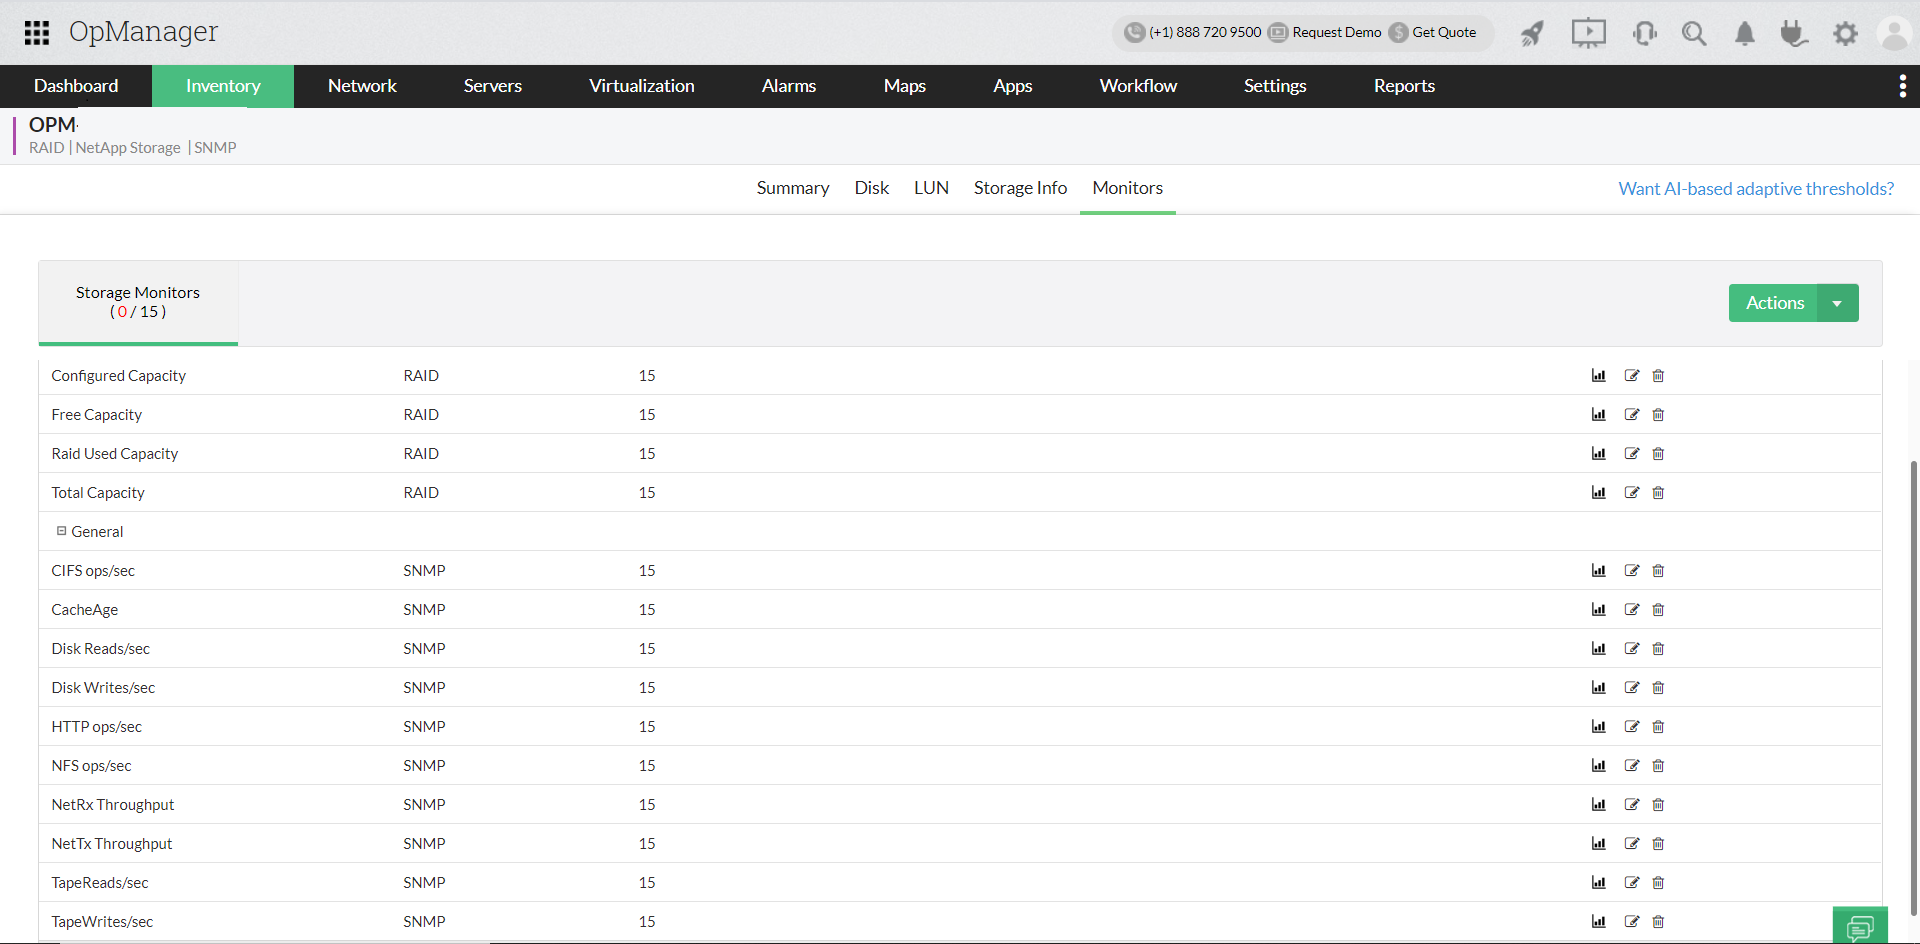
### Enhanced Raid monitoring capabilities
Monitoring your Raid devices becomes simpler as OpManager allows you to add new monitors and edit or delete the existing monitors associated to a device.
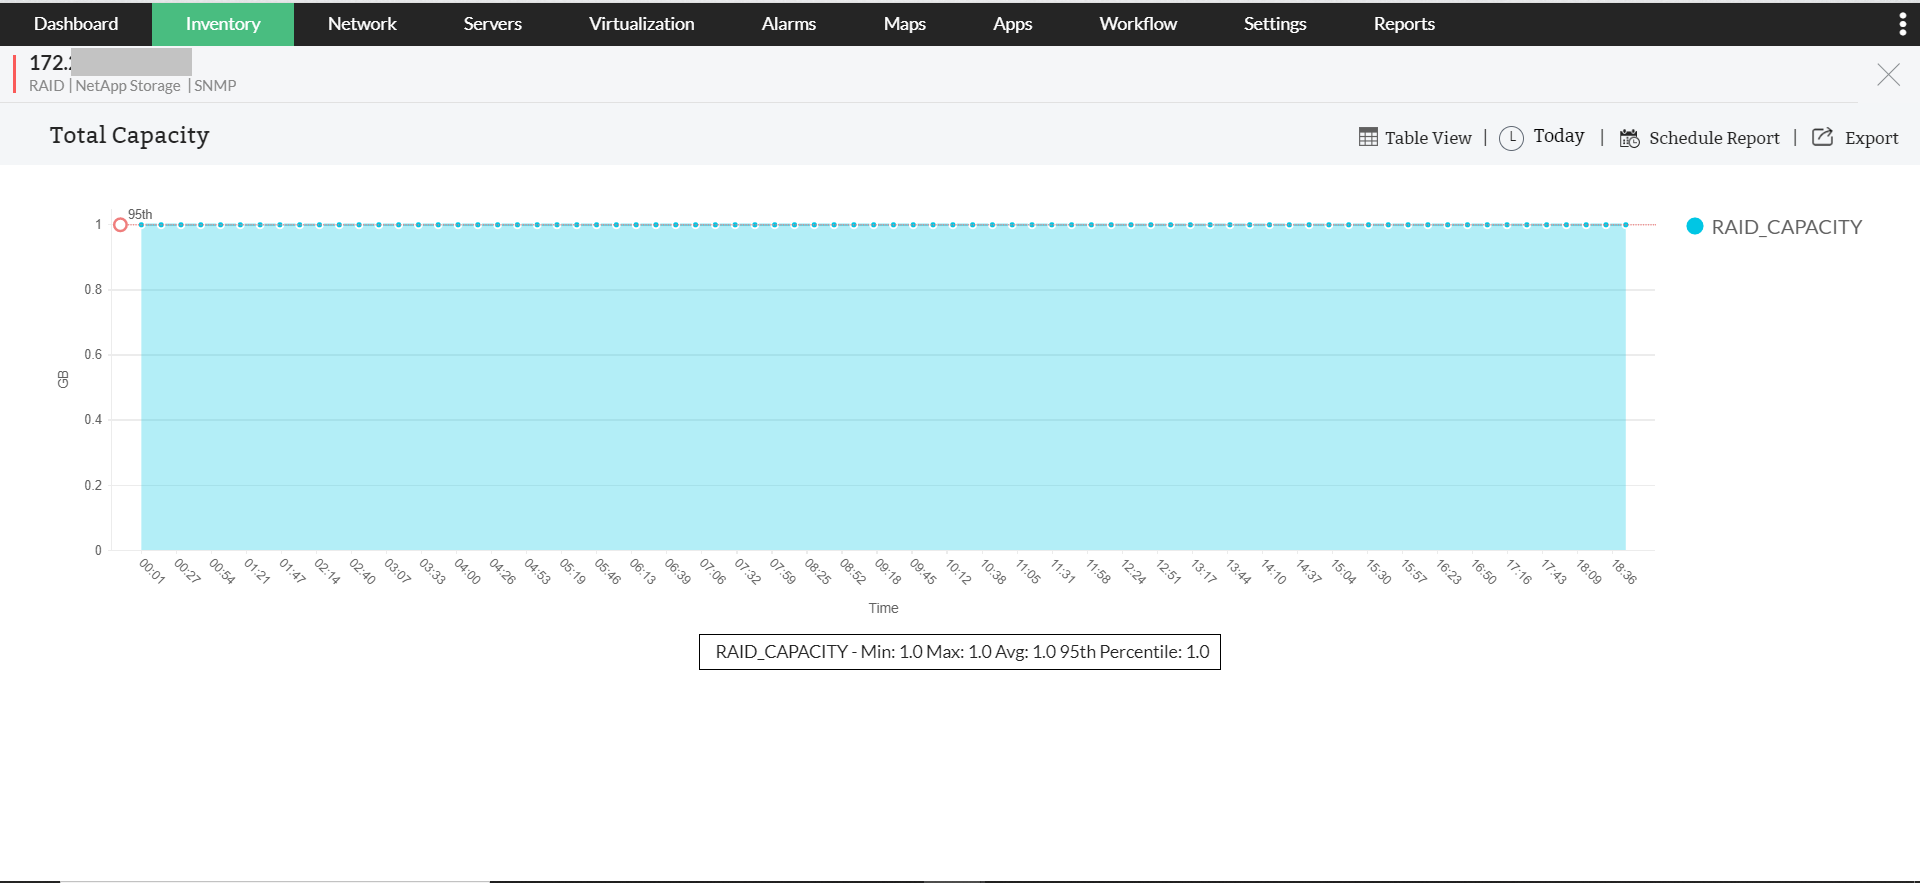
As you drill down to a particular monitor of a device, you can have the graphical view of the data collected by monitoring.
### Fault Management
OpManager periodically polls the devices to check the health, availabiity, and utilization of storage RAIDs. Early indications are provided on hardware/software problems and alarms are generated on drive failures, sensor faults such as Fan Failure, Battery Failure, Power supply failure. SNMP traps from the arrays are also captured and appropriate alarm is generated.
- Captures Storage Array & Component Status Change Notifications
- Management functions such as assign owner, annotate, clear, and delete
- Reports alarms to administrators through email or SMS messages based on customizable rules
- Escalates unattended alarms to higher ups based on pre-defined rules
### Availability Trends
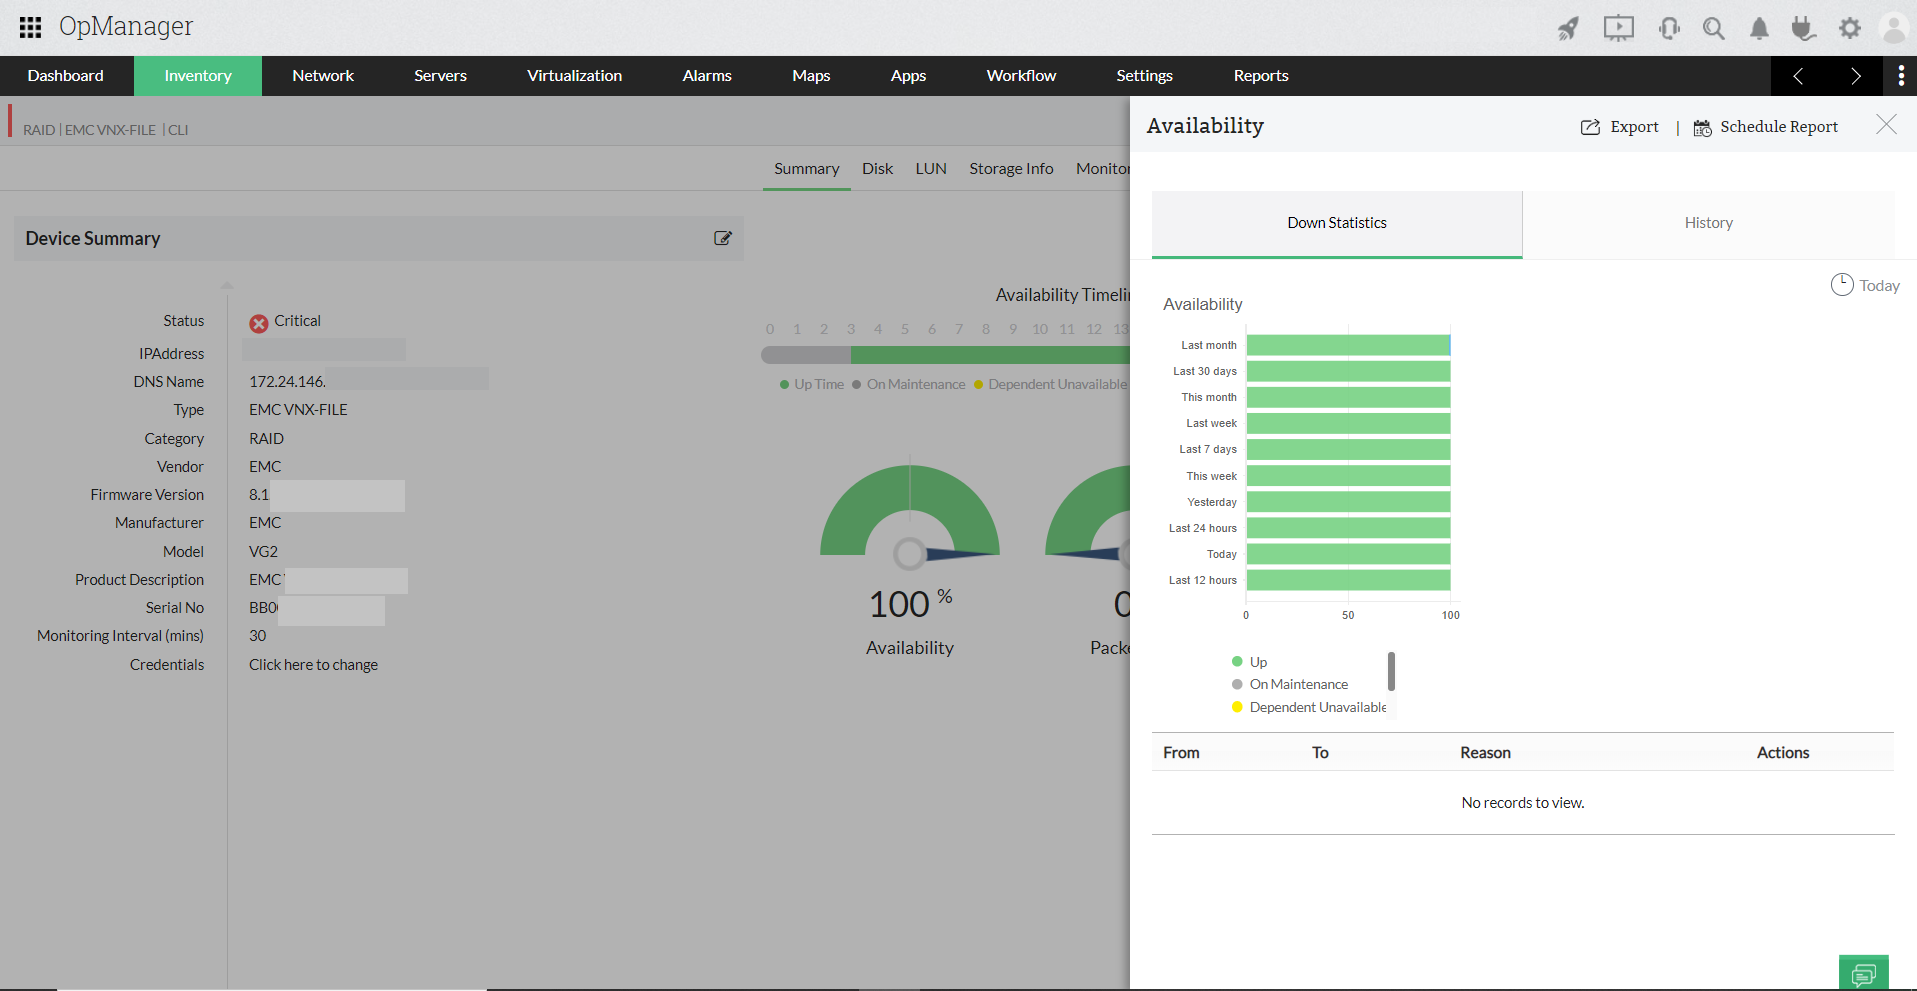
Availability reports on RAID controllers and its ports show the availability trends, downtime history, MTTR, MTBF, etc.
You can [generate the reports](https://www.manageengine.com/network-monitoring/help/advanced-report.html) for various time periods such as today, yesterday, last N days, last week, this month, last month, and between two selected days.
### Performance Reports
Performance statistics are computed at periodic intervals and reports generated to provide trend analysis for the storage array components like:
- Storage Array Capacity
- Storage Array
- Controller / Storage Processor
- Virtual Disks
- Raid Groups
- Disk Groups
- Disk Drives
- Controller Port Statistics
The parameters collected include the following:
- Traffic - Read / Write / Total
- Utilization - Read / Write / Total
- Bandwidth - Read / Write / Total
- Throughput - Read / Write / Total
- Latency - Read / Write
- Queue Depth
- Storage array capacity - Total / Configured / Used / Free
You can visually see the utilization of components like LUN volumes and take preventive measures as they reach their peak capacities.
### Visualization
- Topological map shows arrays and their connections to switches and host servers.
- Link details table shows link name, source, and destination.
- Color-coded icons depict switch and interconnection status.
- Drill-down views - Array Sub-map views
For in-depth storage monitoring, download OpManager - the comprehensive [storage monitoring](https://www.manageengine.com/network-monitoring/storage-monitoring.html?opmstorage) tool.