Monitoring High Availability using PAM360

    Note: Right now, PAM360 supports HA monitoring for PostgreSQL database only. Eventually, support will be extended for MS SQL databases as well.

In mission-critical environments, one of the crucial requirements is to provide uninterrupted access to passwords. PAM360 provides the High Availability feature just to ensure this. In general, High Availability (HA) approach is to have a Primary server and a Secondary/Standby server to take over operations, if the Primary server fails. PAM360 supports monitoring the high availability of your servers to anticipate failures, thereby avoiding costly downtimes.

This document walks you through the below topics:

  1. Why do you need High Availability Monitoring?
  2. How does High Availability work in PAM360?
  3. The High Availability Architecture in PAM360
  4. What happens to Audit Trails?
  5. Synchronizing Primary and Secondary Servers
  6. Monitoring High Availability for PostgreSQL Database Server

    6.1 Steps to Monitor High Availability for PostgreSQL Database Server

    6.2 The High Availability Console for PostgreSQL Database Server

    6.3 UI Elements and Definitions

    6.4 Impact of Server/Database Status (Active/Inactive) on High Availability

    6.5 Alerting Mechanism for Status Failure

    6.6 Modifying Server Details from the HA Console

    6.7 What do I do in case of a High Availability Failure?

1. Why do you need High Availability Monitoring?

Continuous monitoring of your endpoints and associated database operations ensures early detection of problems and finding solutions for the same which in turn improves the user's system experience. In addition, monitoring captures system metrics, used to analyze trends in server performance and recurring problems. In the case of the database server, a reliable monitoring system is essential as it measures availability, detects events that can put down the database server and provides immediate notifications about critical failures to the concerned parties. A perfect monitoring process is one that is highly accessible and stable, captures diagnostic data and alerts the administrator about the problems encountered.

2. How does High Availability work in PAM360?

Whenever the Primary server fails or goes down, the Secondary server takes over the functions that were being performed by the Primary. The HA setup in PAM360 provides a Secondary server, which can be used to retrieve passwords from the PAM360 repository, in case of a disaster, until the fully functional Primary server is back to service. This can be explained in detail as below:

  • Redundant PAM360 servers and database instances will be present.
  • One instance will be the Primary, providing read/write access to users. All the users will be connected with the Primary only.
  • The other instance will act as the Secondary.
  • Both the Primary and the Secondary instances will always be in sync with each other. The data replication happens through a secure, encrypted channel.
  • When the Primary server goes down, the Secondary will offer emergency access to the users, until the fully-functional primary server is brought back to service. The intermediate changes (if any) made to the database will be automatically synchronized upon connection restoration.

3. The High Availability Architecture in PAM360

The HA architecture in PAM360 is designed to be compatible with two different scenarios. See the below table for a detailed explanation:

Scenario 1

Hosting Primary & Secondary servers on the same network

The Secondary server is located on the same network, where the Primary server operates. The Secondary server is provided with the read/write access (except password reset action), in case of the Primary server failure.

Example

Primary & Secondary within the same network & the Primary goes down:

Assume, the Primary and Secondary servers are deployed in the same geographical location, say 'A'. In the case when the Primary crashes or goes down, the users of both the Primary and Secondary servers will get the emergency access to the passwords from the Secondary.

Scenario 2

Hosting Primary & Secondary servers on different networks

Primary and Secondary servers are located on different networks. The Secondary server in the remote network gets the read/write access (except password reset action), in case of a WAN link failure or Primary server failure.

Example

Primary & Secondary in different geographical locations and WAN Link failure happens between the locations:

Assume, the Primary server is in a geographical location 'A' and the Secondary server is deployed in another location 'B'. By default, the users in both 'A' and 'B' will be connected to the Primary and will be carrying out the routine password management activities. The data in both the Primary and Secondary are in sync with each other. Now, imagine, there happens a network connectivity loss between the two locations. In such a situation, the two servers will start operating independently. Thus, the users in location 'A' will remain connected with the Primary server and will be carrying out their operations as usual. On the other hand, the users in location 'B' will get emergency access to the passwords from the Secondary server. Once the connection is re-established between 'A' and 'B', the data in both the locations will be synchronized.


4. What happens to Audit Trails?

In the high availability scenarios mentioned above, audit trails will be recorded as usual. In scenario 2, as long as there is network connectivity between the two locations, the audit trails will be printed by the primary. When users connect to the Secondary, it will print operations such as 'password retrieval', 'login' and 'logout'. When the two locations get back network connectivity, the audit data will be synchronized. In scenario 1, when the primary crashes, the 'password retrieval', 'login' and 'logout' done by the users in secondary will be audited. Other audit records will already be in sync at the Standby

5. Synchronizing Primary and Secondary Servers

For a Secondary server to take over the operations of a failed Primary server, it must hold accurately the same data and perform the database processing in the same way as the primary server would have done, if it had worked fine. Hence, synchronization means continuously updating the Secondary server database so that it is an exact replica of the Primary database server.

PAM360's HA functionality is thoughtfully designed to keep the data in both the servers in sync all the time. In case of a Secondary server failure or link failure, the changes made in one database are automatically synced up with the other upon service/connection restoration. Also, during such failures, the operations done in the Secondary server are audited as usual and synced up automatically on restoration. The data replication happens over a secure, encrypted channel.

6. Monitoring High Availability for PostgreSQL Database Server

PAM360 is inbuilt with HA management and monitoring capabilities with various notification options. Follow the below steps to monitor and manage the HA for PostgreSQL Database Server using PAM360:

6.1 Steps to Monitor High Availability for PostgreSQL Database Server

  1. Before you start monitoring HA, you need to first set up HA in the server running in PostgreSQL.
  2. Once you have set up the HA, you can start monitoring the PostgreSQL HA setup from the PAM360 console:
    Navigate to Admin >> Configuration >> High Availability of Primary or Secondary server. You will see the HA console.

6.2 The High Availability Console for PostgreSQL Database Server

The HA console in PAM360 is an all-in-one, dashboard-style window for monitoring the availability of your Primary and Secondary servers and the associated databases. The console allows you to switch your view from the Primary server to the Secondary server, and vice-versa.

Use the HA Console to:

  • View the HA summary that includes the status of the HA and its configuration.
  • View the status of the servers and the associated databases.
  • View the replication pending count.
  • View the connection lost and connection resumed times.
  • Modify the server details.

The view of the console is based on whether you have configured or not configured the HA:

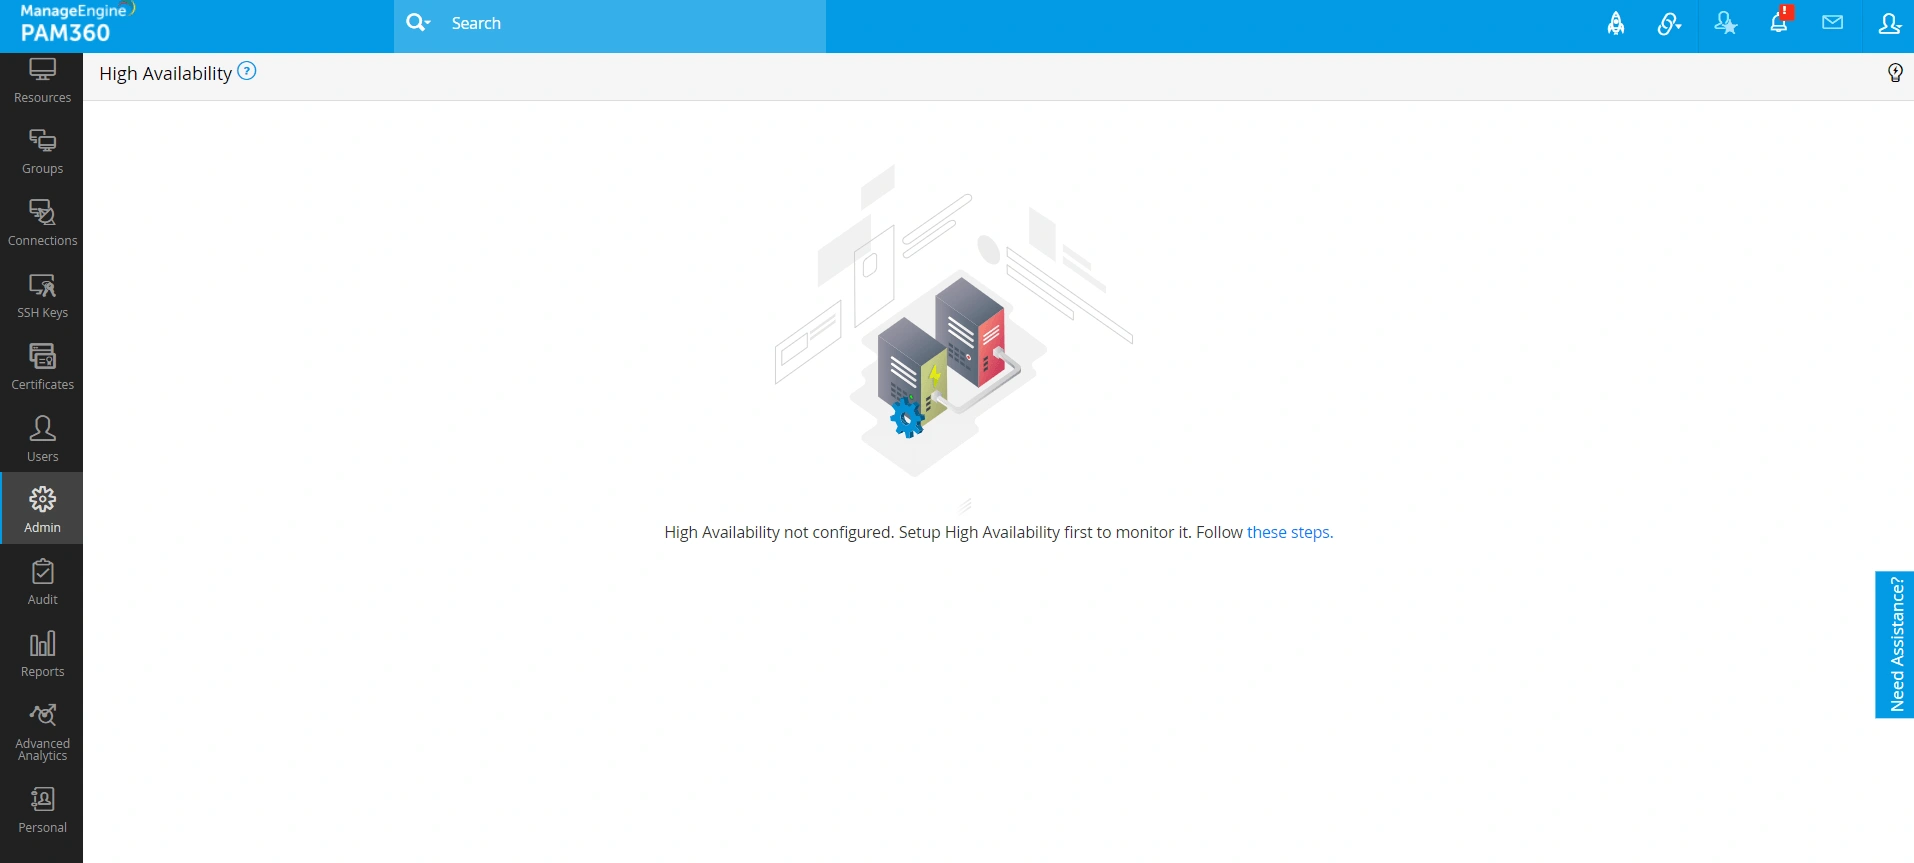
  1. If you have not configured HA: You will see an empty console with a message displayed as shown in the below image. You need to setup the High Availability first to monitor it.

    View of the console when HA is not configured with PostgreSQL

High Availability Console without HA configured - PostgreSQL

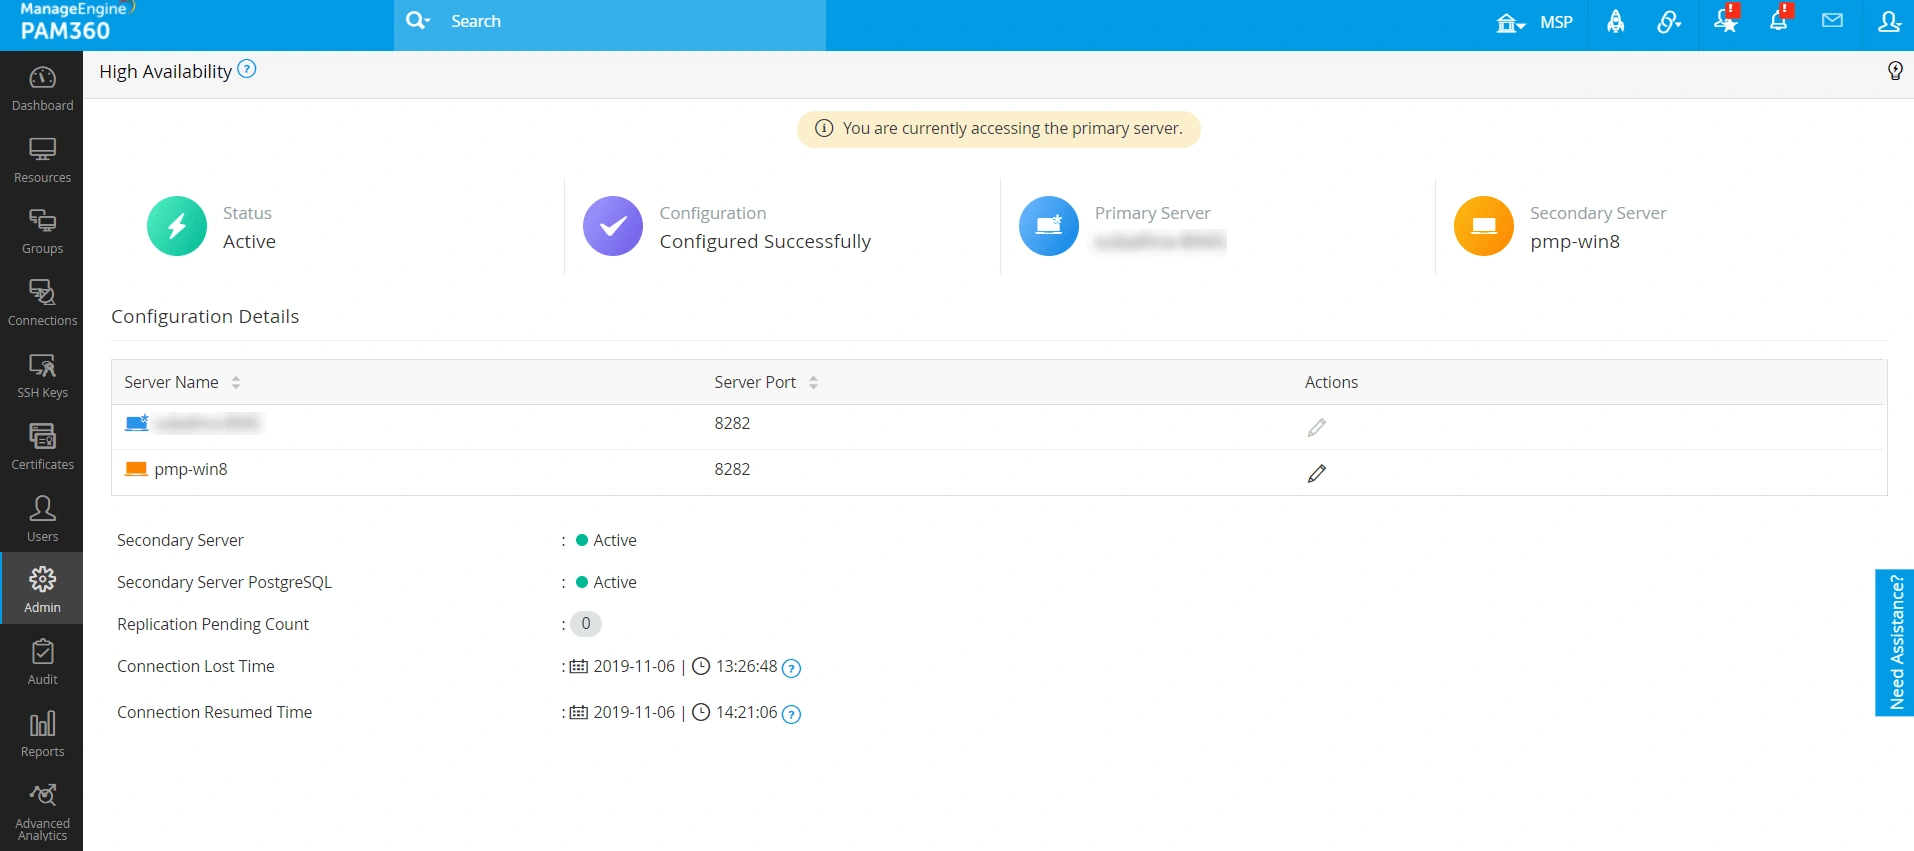
  1. If you have configured the HA setup properly: You will see the console with the availability and other details of the Primary and Secondary server, as shown in the below image:
    View of the console when HA is configured with PostgreSQL
High Availability Console with HA configured - PostgreSQL

6.3 UI Elements and Definitions

The PAM360 HA monitoring console includes various elements each of which corresponds to a specific detail as explained below:

Sl. No: UI Element/Icon Status Definition

1

Active


This blinking icon indicates that the HA is actively running in the server (Primary/Secondary) which you are viewing right now.

2

Inactive


This blinking icon indicates that the HA is down in the server (Primary/Secondary) which you are viewing right now.

3

Success


This icon indicates that HA is configured successfully in your server. In the case of HA configuration failure, this screen will be shown.

4

-


This icon denotes the Primary server.

5

-


This icon denotes the Secondary server.

6

Configuration Details

-


This is a table listing the following details of Primary and Secondary servers; Server Name, Server Port and Actions. You can modify the Secondary server details from here. (Please note that you cannot edit the Primary server details)

7

Primary/Secondary Server


This icon indicates that the Primary/Secondary server is up and running.


This icon indicates that the Primary/Secondary server is down and stopped running.

8

Primary/Secondary Server PostgreSQL


This icon indicates that the PostgreSQL database of Primary/Secondary server is up and running.


This icon indicates that the PostgreSQL database of Primary/Secondary server is down and stopped running.

9

Replication Pending Count

-


This indicates the total number of pending replications. If this value is zero, it means that there are no replications pending and the Primary and Secondary server are continuously in sync with each other.

10

Connection Lost Time

-


This indicates the time when the connectivity between the Primary and Secondary servers was lost.

11

Connection Resumed Time

-


This indicates the time when the connectivity between the Primary and Secondary servers was regained.


6.4 Impact of Server/Database Status (Active/Inactive) on High Availability

The basic concept underlying HA is constant replication of data between the Primary and Secondary servers, where the Primary acts as the "Master" and the Secondary as the "Slave". The "Status" corresponds to the condition of the connection/communication between the Primary and Secondary servers/databases. There are two types of HA status:

  1. Active - Indicates perfect data replication and data synchronization between the Primary and Secondary servers.
  2. Inactive - Indicates a breakage in connectivity between the Primary and Secondary servers. The breakage might be due to a disruption such as network problem between the servers (in turn between the databases). Due to this, there will be no communication between the databases of Primary and Secondary servers and the data replication and data synchronization between the servers will get disturbed.

Once the connection gets re-established, the synchronization will start between the databases. Anyhow, during the network disconnectivity, those who have connected to the primary and Secondary will not face any disruption in service.

6.5 Alerting Mechanism for Status Failure

Since the above two conditions (Active/Inactive) assume importance in the HA setup, it is important to receive real-time alerts when the status turns from Active to Inactive and vice-versa. To configure alerts, navigate to Audit >> Resource Audit >> Configure User Audit >> General Operations and select the mode of alert (email/SNMP trap/Syslog message) for the events High Availability Alive and High Availability Failed.

    Notes:

    1. Post HA Configuration: If you change the port of the Primary PAM360 server, the high availability setup will not work. You need to re-configure the setup with suitable changes.

    2. If you have configured TFA: Whenever you enable TFA or when you change the TFA type (PhoneFactor or RSA SecurID or One-time password) AND if you have configured HA, you need to restart the PAM360 secondary server once.

6.6 Modifying Server Details from the HA Console

Click the icon under Actions beside the Secondary server, whose details you wish to edit. In the window that pops up modify the details as required and click Update.

High Availability Console with HA configured - PostgreSQL

6.7 What do I do in case of a High Availability Failure?

Once the HA status becomes "Inactive", the PAM360 HA setup also breaks down. In case of a HA failure, contact pam360-support@manageengine.com with the below log file:

<PAM360 Installation Folder>/pgsql/data/pg_log/pgsql_Mon.log


Top