# OpenTelemetry
OpenTelemetry is an open-source set of tools, APIs, and SDKs for instrumenting, generating, collecting, and exporting telemetry data to help in application performance monitoring.
Applications Manager provides an OpenTelemetry-compatible back end for ingesting OpenTelemetry trace data using OpenTelemetry components. The Applications Manager back end will process and display the ingested data in the Applications Manager GUI. This capability is referred to as Applications Manager OpenTelemetry.
`**Note:** Applications Manager OpenTelemetry currently supports Traces only. Metrics and Logs are not supported at this time.`
Browse through the following topics to learn more about OpenTelemetry in Applications Manager:
- [Instrument supported platforms](#instrument-supported-platforms)
- [How it works?](#how-it-works)
- [Why OpenTelemetry?](#why-opentelemetry)
- [Performance metrics](#performance-metrics)
- [Edit OpenTelemetry service](#edit-otel-service)
To learn more about OpenTelemetry concepts and architecture, refer to [What is OpenTelemetry?](https://www.manageengine.com/products/applications_manager/help/what-is-opentelemetry.html).
## Instrument supported platforms
### Languages and SDKs
Follow the steps below to onboard your application using Applications Manager OpenTelemetry:
| | | |
|---|---|---|
| - [Java](https://www.manageengine.com/products/applications_manager/help/java-instrumentation.html)
- [C++](https://www.manageengine.com/products/applications_manager/help/c-plus-plus-instrumentation.html)
- [PHP](https://www.manageengine.com/products/applications_manager/help/php-instrumentation.html)
- [.NET](https://www.manageengine.com/products/applications_manager/help/dot-net-instrumentation.html)
- [C#](https://www.manageengine.com/products/applications_manager/help/dot-net-instrumentation.html) | - [Node.js](https://www.manageengine.com/products/applications_manager/help/nodejs-instrumentation.html)
- [Python](https://www.manageengine.com/products/applications_manager/help/python-instrumentation.html)
- [Ruby](https://www.manageengine.com/products/applications_manager/help/ruby-instrumentation.html)
- [Elixir](https://www.manageengine.com/products/applications_manager/help/erlang-elixir-instrumentation.html)
- [Go](https://www.manageengine.com/products/applications_manager/help/go-instrumentation.html) | - [Rust](https://www.manageengine.com/products/applications_manager/help/rust-instrumentation.html)
- [Swift](https://www.manageengine.com/products/applications_manager/help/swift-instrumentation.html) |
`**Note:** For other applications, see `[`Other Application Instrumentation`](https://www.manageengine.com/products/applications_manager/help/other-apps-instrumentation.html)`.`
To configure and install the APM OTEL Collector, refer to [Configure APM OTEL Collector](https://www.manageengine.com/products/applications_manager/help/export-opentelemetry-data.html).
### Integrations
Visit the [OpenTelemetry Integrations](https://opentelemetry.io/ecosystem/integrations/) page to explore libraries, services, and apps with first-party support for OpenTelemetry.
## How it works?
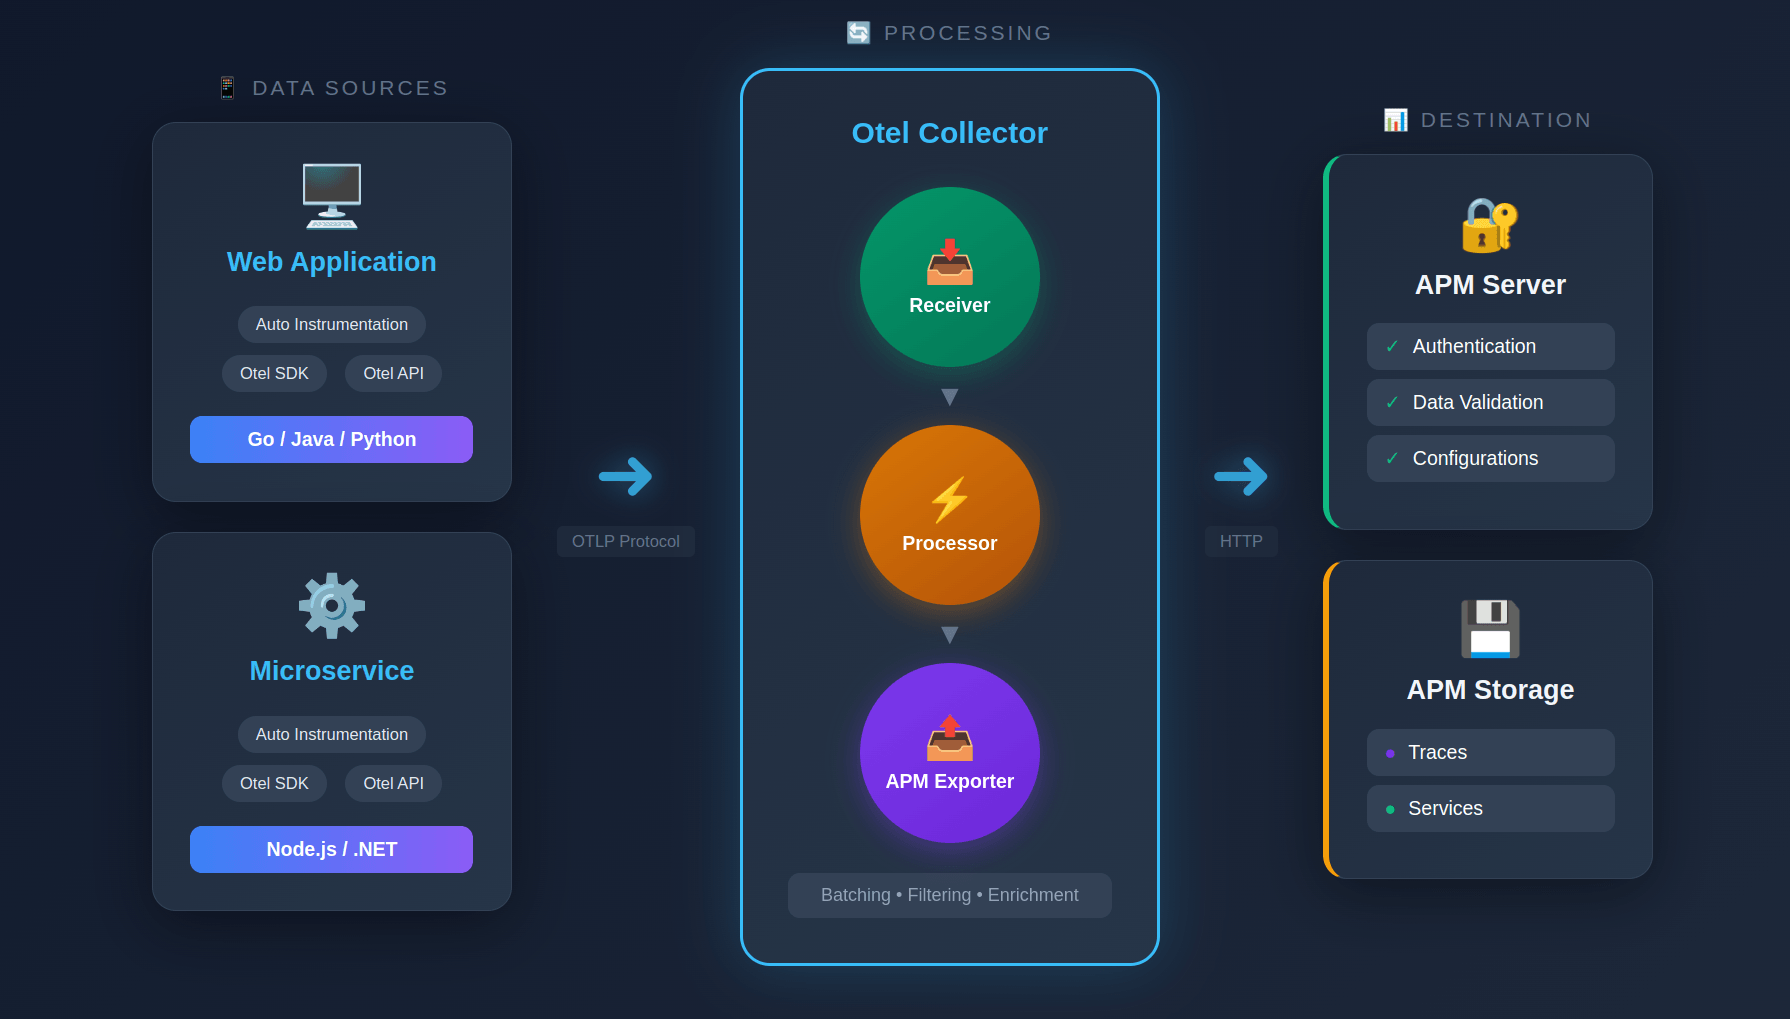
The application code is instrumented with OpenTelemetry client libraries. These help with telemetry data collection, including **Services**, where you can gain insights into your application's transactions, database performance, traces, exceptions, service maps, and overall behavior.
Once the telemetry data is generated, it can be directly exported to the OpenTelemetry Collector. The Collector receives and processes this data and exports it to Applications Manager server. Applications Manager validates the request, and the telemetry data is stored in Applications Manager database.
## Why OpenTelemetry?
With OpenTelemetry, you can:
1. Standardize the telemetry data collected and transmitted to back-end platforms.
2. Avoid reinstrumenting code or installing different agents for different back-end platforms.
3. Be vendor-neutral.
4. Give complete visibility to the developer on which data is being collected from their application for tracing and metrics that are being collected.
5. Increase the transparency of data collection.
## Performance metrics
Understand how OpenTelemetry helps in monitoring and capturing [key performance metrics](https://www.manageengine.com/products/applications_manager/help/opentelemetry-perf-metrics.html) for your application.
## Edit OpenTelemetry service
Learn how to [configure and customize the OpenTelemetry service](https://www.manageengine.com/products/applications_manager/help/apm-insight-opentelemetry-agent-configuration.html) to suit your application.