Ensure that your Oracle memory structures are adequately sized.
The Oracle database consists of an instance and data storage. The instance is a set of operating system processes and memory structures that interact with the storage. System Global Area (SGA) and Process Global Area (PGA) are two kinds of memory structures that Oracle uses.
Each Oracle instance uses SGA, which is a shared memory area, to store its data and control information for cached data blocks and shared SQL areas. The PGA, on the other hand, is a memory area that stores data and controls information for a single process and holds information about user sessions, session variables, sorts, bind variables, and so on.
As the workloads change, memory is redistributed to ensure optimal performance. How do you know if Oracle memory structures, such as the SGA and PGA, are adequately sized?
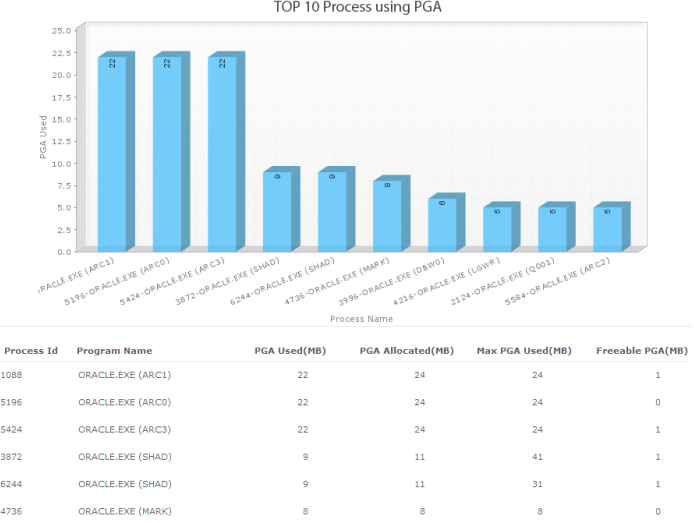
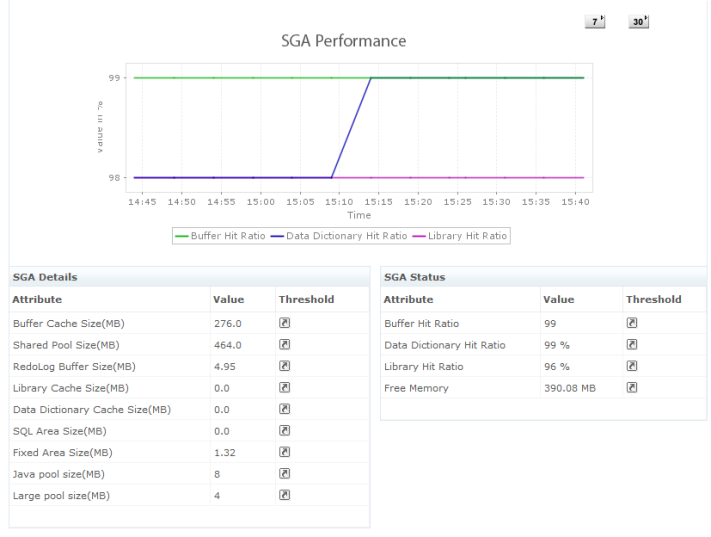
Applications Manager helps you in tracking SGA performance and the Oracle processes using PGA and the resource limit for processes. This gives you insight into how loaded your Oracle Database is and lets you determine how to distribute memory optimally among the components.
You can view historical information about:


Some of the metrics for memory structure management are as follows:
It allows us to track crucial metrics such as response times, resource utilization, error rates, and transaction performance. The real-time monitoring alerts promptly notify us of any issues or anomalies, enabling us to take immediate action.
Reviewer Role: Research and Development