# Comprehensive PHP Monitoring for Peak Application Performance
## The Criticality of PHP Application Performance Monitoring (APM)
In today's fast-paced digital landscape, the performance of PHP-powered web applications is paramount to user satisfaction and business success. Slow loading times, frequent errors, or unresponsive functionalities can quickly lead to user abandonment, damaged brand reputation, and significant revenue loss. Beyond simply uptime monitoring, effective PHP monitoring delves into the intricate workings of your application, providing granular visibility into performance bottlenecks.
Without a robust APM solution, development and operations teams often find themselves reacting to issues reported by users, leading to prolonged downtime and a frustrating troubleshooting process. Understanding where and why performance degrades — whether it's slow database queries, inefficient code, or third-party API latency — is essential for proactive management.
ManageEngine Applications Manager addresses this by offering a holistic view, transforming reactive firefighting into strategic, data-driven optimization. It's not just about knowing if your application is slow, but why it is, enabling targeted and effective interventions.
## Unlock Code-Level Visibility and Transaction Tracing for PHP Applications
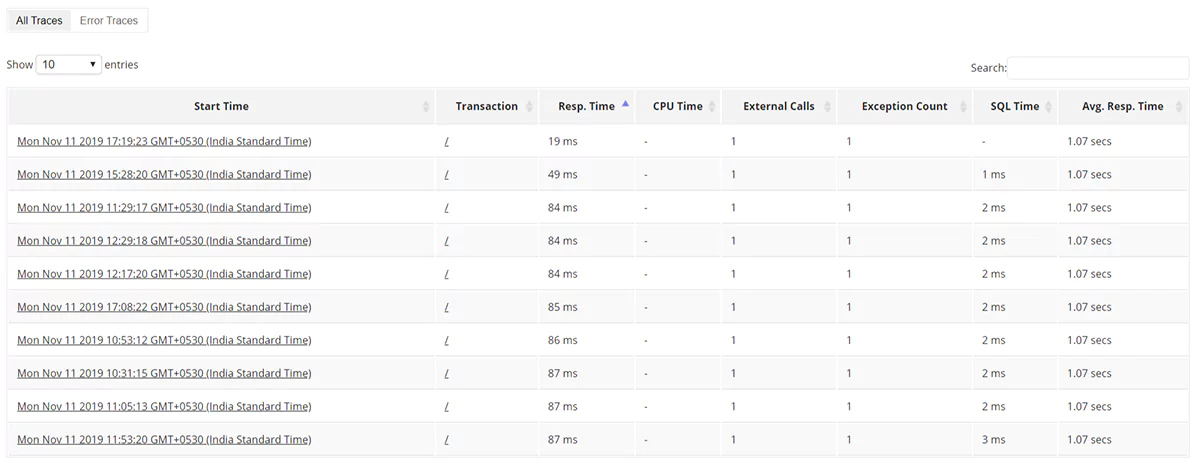
Achieving true **APM for PHP applications** requires more than just high-level metrics; it demands deep, code-level visibility. ManageEngine Applications Manager excels in this area by offering comprehensive **transaction tracing in PHP**, allowing administrators to follow the complete path of a user request from the browser to the database and back. This includes detailed breakdowns of individual function calls, SQL queries, external API calls, and resource consumption at each stage.
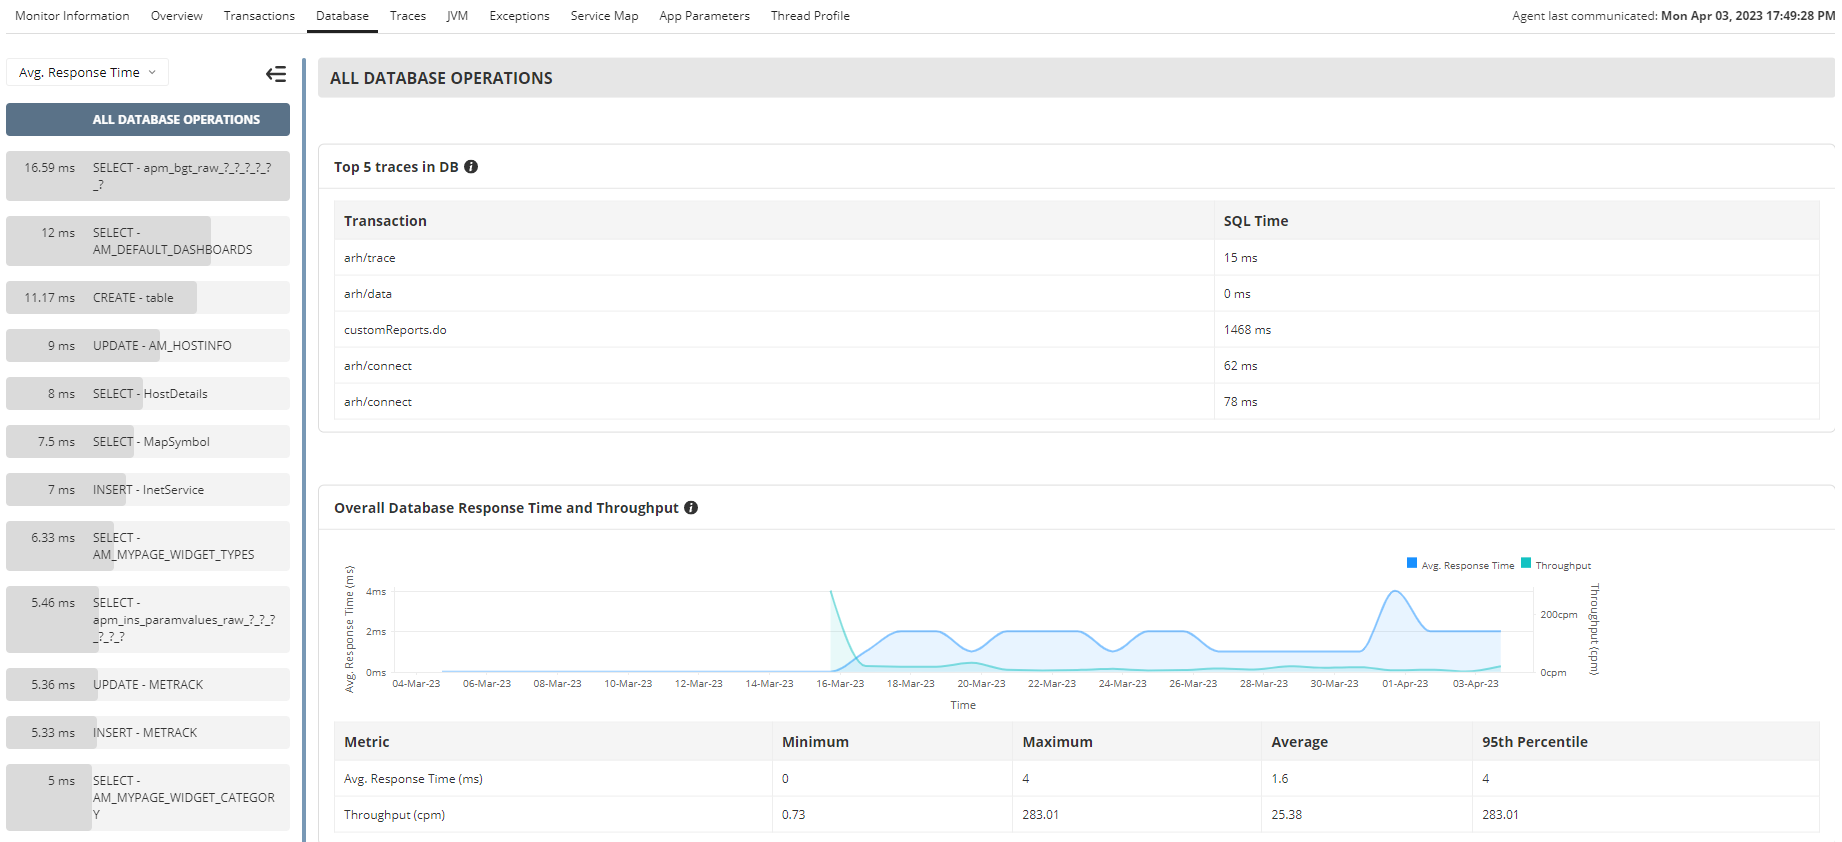
By providing a clear view of transaction flow, the tool pinpoints exact lines of code or specific database queries that are causing slowdowns. This granular insight is invaluable for identifying the root cause of performance issues that might otherwise remain hidden within complex PHP applications.
Furthermore, the ability to analyze **database interaction** helps optimize database performance directly impacting PHP application reliability and accuracy, ensuring efficient data retrieval and processing.
## Strategic PHP Performance Optimization Through Actionable Insights
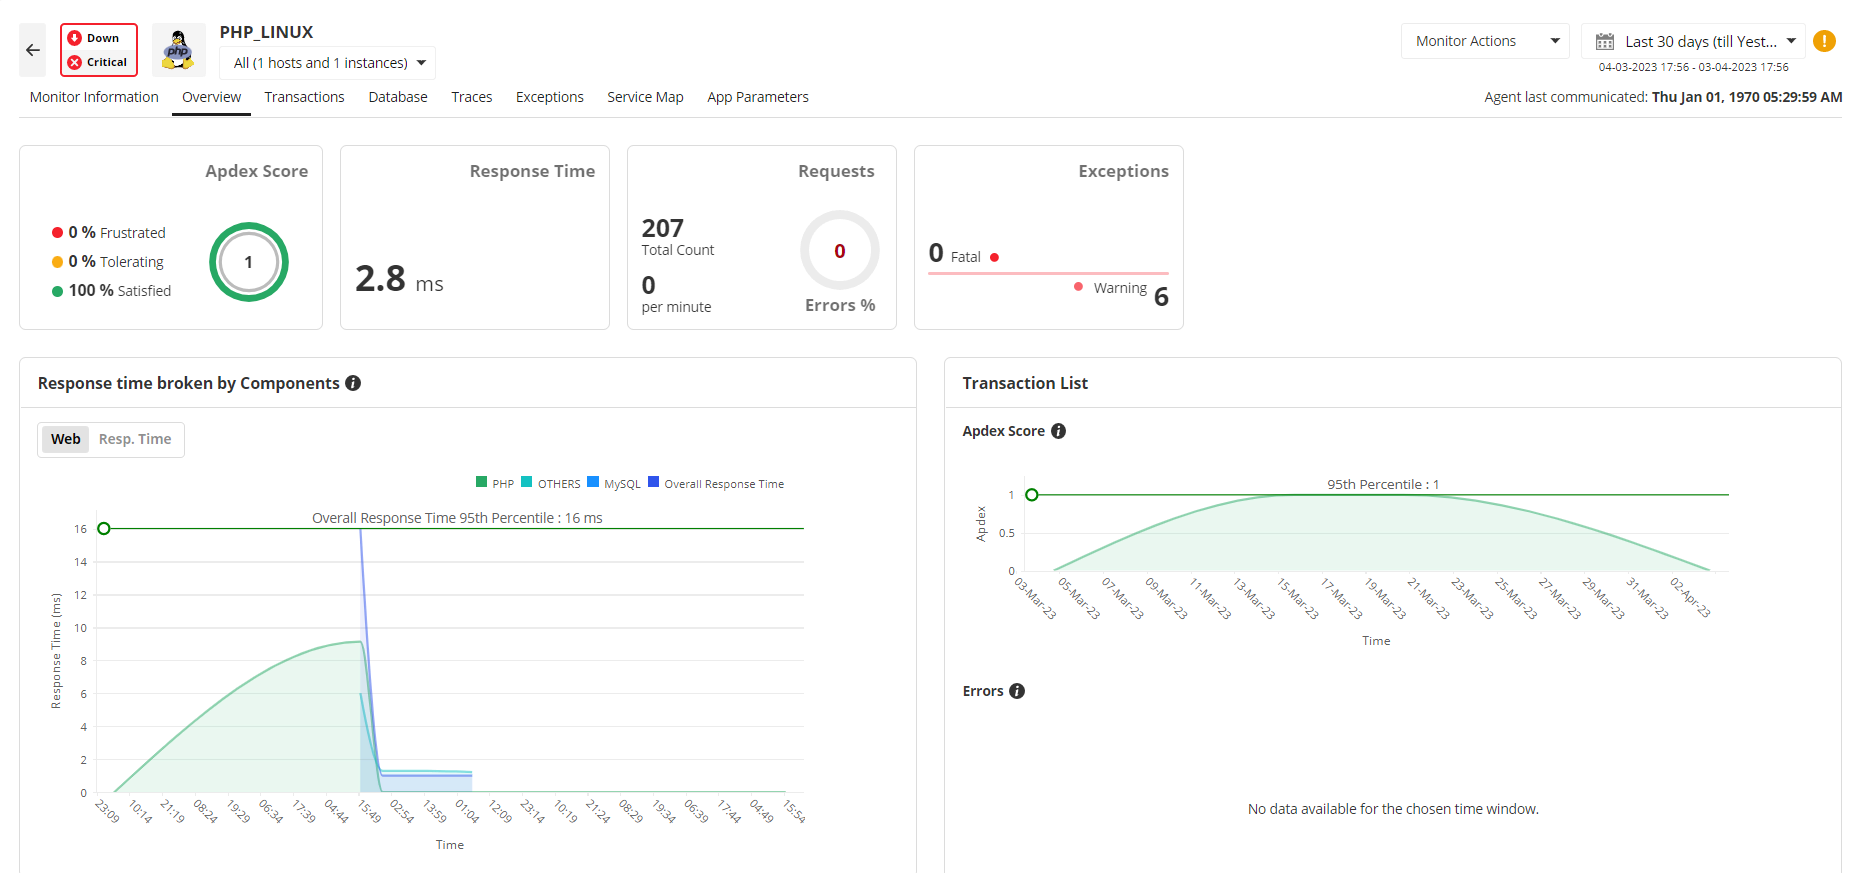
Effective PHP monitoring isn't just about identifying problems; it's about leveraging data to drive continuous improvement and achieve sustained **PHP performance optimization**. ManageEngine Applications Manager provides a wealth of actionable insights derived from the collected performance metrics and error data.
By analyzing trends in response times, resource utilization (CPU, memory, network), and database performance over time, IT teams can make informed decisions regarding infrastructure scaling, code refactoring priorities, and capacity planning.
The tool’s reporting capabilities allow for deep dives into specific components, identifying areas for resource optimization or architectural improvements. For instance:
- Detailed insights into frequently executed, slow queries can guide database indexing strategies.
- Analysis of CPU-intensive functions can pinpoint areas for code optimization.
This data-driven approach transforms reactive troubleshooting into a strategic advantage, enabling organizations to proactively enhance their PHP applications' efficiency, scalability, and resilience, ensuring they meet evolving business demands and deliver exceptional user experiences.
The [PHP performance monitoring](https://www.manageengine.com/products/applications_manager/php-performance-monitoring.html) feature helps optimize PHP server performance and also provides comprehensive management reports. It ensures availability through automated event escalation via email, SMS etc., and helps take corrective action by executing user scripts that can help restart a service, etc.
**The components that are monitored in PHP are:**
| Component | Description |
|---|---|
| Availability | Checks for the availability of PHP Server. |
| Response Time | Gives the response time of the PHP Server. |
| Page faults | Gives the page faults in the PHP applications. |
| Busy Servers | Gives the number of busy and idle servers. |
| Bytes Transferred | Shows the rate of byte transfer in bytes/sec. |
## PHP Monitoring Tool Capabilities
- Out-of-the-box PHP server monitoring.
- Monitor PHP performance statistics like page faults, response times, busy servers, and much more with Applications Manager's PHP application monitoring.
- Based on the thresholds configured, notifications and alarms are generated if the PHP or any specified attribute within the system has problems. Actions are executed automatically based on configurations.
- Performance graphs and reports are available instantly. Reports can be grouped and displayed based on availability, health, and connection time.
- Applications Manager's PHP monitoring solution delivers both historical and current PHP performance metrics, delivering insight into performance over a period of time.
| Related Monitoring | |
|---|---|
| - [Linux Server Monitoring](https://www.manageengine.com/products/applications_manager/linux-monitoring.html)
- [Ruby Web Transaction Monitoring](https://www.manageengine.com/products/applications_manager/ruby-webtransaction-monitoring.html) | - [IIS Apache Monitoring](https://www.manageengine.com/products/applications_manager/apache-monitoring.html)
- [MySQL Monitoring](https://www.manageengine.com/products/applications_manager/mysql-monitoring.html) |