|
|||||||||||

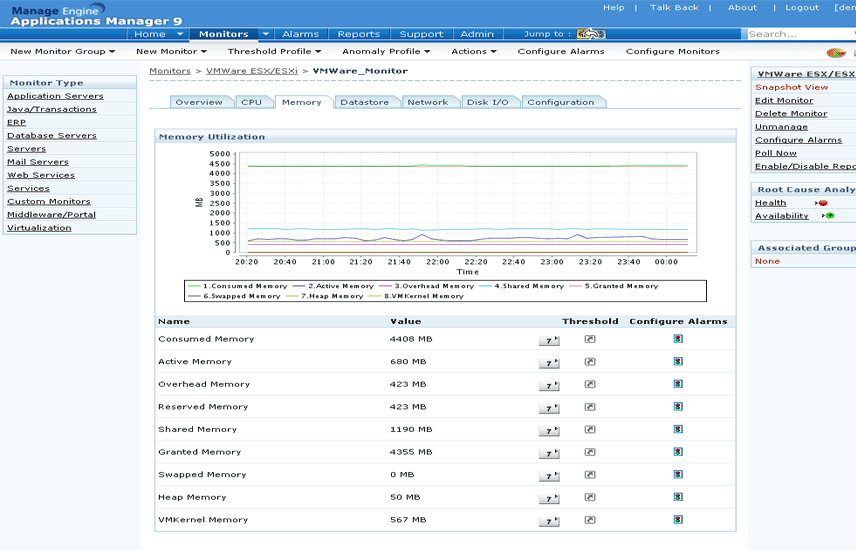
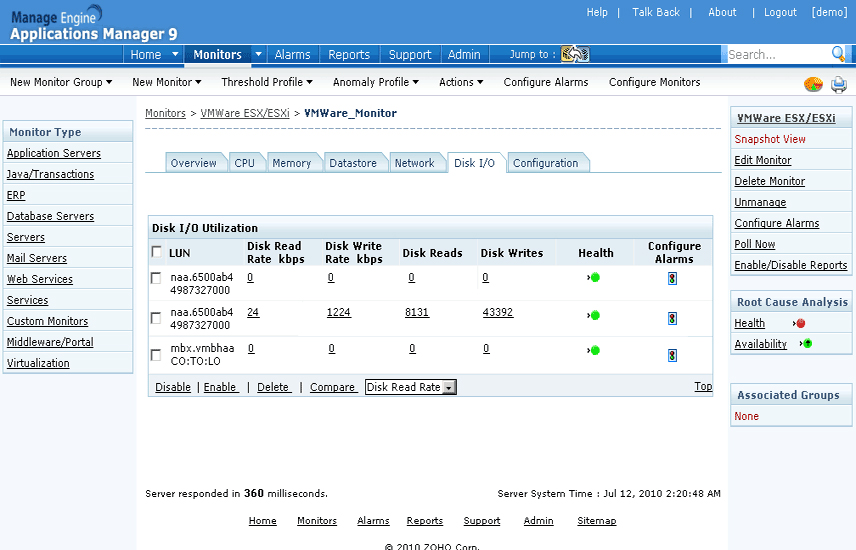
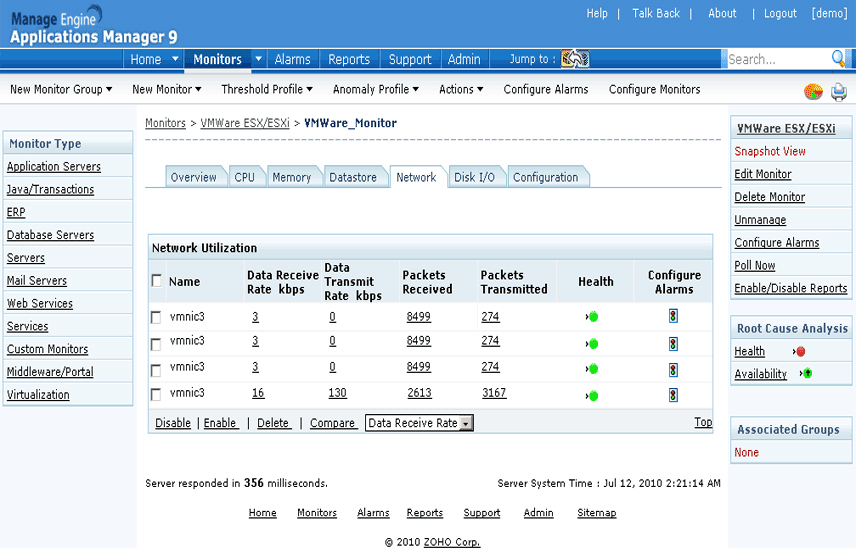
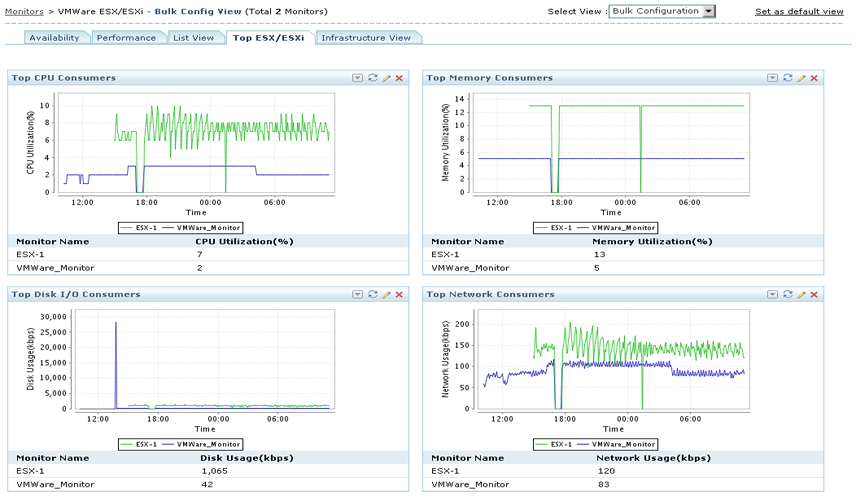
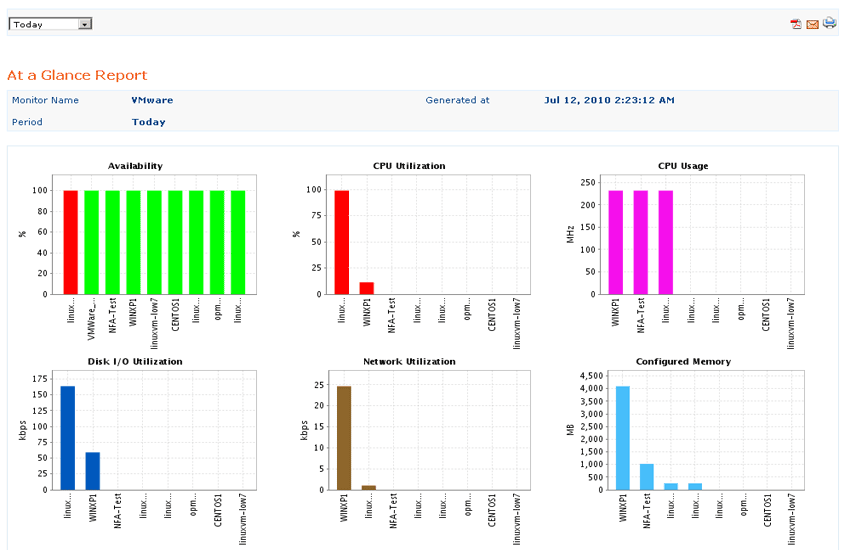
Virtualization: Out-of-the-box support for VMware Monitoring
Monitor availability and performance of VMware ESX/ESXi host servers and their guest virtual machine instances. Metrics shown include CPU, memory and network utilization stats, disk usage details including Disk I/O stats, top virtual machines consuming server resources, etc.
You can manage both physical and virtual components of a heterogeneous IT environment using a single console. With the help of end-user monitoring, you can also manage user experience before and after virtualization.
| Screenshots | ||||||||||||
|

|
|||||||||||

PostgreSQL Database Monitoring
• Monitor the health and performance of your PostgreSQL database servers.
• Metrics provided include disk utilization, query, lock, connection & buffer statistics, index scan & transaction details, etc.
• Quickly identify, analyze and resolve bottlenecks impacting PostgreSQL response time.
• Make sure your PostgreSQL database servers are optimized for peak performance and cut down expenses through improved database control.
| Screenshots | ||||||||
|


|
|||||||||||
Memcached Monitoring
• Detect and resolve problems with your caching systems faster.
• Monitor performance indicators such as availability, health, cache hit ratio, CPU, memory usage, request metrics, network traffic, connections, transactions, cached items, etc.
• Ensure optimal performance of your dynamic database-driven web applications in the cloud.
| Screenshots | ||||||
|


|
|||||||||||
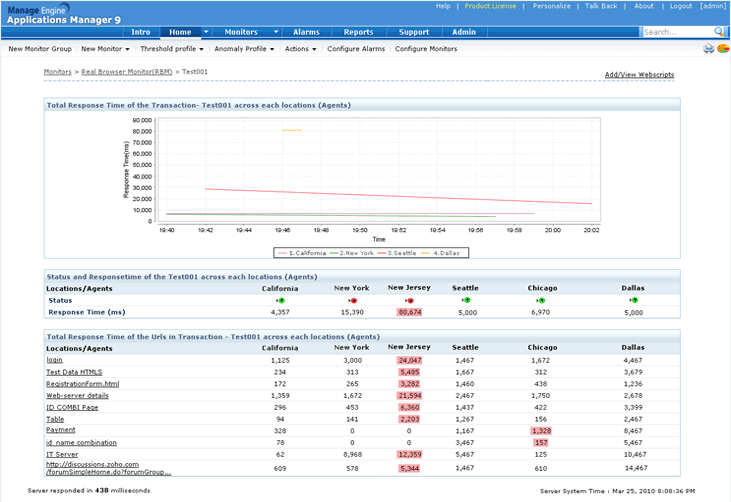
An improved Real Browser Monitor (RBM) Dashboard
• Get an overview of the performance status of your web transactions from multiple locations.
• Find the total response time of a transaction across each location
• Know the current status and response time of the transaction across each location and the total response time of the individual urls present within the transaction.
• This information will be particularly helpful to quickly troubleshoot web application performance issues, especially if your users are spread across different geographical regions.
 |
|
|||||||||||
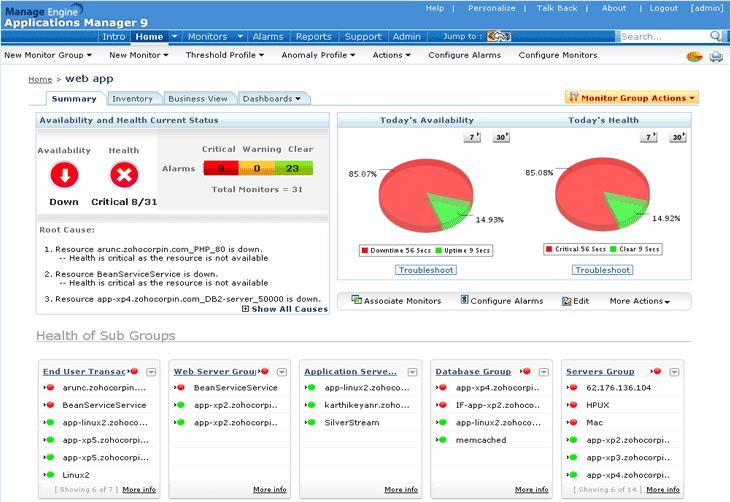
Web Application Group
The web application group is a new type of monitor group to organize your web infrastructure into logical components. It helps you:
• Save time and manual effort by organizing your monitors into sub-groups such as Application server group, database group, etc.
• Gain a better perspective of the availability, performance and downtimes of monitors.
• Find out the worst performers in a monitor group using the list of Top 10 Web Services /Web Transactions based on response time.
 |
|
|||||||||||
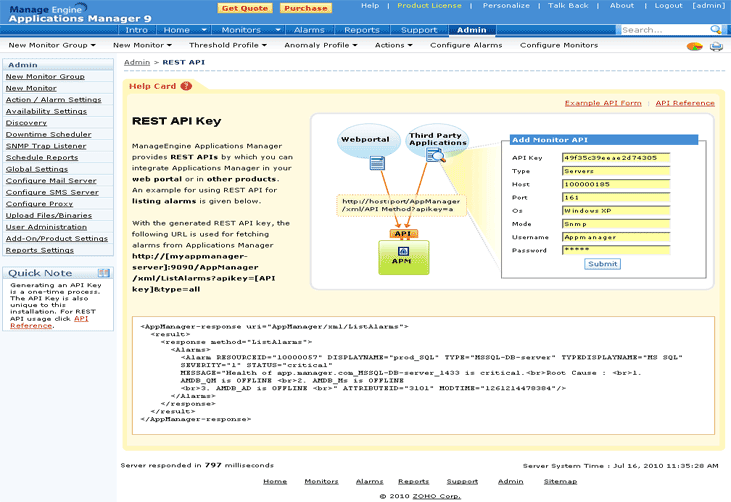
New APIs
We’ve added more REST APIs to help you integrate data from Applications Manager into third-party portals or services. The new set of APIs helps you create, edit and delete downtime schedulers in Applications Manager. You also get APIs to fetch data for the latest poll from the monitors as well as APIs to add servers and databases to Applications Manager.
 |
|
|||||||||||
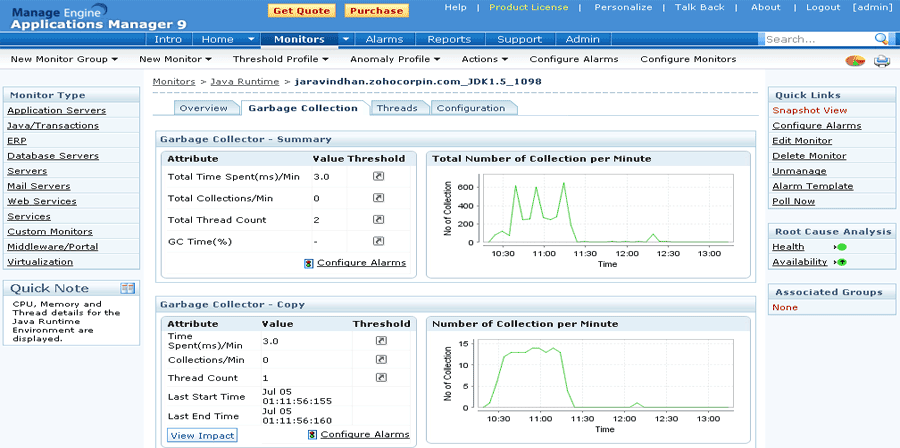
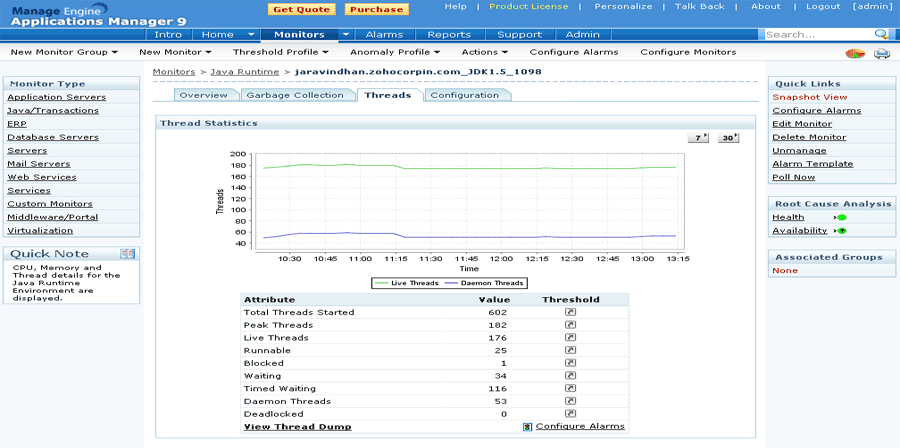
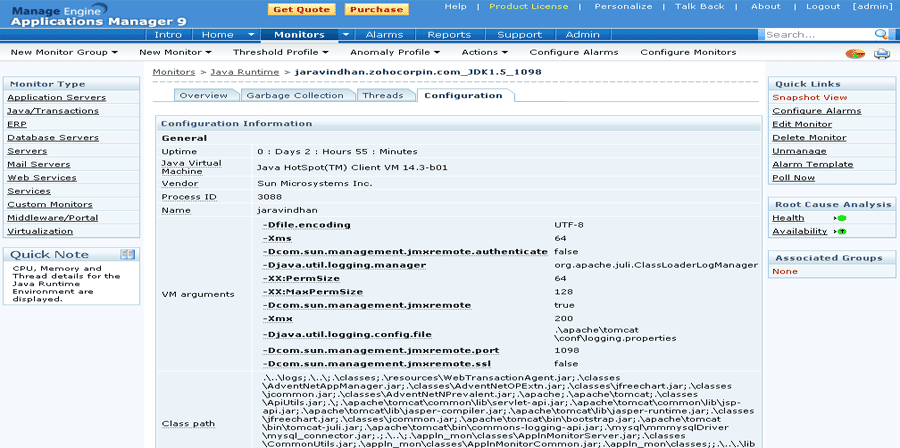
Enhancements to Java Runtime Monitor
• Know how garbage collection behaves in the Java Virtual Machine.
• Find out the impact of garbage collection on the thread dump with history
• View historical JVM configuration parameters.
| Screenshot | ||||||||
|

|
|||||||||||
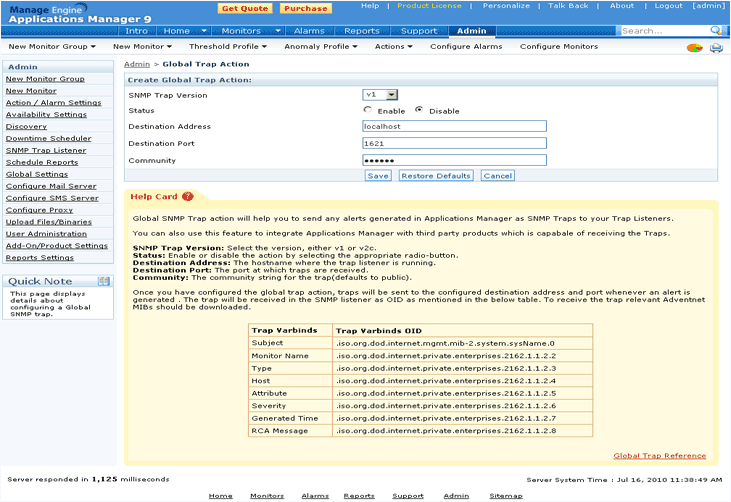
Configure Global SNMP Trap Action
Configure Global SNMP Trap action in Applications Manager and send alerts to external SNMP trap listeners. The alerts thus generated can be viewed by trap listeners at the corresponding destination address and port. There is support for SNMP trap versions v1 and v2c.
 |