| |||||||||||
Apache Geronimo Monitoring
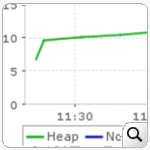
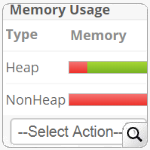
Track the performance of your Geronimo application server by monitoring key metrics such as classloading, heap and non-heap memory usage, buffer pool etc. Keep an eye on the datasources, EJB pools and bytes sent/ received per minute to diagnose and troubleshoot issues instantly. Know More
| |||||||||||
IBM DB2 for I Monitoring
Tune your IBM DB2 database server, ensure the availability and performance of your production databases, and gathering operating system level data to understand performance issues. Monitor Jobs status and health and optimize your DB2 server's resources by minimizing network traffic, disk I/O and CPU time. Know More
| |||||||||||
ManageEngine ADManager Plus Monitoring
Get critical information (like CPU and memory usage, thread count and PGSQL / MSSQL database details) essential to track the performance of ADManager Plus. Know More
| |||||||||||
Other features
- Support for Query monitoring for DB2 for I.
- Oracle Monitoring Enhancements:
- Oracle backup job details tab now displays last performed backup jobs details for each backup type.
- We now display the Invalid/Unusable Index Count in the database status table and also a table for Invalid/Unusable Indexes.
- We have added Data File Name column in the in the ‘Blocks Corrupted’ table.
- Enterprise Edition - Option to add server down instruction in down mail of the manager server.
- Execute Action option from the Alarm List View
- Enhanced ManageEngine OpManager Monitoring with MSSQL database stats.
- Enhanced PostgreSQL Monitoring with current query execution stats.
- Enhanced SDP Monitoring with PGSQL & MSSQL database statistics.
- Option to display SubGroups in the Monitor Group Widget.
- Option to view Monitor Group as Status Lights in the Business View.

