Integrating Endpoint Central Cloud with Power BI Desktop
Introduction
The Endpoint Central Custom Connector enables users to fetch and analyze data from Endpoint Central Cloud directly within Power BI Desktop. This integration allows administrators to build powerful visualizations and reports using endpoint management data from their Endpoint Central environment.
This document provides step-by-step guidance on integrating Endpoint Central Cloud with Power BI Desktop using the Endpoint Central Custom Connector to retrieve and visualize data.
Table of contents
Prerequisites
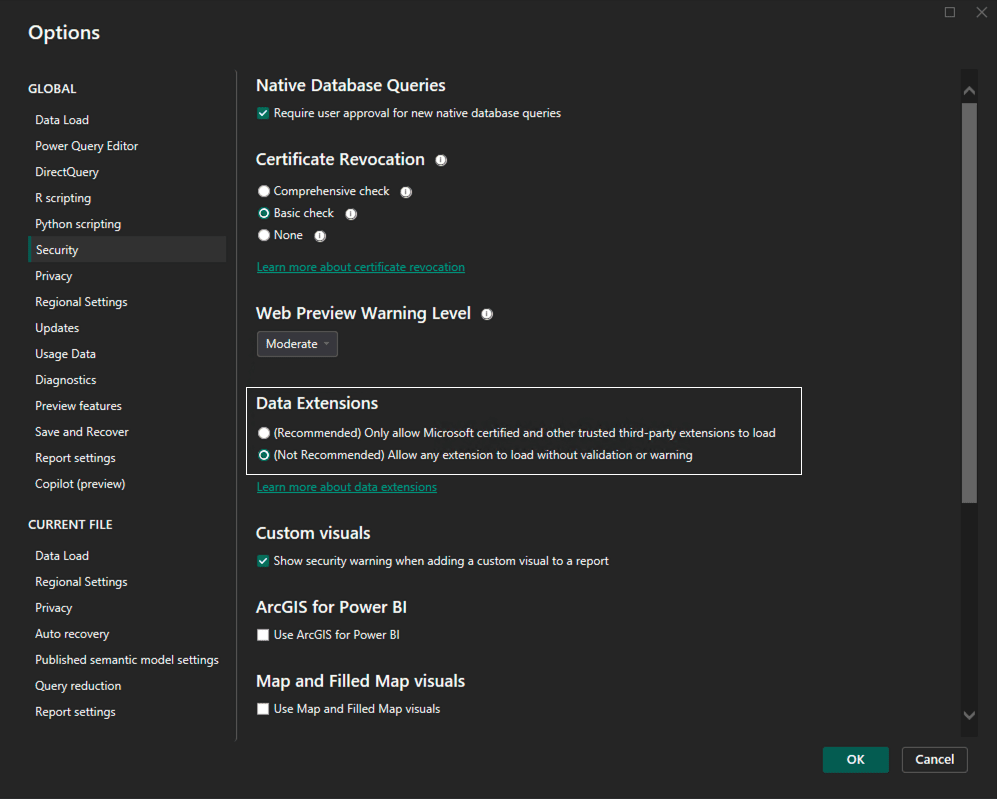
- Enable the Power BI Desktop option to bypass custom connector trust verification:
- Open Power BI Desktop.
- Go to File > Options > Security.
- Enable the option “Allow any extension to load without validating or warning”.
Integration Steps
- Download the Endpoint Central Connector file.(SHA Checksum: b13e7313725d16fa4e68ea51e938219a862398bc6e05a8132c0531f225801e77)
- Move the downloaded file to the following directory:<Your Documents Folder>\Power BI Desktop\Custom ConnectorsExampleExample: C:\Users\Administrator\Documents\Power BI Desktop\Custom Connectors
Create a folder named Custom Connectors if it does not already exist.
- Close and reopen Power BI Desktop to load the connector.
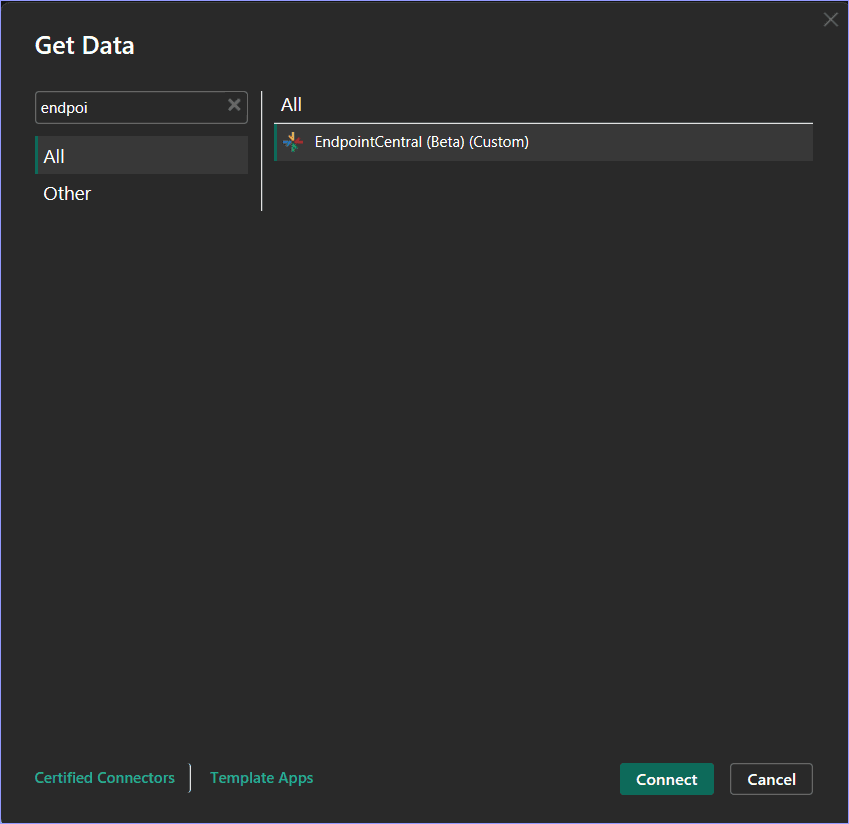
- In Power BI Desktop, go to Get Data, search for EndpointCentral, and click Connect.
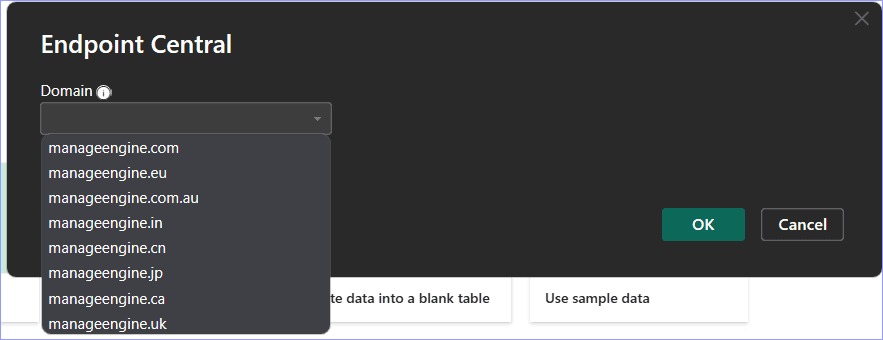
- Select your domain based on your Endpoint Central Data Center and click OK.
- Click Sign In, log in using your Endpoint Central account credentials, and click Accept to grant permissions.
- Once authenticated, click Connect to proceed.
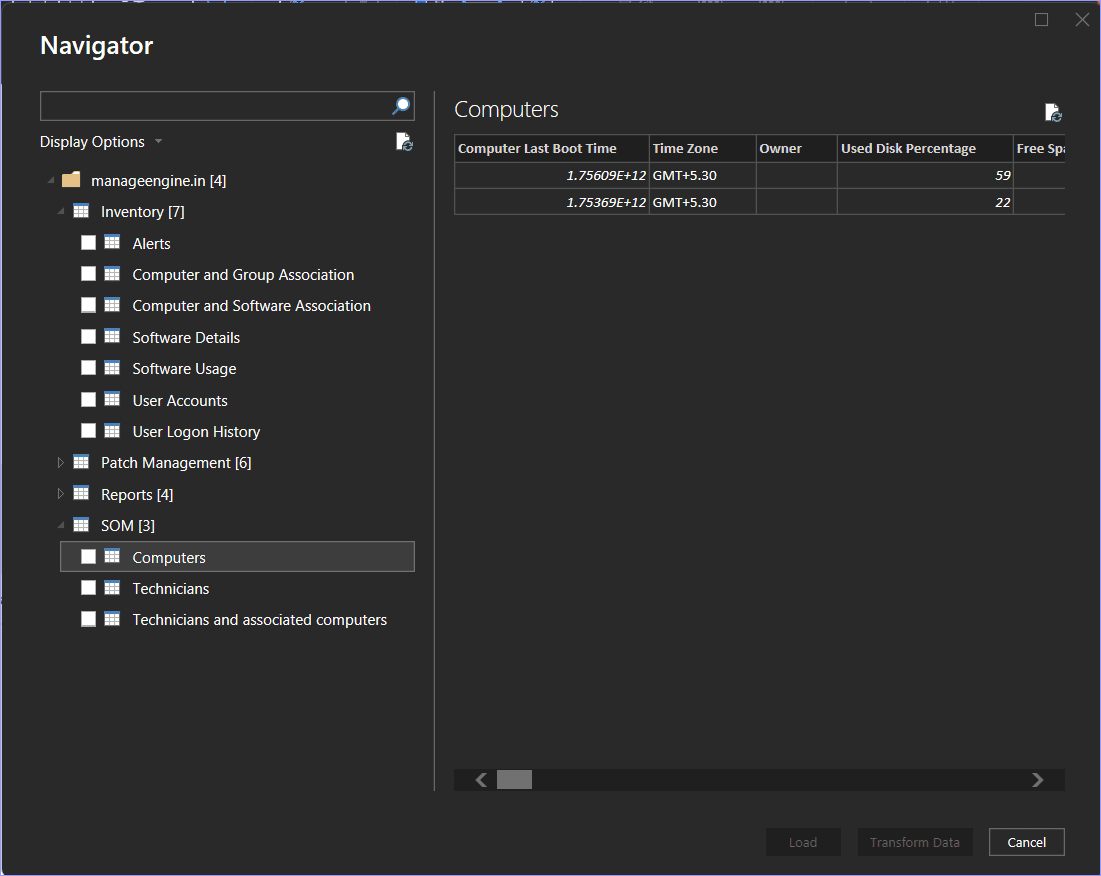
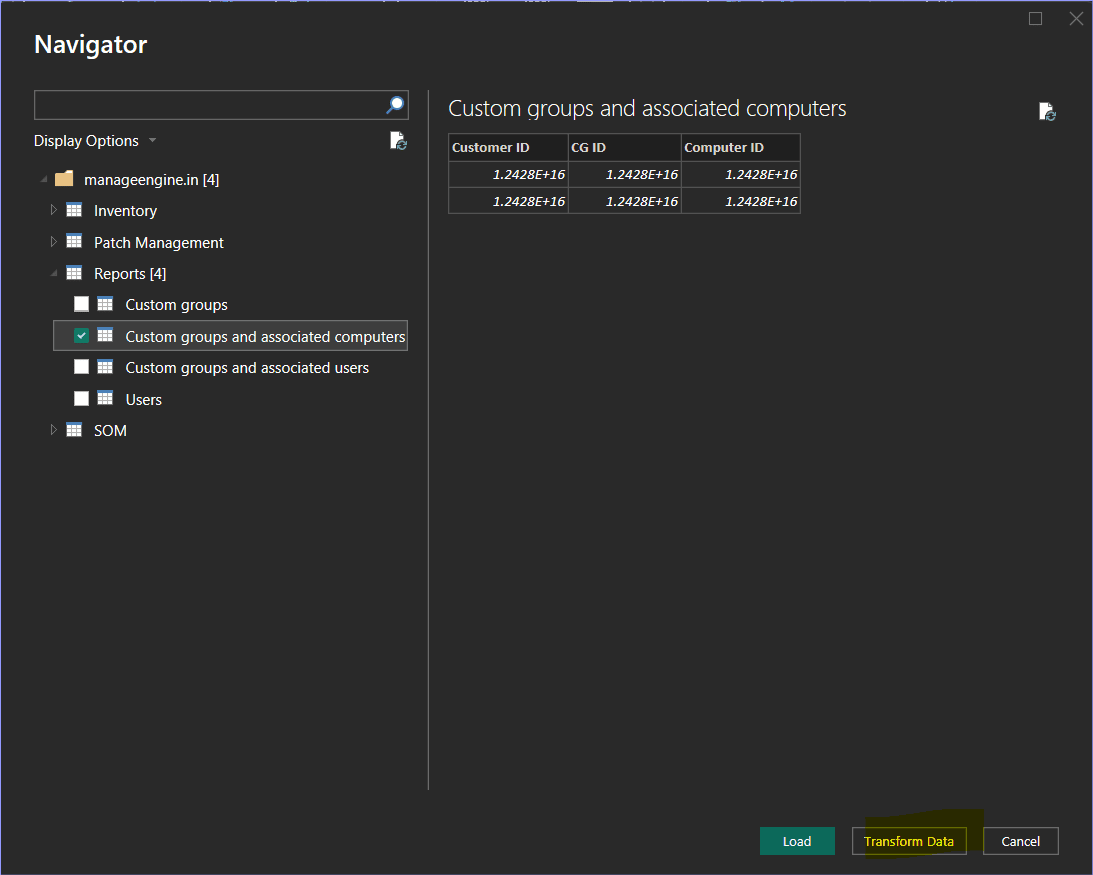
- The connector will list all available modules for your account. Expand the drop-down list and select the required tables under each module.
- A sample data preview will appear in the right-hand pane for verification.
Handling Exponential Data Format
Some columns may display data in exponential format. To make these values readable, use one of the following methods:
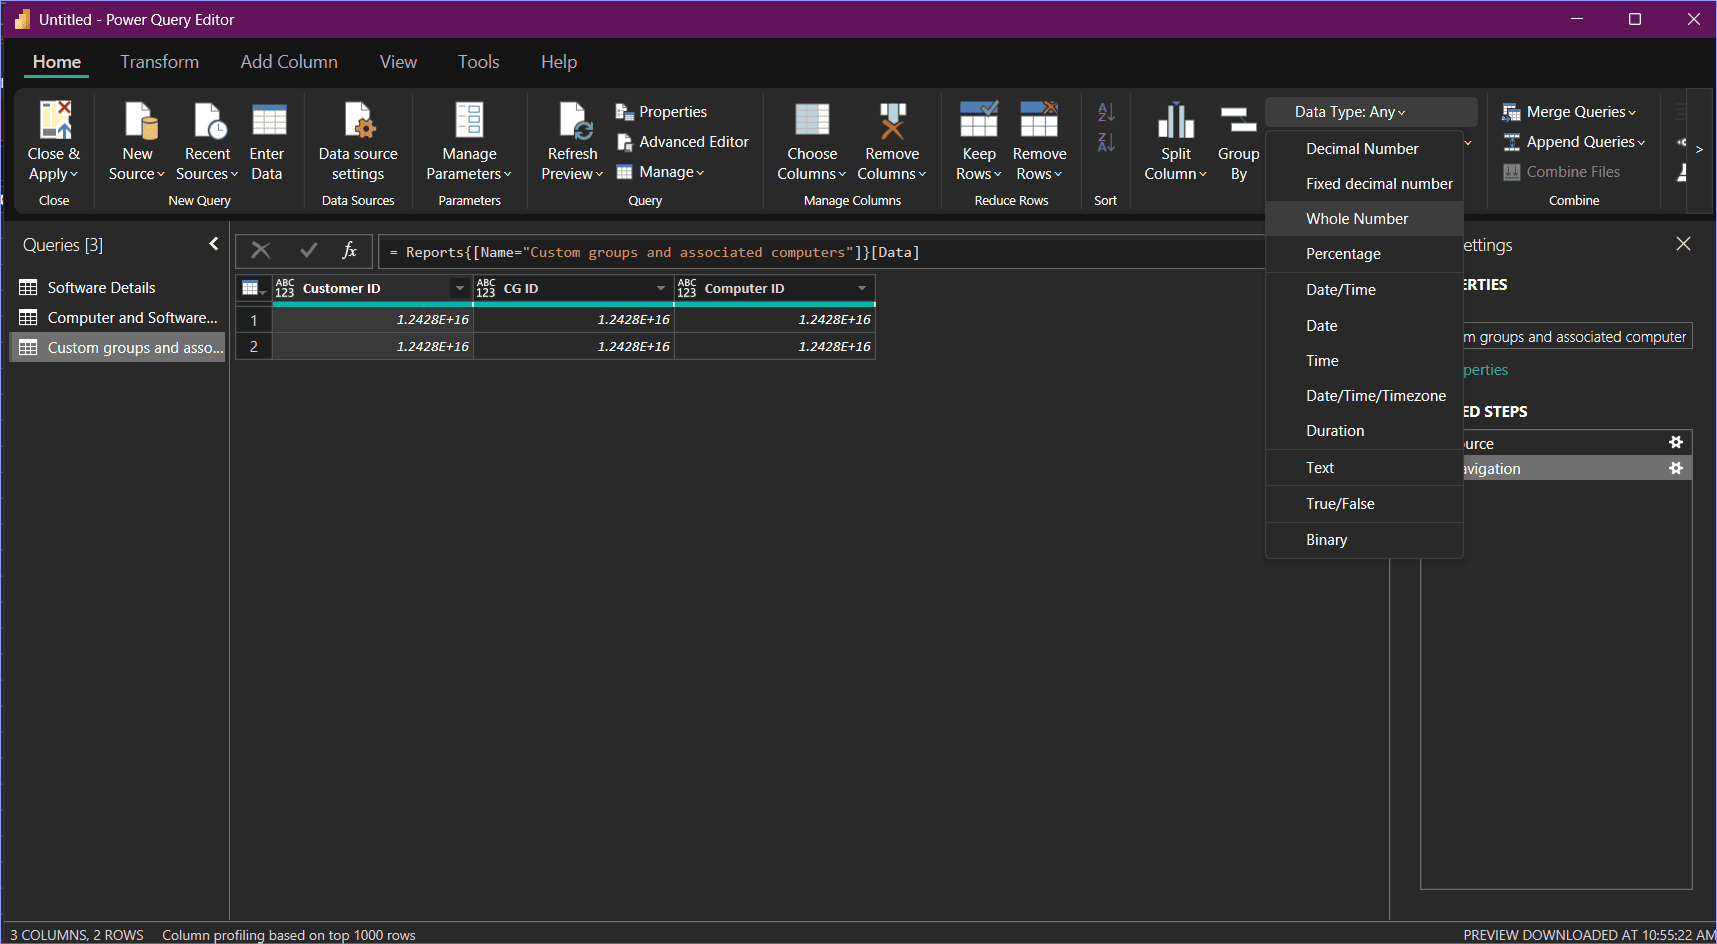
Option 1: During “Transform Data”
- Identify the affected column in the data preview window and click Transform Data.
- In the Power Query Editor, select the column, go to Data Type, and choose Whole Number.
- Click Apply & Close.
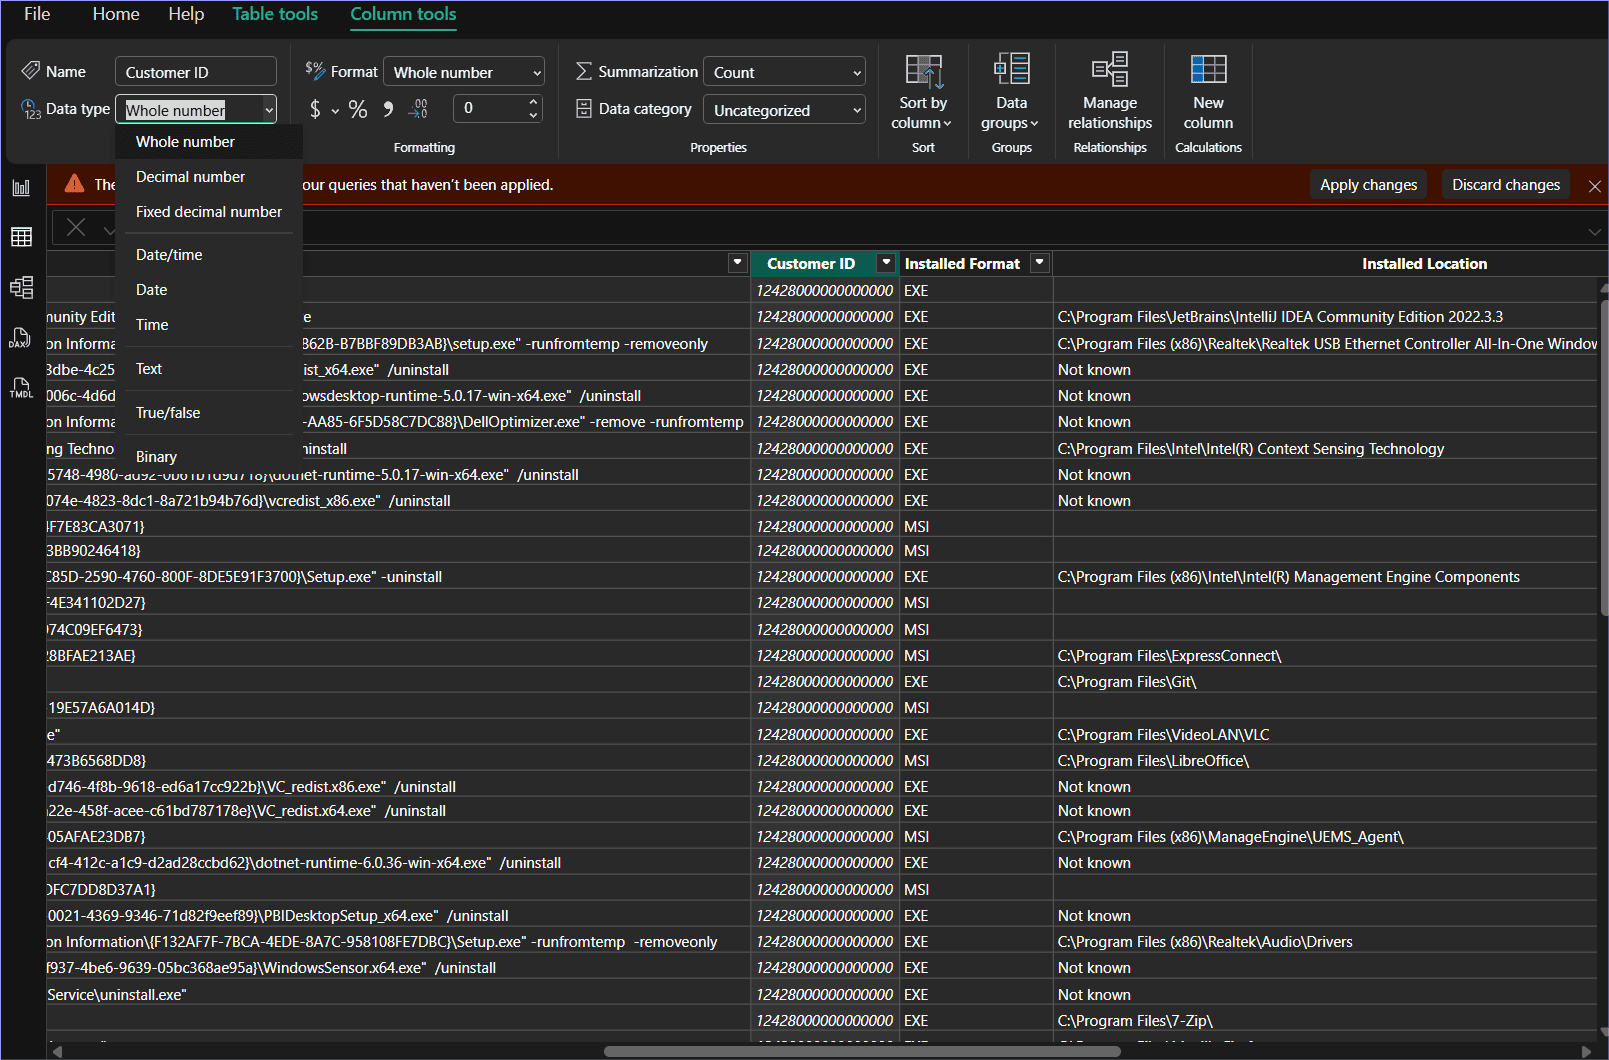
Option 2: After Data Load
- In the Table View, select the column.
- Go to Column Tools > Data Type and select Whole Number.
Note: This is a one-time action. Once updated, Power BI will retain the data type even after future refreshes.
Saving and Creating Dashboards
- Use the imported data to create custom reports and dashboards in Power BI.
- Go to File > Save and store your project as a .pbix file for future use.
Troubleshooting Steps
Ensure Latest Power BI Desktop Version
Verify that you are using the most recent version of Power BI Desktop.
Enable Diagnostic Logging
- Open Power BI Desktop.
- Go to File > Options and settings > Options > Diagnostics.
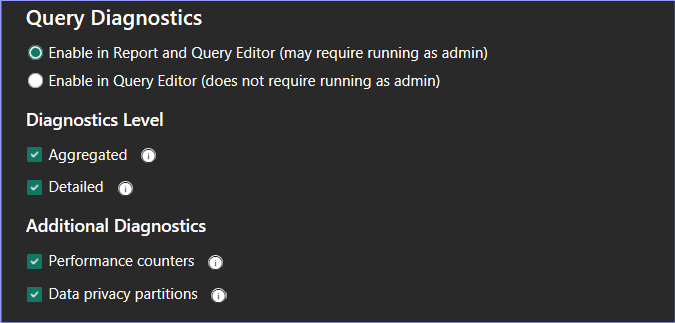
- Check Enable tracing and enable all Diagnostics levels and Additional Diagnostics options.
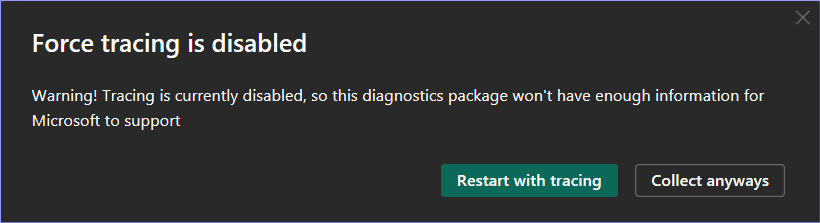
- Click Collect Diagnostic Information and choose Restart with Tracking when prompted.
- After restarting, confirm that all selected options remain active.
Reproduce the Error
- Go to File > Options and settings > Data Source Settings.
- Clear all existing permissions.
- Repeat the steps that trigger the error to generate logs.
Locate Trace Logs
- Navigate to the Traces folder:%LocalAppData%\Microsoft\Power BI Desktop\
- Zip the Traces folder.
Collect Diagnostic Information
- Go to File > Options and settings > Options > Diagnostics > Collect Diagnostic Information.
- Choose the destination folder for the zip file.
- Power BI will create a file named PBIDesktopDiagnosticInfo.<Date>.zip in the selected location.
- Share both the trace and diagnostic zip files with the Endpoint Central Cloud support team for analysis.