Application Log Reports
The Application Reports provide different reports available for each application.
To view the reports use the following menu options:
- Home tab > Applications > Host Name: <host name of the machine associated with application>
- Reports tab > Detailed Application Reports section > View Report: <Application Name> Logs
The Detailed Application Reports section lists the Log Type, Report Description and View Report columns of the reports of each application log. View Report column contains links to open the various reports of the selected application log.
The supported application log types are:
Reports for MS IIS W3C Web Server Logs
Clicking the View Report link opens the Reports for MS IIS W3C Web Server Logs page.
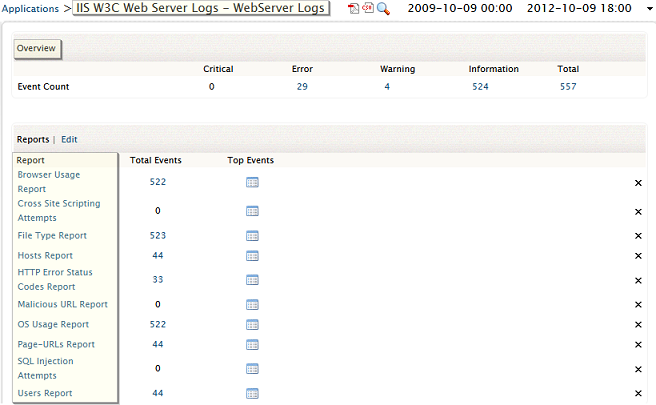
The Overview section on top of the page displays the event count in the Event Count table. In the table event count is classified based on the severity Critical, Error, Warning, Information, and Total and displayed in the columns of the table. Below the Event Count table, the page displays the event count for each host under Hosts sub section. In the Hosts table, the host names are listed under Name column and event count is classified based on the severity Critical, Error, Warning, Information, and Total and displayed in the columns of the table against each host. The Report section at bottom of the page displays the various reports generated in the Report column of the table. The total events and top events of each report are listed in the Total Events and Top Events columns. There are delete icon links against each report to delete the report. The Report section header contains Edit Report List link to edit list of reports for the application. A report can be removed or added to the list from the link menu option.
EventLog Analyzer generates the following pre-defined reports for web server application logs:
- Hosts Report - the details covered in this report are: Client IP Address, Hits, Page Views, Bytes Sent, and Events
- Users Report - the details covered in this report are: Username, Hits, Page Views, Bytes Sent, and Events
- File Type Report - the details covered in this report are: File Type, Hits, Percentage, Bytes Sent, and Events
- Page URLs Report - the details covered in this report are: URI Stem, Hits, Page Views, Bytes Sent, and Events
- Browser Usage Report - the details covered in this report are: Browser, Hits, Percentage, and Events
- OS Usage Report - the details covered in this report are: OS, Hits, Percentage, and Events
- HTTP Error Status Code Report - the details covered in this report are: HTTP Status, Hits, Percentage, and Events
- Malicious URL Report - the details covered in this report are: URI Stem, Hits, Percentage, and Events
- Cross Site Scripting Attempts Report - the details covered in this report are: Client IP Address, User Name, and Events
- SQL Injection Attempts Report - the details covered in this report are: Client IP Address, User Name, and Events
Reports for MS IIS W3C FTP Server Logs
Clicking the View Report link opens the Reports for MS IIS W3C FTP Server Logs page.
The Overview section on top of the page displays the event count in the Event Count table. In the table event count is classified based on the severity Critical, Error, Warning, Information, and Total and displayed in the columns of the table. Below the Event Count table, the page displays the event count for each host under Hosts sub section. In the Hosts table, the host names are listed under Name column and event count is classified based on the severity Critical, Error, Warning, Information, and Total and displayed in the columns of the table against each host. The Report section at bottom of the page displays the various reports generated in the Report column of the table. The total events and top events of each report are listed in the Total Events and Top Events columns. There are delete icon links against each report to delete the report. The Report section header contains Edit Report List link to edit list of reports for the application. A report can be removed or added to the list from the link menu option.
EventLog Analyzer generates the following pre-defined reports for FTP server application logs:
- Hosts Report - the details covered in this report are: Client IP Address,
Bytes Sent,
Bytes Received, and
Events
- Users Report - the details covered in this report are: Username, Bytes Sent,
Bytes Received, and
Events
- File Type Report - the details covered in this report are: File Type, File Transfers, Bytes Sent, Bytes Received, and Events
- Server Services Report - the details covered in this report are: Server Service, File Transfers, Bytes Sent, Bytes Received, and Events
- Server IPs Report - the details covered in this report are: Server IP Address, File Transfers, Bytes Sent, Bytes Received, and Events
- Source Port Report - the details covered in this report are: Server Port, File Transfers, Bytes Sent, Bytes Received, and Events
Reports for DHCP Windows Server Logs
Clicking the View Report link opens the Reports for DHCP Windows Server Logs page.
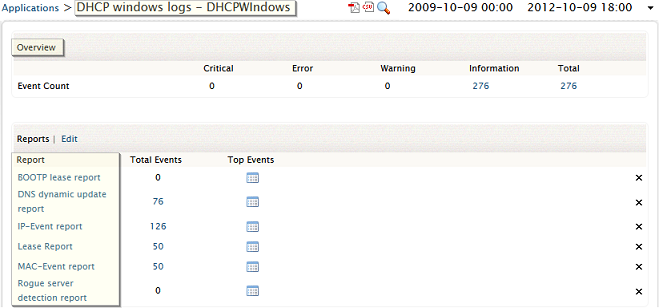
The Overview section on top of the page displays the event count in the Event Count table. In the table event count is classified based on the severity Critical, Error, Warning, Information, and Total and displayed in the columns of the table. Below the Event Count table, the page displays the event count for each host under Hosts sub section. In the Hosts table, the host names are listed under Name column and event count is classified based on the severity Critical, Error, Warning, Information, and Total and displayed in the columns of the table against each host. The Report section at bottom of the page displays the various reports generated in the Report column of the table. The total events and top events of each report are listed in the Total Events and Top Events columns. There are delete icon links against each report to delete the report. The Report section header contains Edit Report List link to edit list of reports for the application. A report can be removed or added to the list from the link menu option.
EventLog Analyzer generates the following pre-defined reports for DHCP windows server application logs:
- Lease Report - the details covered in this report are: Lease Report and Events
- BOOTP lease report - the details covered in this report are:
Events
- DNS dynamic update report - the details covered in this report are: DNS update details and
Events. The DNS update details are, DNS dynamic update request and
DNS dynamic update successful
- Rogue server detection report - the details covered in this report are:
Events
- IP-Event report - the details covered in this report are: IP Address and
Events
- MAC-Event report - the details covered in this report are: MAC Address and
Events
Reports for DHCP Linux Server Logs
Clicking the View Report link opens the Reports for DHCP Linux Server Logs page.
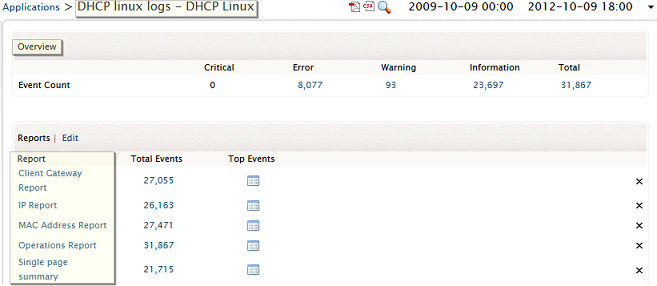
The Overview section on top of the page displays the event count in the Event Count table. In the table event count is classified based on the severity Critical, Error, Warning, Information, and Total and displayed in the columns of the table. Below the Event Count table, the page displays the event count for each host under Hosts sub section. In the Hosts table, the host names are listed under Name column and event count is classified based on the severity Critical, Error, Warning, Information, and Total and displayed in the columns of the table against each host. The Report section at bottom of the page displays the various reports generated in the Report column of the table. The total events and top events of each report are listed in the Total Events and Top Events columns. There are delete icon links against each report to delete the report. The Report section header contains Edit Report List link to edit list of reports for the application. A report can be removed or added to the list from the link menu option.
EventLog Analyzer generates the following pre-defined reports for DHCP Linux server application logs:
- Operations Report - the details covered in this report are: Operation and
Events. The operations are: DHCPREQUEST,
DHCPNAK,
DHCPDISCOVER,
DHCPOFFER,
DHCPACK,
DHCPINFORM,
if IN, delete, Wrote, DHCPRELEASE, and
Abandoning IP
- MAC-Event report - the details covered in this report are: MAC Address and
Events
- Client Gateway Report - the details covered in this report are: Gateway and
Events
- IP-Event report - the details covered in this report are: IP Address and
Events
- Single Page Summary Report - the details covered in this report are: Logging device,
Operation,
IP Address,
MAC Address,
Gateway, and
Events
Reports for MS SQL Server Logs
Clicking the View Report link opens the Reports for MS SQL Database Server Logs page.
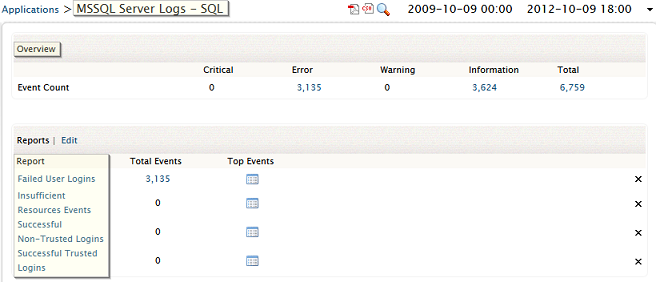
The Overview section on top of the page displays the event count in the Event Count table. In the table event count is classified based on the severity Critical, Error, Warning, Information, and Total and displayed in the columns of the table. Below the Event Count table, the page displays the event count for each host under Hosts sub section. In the Hosts table, the host names are listed under Name column and event count is classified based on the severity Critical, Error, Warning, Information, and Total and displayed in the columns of the table against each host. The Report section at bottom of the page displays the various reports generated in the Report column of the table. The total events and top events of each report are listed in the Total Events and Top Events columns. There are delete icon links against each report to delete the report. The Report section header contains Edit Report List link to edit list of reports for the application. A report can be removed or added to the list from the link menu option.
EventLog Analyzer generates the following pre-defined reports for MS SQL database server application logs:
- Successful Trusted Logins - the details covered in this report are: Username and
Events
- Successful Non-Trusted Logins - the details covered in this report are: Username and
Events
- Failed User Logins - the details covered in this report are: Username and
Events
- Insufficient Resources Events - the details covered in this report are: Events
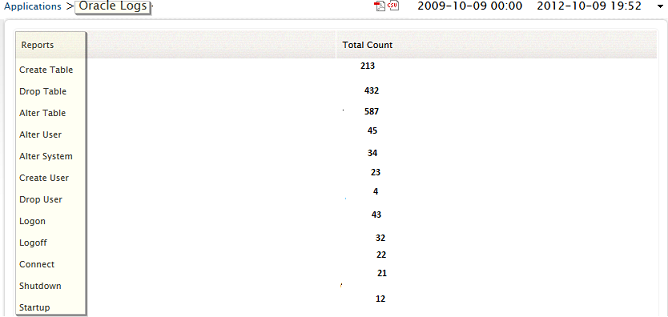
Reports for Oracle Audit Logs
Clicking the View Report link opens the Reports for Oracle Database Server Logs page.
The Overview section on top of the page displays the event count in the Event Count table. In the table event count is classified based on the severity Critical, Error, Warning, Information, and Total and displayed in the columns of the table. Below the Event Count table, the page displays the event count for each host under Hosts sub section. In the Hosts table, the host names are listed under Name column and event count is classified based on the severity Critical, Error, Warning, Information, and Total and displayed in the columns of the table against each host. The Report section at bottom of the page displays the various reports generated in the Report column of the table. The total events and top events of each report are listed in the Total Events and Top Events columns. There are delete icon links against each report to delete the report. The Report section header contains Edit Report List link to edit list of reports for the application. A report can be removed or added to the list from the link menu option.
EventLog Analyzer generates the following pre-defined reports for Oracle database server application logs:
- Create Table - the details covered in this report are: SESSIONID,
ENTRYID,
USERID,
USERHOST,
TERMINAL,
RETURNCODE,
OBJ$CREATOR,
OBJ$NAME, and Time
- Drop Table - the details covered in this report are: SESSIONID,
ENTRYID,
USERID,
USERHOST,
TERMINAL,
RETURNCODE,
OBJ$CREATOR,
OBJ$NAME, and Time
- Alter Table - the details covered in this report are: SESSIONID,
ENTRYID,
USERID,
USERHOST,
TERMINAL,
RETURNCODE,
OBJ$CREATOR,
OBJ$NAME, and Time
- Alter User - the details covered in this report are: SESSIONID,
ENTRYID,
USERID,
USERHOST,
TERMINAL,
RETURNCODE,
OBJ$NAME, and Time
- Alter System - the details covered in this report are: SESSIONID,
ENTRYID,
USERID,
USERHOST,
TERMINAL,
RETURNCODE,
and Time
- Create User - the details covered in this report are: SESSIONID,
ENTRYID,
USERID,
USERHOST,
TERMINAL,
RETURNCODE,
OBJ$NAME, and Time
- Drop User - the details covered in this report are: SESSIONID,
ENTRYID,
USERID,
USERHOST,
TERMINAL,
RETURNCODE,
OBJ$NAME, and Time
- Logon - the details covered in this report are: SESSIONID,
ENTRYID,
USERID,
USERHOST,
TERMINAL,
RETURNCODE,
and Time
- Logoff - the details covered in this report are: SESSIONID,
ENTRYID,
USERID,
USERHOST,
TERMINAL,
RETURNCODE,
and Time
- Connect - the details covered in this report are: DATABASE USER,
PRIVILEGE,
CLIENT USER,
CLIENT TERMINAL,
Status, and
Time
- Shutdown - the details covered in this report are: DATABASE USER,
PRIVILEGE,
CLIENT USER,
CLIENT TERMINAL,
Status, and
Time
- Startup - the details covered in this report are: DATABASE USER,
PRIVILEGE,
CLIENT USER,
CLIENT TERMINAL,
Status, and
Time
- All Logs - This is created only as a custom report and is not available as a pre-built report
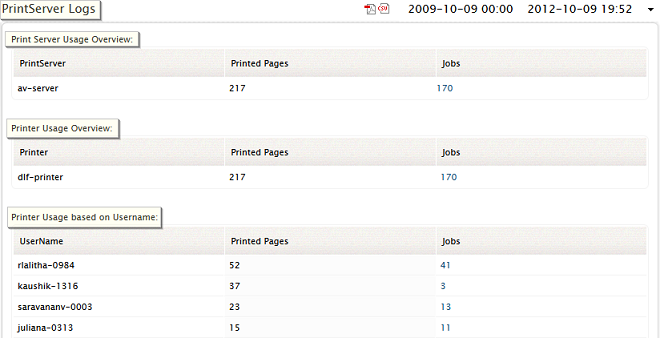
Reports for Print Server Logs
Clicking the View Report link opens the Reports for Print Server Logs page.
The Overview section on top of the page displays the event count in the Event Count table. In the table event count is classified based on the severity Critical, Error, Warning, Information, and Total and displayed in the columns of the table. Below the Event Count table, the page displays the event count for each host under Hosts sub section. In the Hosts table, the host names are listed under Name column and event count is classified based on the severity Critical, Error, Warning, Information, and Total and displayed in the columns of the table against each host. The Report section at bottom of the page displays the various reports generated in the Report column of the table. The total events and top events of each report are listed in the Total Events and Top Events columns. There are delete icon links against each report to delete the report. The Report section header contains Edit Report List link to edit list of reports for the application. A report can be removed or added to the list from the link menu option.
EventLog Analyzer generates the following pre-defined reports for Print server application logs:
- Print Server Hosts Overview - the details covered in this report are: Print Servers and Job Count
- Print Server Usuage Overview - the details covered in this report are: Print Server, Printed Pages, and Jobs
- Printer Usuage Overview - the details covered in this report are: Printer, Printed Pages, and Jobs
- Printer Usuage based on User Name - the details covered in this report are: User Name, Printed Pages, and Jobs
- Print Job Reports - the details covered in this report are: Reports and Total Counts and the Reports are, Print Usuage, Paused Document, Resumed Document, Deleted Documen, Moved Document, Timed Out Document, Corrupted Document, Priority Changed Document, and Insufficient Privilege Document
Reports for Apache Web Server Logs
Clicking the View Report link opens the Reports for Apache Web Server Logs page.
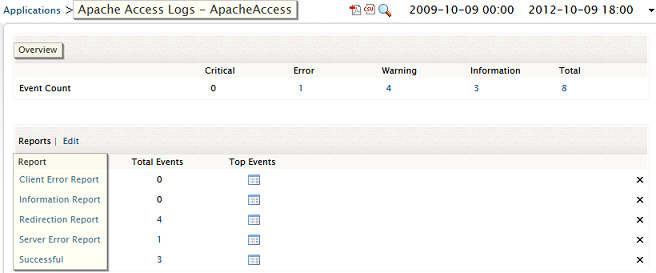
The Overview section on top of the page displays the event count in the Event Count table. In the table event count is classified based on the severity Critical, Error, Warning, Information, and Total and displayed in the columns of the table. Below the Event Count table, the page displays the event count for each host under Hosts sub section. In the Hosts table, the host names are listed under Name column and event count is classified based on the severity Critical, Error, Warning, Information, and Total and displayed in the columns of the table against each host. The Report section at bottom of the page displays the various reports generated in the Report column of the table. The total events and top events of each report are listed in the Total Events and Top Events columns. There are delete icon links against each report to delete the report. The Report section header contains Edit Report List link to edit list of reports for the application. A report can be removed or added to the list from the link menu option.
EventLog Analyzer generates the following pre-defined reports for Apache web server application logs:
- Client Error Report
- Information Report
- Redirection Report
- Server Error Report
- Successful
The details covered in the above reports are: Address, Status Code, Referrers, User Agents, and Event
|


